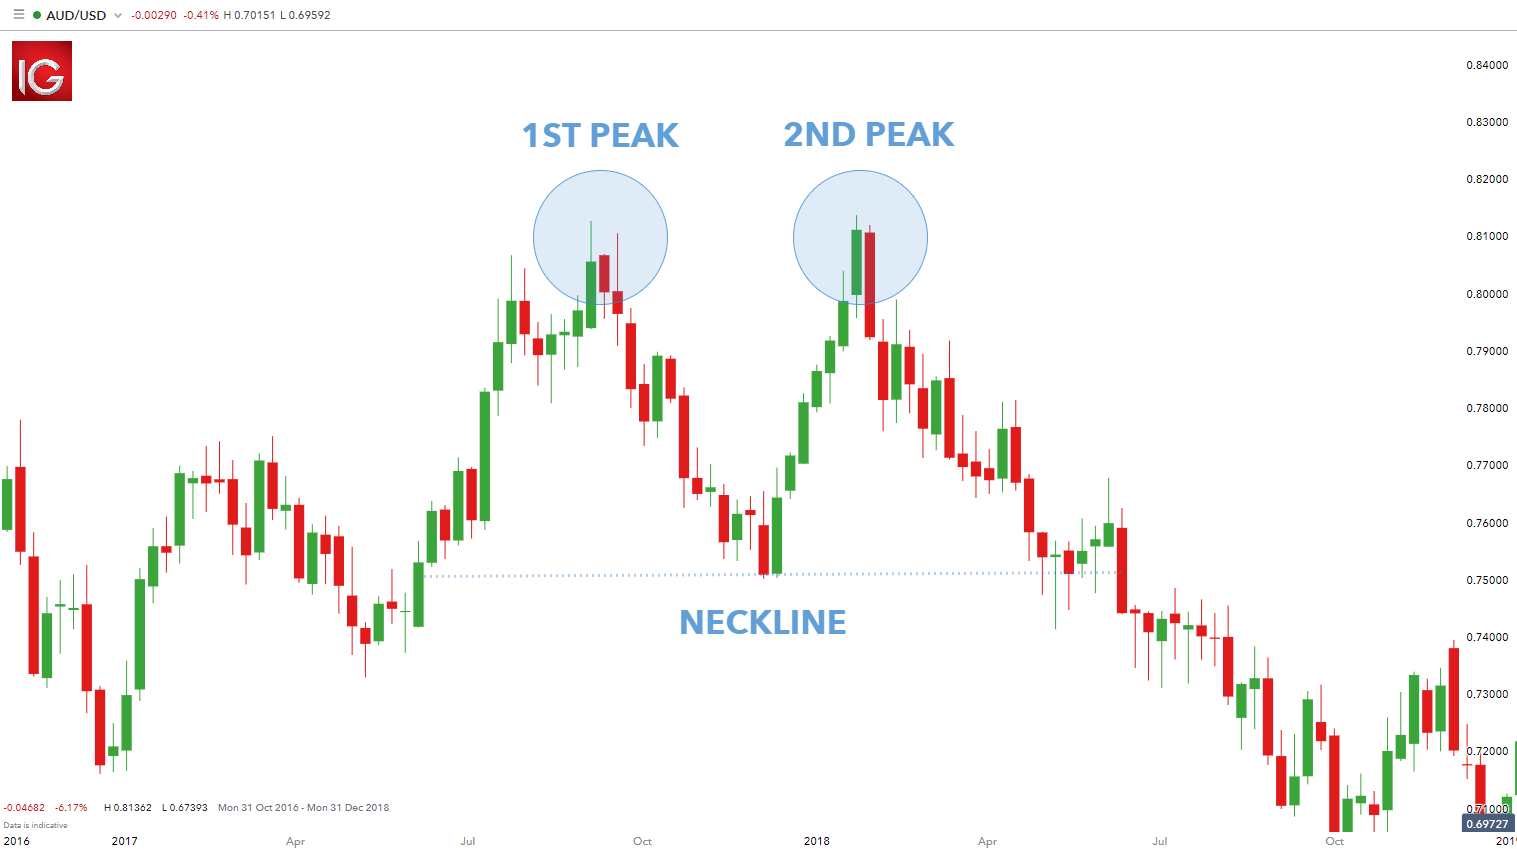
Double bottom chart pattern:

No announcement yet.
`
X
  • وقت
  • دکھائیں
Clear All
new posts
  • #1 Collapse

    Double bottom chart pattern:
    Hello traders hope you all are doing good.jesa k ap janty hain hm k hum ny pichli posts main chart patterns ki series start ki thinor us main aj agy barhty hovy hum 1 chart pattern discuss karny ja rhy hain.
    agr abhi tk ap ny meri baki posts ni dekhi to ap delh skty hain meri profile main jis mn hm ny forex basics se start kia tha.

    Double bottom chart pattern:

    Dear members double bottom chart oattern 1 technical pattern ha jo trend or momentum k reversal ko describe karta ha.Es main market 1 W shape bnati ha.
    phly market opr jaty hovy nechy girtinha or 1 support se tkra k phr oper jati ha or phly waly high se nechy hi reverse ho k support ko dobara retest karti ha or usi support se opr ki trf nklti ha or phly waly dono high break kr deti ha.
    Double bottom short term main downward trend show karta ha laikin ye infact upward trend ki indicatioj hota ha.
    1st bottom jb bnt ha to ususally 20,30% retracement py bnta ha jb k 2nd bottom 1st bottom k 3,4% py bn skta ha.

    Click image for larger version

Name:	FF7C5EA3-B858-4DA7-81D2-007E23BCAF0B.png
Views:	10
Size:	11.1 کلوبائٹ
ID:	12539719

    How to trade double bottom?
    Double bottom py trade leny k lye apko neckline k break out ka wait karna chahye.
    Jo 1st high hota ha market ka jahan se nechy aa k wo 1st bottom bnati ha us 1st high k sth jb dosra us k equal high bnta ha to usko neckline kaha jata ha.
    jb market neckline yeni previous high ko break kary to apko break out ki confirmation oy trade leni ha or apka stop loss neckline ya us se thora nechy ho ga or apka target (W) ki height k equal ho ga.
    Click image for larger version

Name:	59AEBF85-768F-4100-AAE2-810443EC95BC.png
Views:	4
Size:	22.3 کلوبائٹ
ID:	12539720

    Confirmation of breakout:

    Kisi bhi chart pattern including double bottom chart oattern main trade leny k lye breakout ka wait karen or breakout ki 2 confirmations hoti hain.
    1) breakout ki phli confirmation ye hoti ha k market km se km hourly candle apni resistance se opr close kry
    2) dosri breakout ki confirmation ye hoti ha k market opr closing deny or thora sa opr jany k bad 1 bar apni resistance ko retest kary.
    or apko esi retest py hi trade leni chahye.

  • <a href="https://www.instaforex.org/ru/?x=ruforum">InstaForex</a>
  • #2 Collapse

    Re: Double bottom chart pattern:

    Click image for larger version

Name:	download (1).png
Views:	5
Size:	8.0 کلوبائٹ
ID:	12403625
    Double Bottom Candlestick Pattern ko samajny ky liye ap ko iss bat par focus karna ho ga ky market mn 1 time par 2 same lowest points hoty hain. Jin ko market touch kar ky wapis aapis aati hai. Market ki iss position ko Double Bottom Candlestick Pattern kehty hain.

    Importance of Chart Patterns:
    Forex Trading man traders currency pairs aur commodities ki price movements ko smajhna k liye price chart read kerta han Price Chart price k trend, momentum aur patterns man changes ko accurately identify kerta ha Chart Patterns price chart man price ki movement ko track kerna k liye use hona wala most important technical tool ha Traders Currency Pairs aur Commodities ko Buy/Sell k liye in chart pattern pr depend kerta han. Aik double neechay patteren wahan ke sab se mazboot ulat patteren mein se aik hai. chunkay yeh do bottlon par mushtamil hai, is liye yeh bohat aam namona nahi hai. phir bhi, aik baar shanakht honay ke baad, patteren rujhan ki simt mein tabdeeli ki pishin goi karne mein bohat muaser hai
    Click image for larger version

Name:	download.png
Views:	34
Size:	4.3 کلوبائٹ
ID:	12403626
    Double Bottom Chart Pattern ki Pehchan
    Double bottom pattern bullish se reversal ka patteren hai jo neechay ke trend ke bottom k leye hota hai aur is baat ka ishara deta hai ke baichnay walay, jo ab tak qeemat ke action ke control mein thay, raftaar kho rahay hain. do chone walay kam aur rujhan ki simt mein neechay ke rujhan se oopar ke rujhan mein tabdeeli ki wajah se patteren harf"w" se mushabihat rakhta hai. Yeh dekhte hue ke ain aik hi qeemat par do bottoms haasil karna taqreeban namumkin hai, jab tak ke yeh dono neechay aik jaisi qeemat par hon, usay patteren ki taoseeq ke liye kaafi samjha jata hai.
    Click image for larger version

Name:	download.jpg
Views:	2
Size:	9.1 کلوبائٹ
ID:	12403627
    • #3 Collapse

      Re: Double bottom chart pattern:

      INTRODUCTION OF DOUBLE CHART PATTRAN
      Double candle stick pattern ko identify karna bahut hi aasan hota hai kyunki Jab aap market mein ek aisa level find out kar lete hain jismein market mein low level per prices chal rahi hoti hain aur Market use area ko touch karke rebound Kar jaati hai aur uske bad aapko kuchh time period ke bad sem usi level per market mein kuchh aisa pattern milta hai jismein aapko yah idea Mil jata hai ki market yahan se reversal print banaa Rahi hai to aisi condition mein aap market mein entry Le sakte hain aur ismein aapko bahut jyada fayda mil sakta hai agar aap market mein jyada se jyada advantages hasil karna chahte hain to ismein aapko hamesha different candlesticks pattern ko find out karna hota hai.

      EXPLANATION
      orex Trading man traders currency pairs aur commodities ki price movements ko smajhna k liye price chart read kerta han Price Chart price k trend, momentum aur patterns man changes ko accurately identify kerta ha Chart Patterns price chart man price ki movement ko track kerna k liye use hona wala most important technical tool ha Traders Currency Pairs aur Commodities ko Buy/Sell k liye in chart pattern pr depend kerta han. Aik double neechay patteren wahan ke sab se mazboot ulat patteren mein se aik hai. chunkay yeh do bottlon par mushtamil haiMarket mein Jab aap iski proper recognition kar lete hain to aisi condition mein aapko hamesha confirmation per trade Lena hoti hai Jab aap market mein lower level per bullish trend mein Koi candle stick pattern observe karte hain to ismein aapko bahut achcha candlest pattern mil sakta hai aur aap usko market mein jyada se jyada advantages hasil karne ke liye isko utilised kar sakte hain aur ismein aapko bahut jyada fayda mil sakta hai market mein jyada se jyada advantages hasil karne ke liye aapko hamesha ismein carefully focus karna hota hai aur ismein aapko bahut jyada fayda mil sakta hai.


      TREADING KRNY KA TRIKA
      aapko hamesha confirmation per trade Lena hoti hai Jab aap market mein lower level per bullish trend mein Koi candle stick pattern observe karte hain to ismein aapko bahut achcha candlest pattern mil sakta hai aur aap usko market mein jyada se jyada advantages hasil karne ke liye isko utilised kar sakte hain aur ismein aapko bahut jyada fayda mil sakta hai market mein jyada se jyada advantages hasil karne ke liye aapko hamesha ismein carefully focus karna hota haibove mentioned information ki base per aap market mein double bottom candlestick pattern ko easily identify kar sakte hain aur is per market mein according tu rules and regulation trading interpretation kar sakte hain lekin isko further explain karne ke liye main aapko iska chart share karne ja raha hun jo aapko helping platform provide karega aur aap iski easier identification karne ke bad iski interpretation ko aasani ke sath samajh sakte hain Jab aap iski interpretation aur identification kar lete hain to aap ismein different important factors ko find out kar sakte hain.

      ACCORDING TO TOP DOUBLE PATTRAN

      • <a href="https://www.instaforex.org/ru/?x=ruforum">InstaForex</a>
      • #4 Collapse

        Re: Double bottom chart pattern:

        Assalam Alaikum dear friends jasa k aap sab ko is bat kapta hy k forex trading ak bohot risky business hai. Or is main profit k sath sath hamen loss bi kafi hota hai. Isi leye jb tk hamen forex market ka knowledge or is kaexperience na ho to is main hamen trading nahe krni chaey. Aj ka hmara topic bht acha sbit hony wala hay. Jis ko hm deeply discuss kren gy. Double bottom Candlestick ki complete guide line ap ko btaun gi.


        Define Double Bottom Candlestick Pattern:

        Forex trading main double candle stick pattern aik esa candle streak pattern hota hey. Aur ju hmein market main support level par mojod hota hay. Aur jb market main prices bottom level ko chuti karti hay. Or es key bd apni harkat market karty hwi phr sim ose level ko retest karti hay. Aur osy see halat ko hm market main double bottom candle stick pattern ki recognition key leay malom kar sakte hain. Es ko hm double bottom chart candlestick pattern khty hain.
        Click image for larger version

Name:	hSAjXb8D_mid.png
Views:	3
Size:	68.1 کلوبائٹ
ID:	12403744

        Tread with Double Bottom Chart pattern:

        Dear members market main hm mukamal recognition kar lety hain. Aur es halat main hmein hameesha confirmation par trade lena hoti hay. Aur hm market main lower level par bullish trend main koi candle stick pattern observe kartey hain . Aur es main hm bahout acha candlestick pattern mil sakta hay. Or hm os koo market main n zada see zada faida hasil karne key leay es ko utilize kar saktey hain. Or hmein bht faida mil sakta hay. Aur market main zada faida hasil karne . key leay hmein hameesha es main ehtyat sy karna hota hay. Hmein bahout zada profit mil sakta hay. Aur es tarriky sy hm best treading kr skty hain.

        Click image for larger version

Name:	double-bottom-pattern_body_doublebottom.png.full.png
Views:	25
Size:	10.1 کلوبائٹ
ID:	12403745

        Expalination:

        Forex market main double bottom candlestick pattern ko asani sy malom kar saktey hain . Or es par market main according to haqaiq trading interpretation kr saktey hain. Hmein es ki interpretation or malomat kar lety hain.Aur to Aur hm Mukhtlif eham factors ko maloom kar saktey hain.aur achy sy kamyab ho skty hain forex mein kamyab ka Raz best knowledge Aur experience hay. Jitna zada AP k pas ho ga . Utna ao achy sy Aur asani sy profitable treading kr skein hain.
        Click image for larger version

Name:	double-bottom-pattern-target.png
Views:	1
Size:	24.4 کلوبائٹ
ID:	12403746

        Identification of Double Bottom Chart pattern:

        Forex market main double candle stick pattern ko maloom karny k bht hi easy hota hay. kyun key jb hm market main aek esa level malomat kar lety hain. Aur jis mein market main low level par prices chal rahi hoti hain . Or market os area ko touch kar key re bound Kar jati hay. Aur os key bd hmein thory time period key bd sim osi level par market main koch esa pattern milta hay. Os sy hmein yeah andaza ho jata hay. Key ki market yahan see reversal print bana rhi hay. Tu esy halat n main hm market main entry ly sakte hain . Or es main hm profit hasil kr sakty hay. Aur agar hm market main zada dvantages hasil karna chaheay hain . Tu hm hameesha muhtalif candlesticks pattern ko malom karna hota hay. Es trha sy hm achy sy candle ki pechan krty hain. Aur best point pr tread lety hain
        Click image for larger version

Name:	double-bottom.png
Views:	9
Size:	33.5 کلوبائٹ
ID:	12403748
        Last edited by ; 22-06-2022, 07:33 PM.

        اب آن لائن

        Working...
        X