Aslam u Alaikum!
Dear members i hope ap sab kehriyat sy hon gay, or market main achi earning kar rhy hon gy. Dear agr ap market main kamyabi Hasil karna chahty hain to aapko Hamesha experience k satg kam karna hota hai aur apni learning ko perfect banana hota hai. Tab hi ap kamyabi hasil kar sakte hain.Forex trading mein agar aap successful trading karna chahte hain. To ap ko different factor par study karty hain to ap ko bhot zyda advantages available hoty hain. Ye market ki volatility ki study kay ly use ky jata hy Jb certian point sy above or below move karta hy or es ka ye matlab hota kay market ka trend change hony wala hy . Bhot sary technical tool ki tarha ye daily chart kay laye banaya giya hai. Lkn trader esko kisi bhe time frame mein use kar sakty hain Aaj aaj ki post ke Ek technical post hai aur aapko bahut pasand I Hogi aur bhi improve mint kar rahi ho gai isliye aap koshish karen* knowledge experience information saath saath Hasil Karte. forex ma bhot sari techniques or methods k zaryae trade open ki jati hai jis ka main maqsad ye hota hai k trader ko benefit hasil ho jae. Jis trader k pass acha capital or acha knowledge ho ga wo acha profit hasil karny ma kamyab ho jae ga. Jis trader k pass kio technique or acha capital ni hota wo profit hasil karny ma hamesa nakam ho jata hai. So es topic ma ham yaha par discuss karyn gy.
WHAT IS COUNTERATTACK LINE CANDLESTICK PATTERN
Dear members counter attack line candles pattern hmain current trend k reversal ka signal daita ha, ye bullish aur bearish dono ho saktay hain jo is baat par depend karta ha k ye kis tarah k trend ma appear ho raha ha, ye do candles sa mil kar bnta ha jo color aur direction ma aik dusray k opposite hoti hain, is ma trend ki direction ko confirm karnay k liay hmain 3rd ya 4th candle par depend karna parta ha, ye pattern show karta ha k uptrend ma buyers control loose kar rahay hain aur downtrend ma sellers control loose kar rahay hain, ye aik specific pattern ha jo candles chart par ziada nhi milta, traders ko successful trade k liay is pattern ko dusray technical anaylisis k sath use karna chaiay.
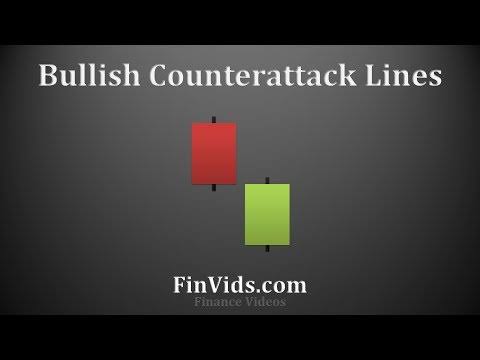
BULLISH COUNTERATTACK LINE :
Dear member Bullish counterattack piercing line k similar ha, dono ma difference first candle k penetration level ka ha, ye pattern downtrend ma appear hota ha, is ma 2 candles hoti hain jin ma sa first long aur black yani bearish hoti ha auf second candle white mtlb bullish hoti ha in doni candles ki real body aur length takreeban aik jaisi hoti ha, trend ko confirm karnay k liay confirmation candle ki zarurat hoti ha, jis k baad buy ya sell ki trade set ki ja sakti hai.
BEARISH COUNTERATTACK LINE :
Dear member Bearish counter attack candle pattern dark cloud cover pattern pattern k similar ha, ye uptrend ma appear hota ha, jis ma pehli candle long aur white matlb bullish hoti ha aur second candle black mtlb bearish hoti ha, jiska close first candle k same level par hota ha, is pattern ma b dono candles ki real body same hoti ha aur confirmation candle ki zarurat hoti ha.
WORKING STRATEGY :
Dear member Is pattern ma pehle candle bearish banti hai or second candlestick bullish banti hai. Ye second candlestick market ma down gap sy open hoti hai or phr ye usi point k kareeb close hoti hai jaha par previous candle close hoe thi. Pattern ma jo bullish candle banti hai wo pehle candle ki nisbat large body ki hoti hai. Ye long bullish candle darsal market k reverse hony ko zahir karti hai k market pehle bearish trend ma thi or ab bullish ma ah chuki hai. Es pattern k bad agr trader ko bull ki trade open karni hain to unko chahe k wo stop loss second candle k bottom par set karyn. is ka benefit ye ho ga k wo big loss sy bach jayn gy. Ye bhot important hai k both candles large hon or dono ka closing point b approx same he ho. Agr second candle bullish ni ho gi or market k gap ko fill ni kary gi to ye pattern invalid samaja jae ga.
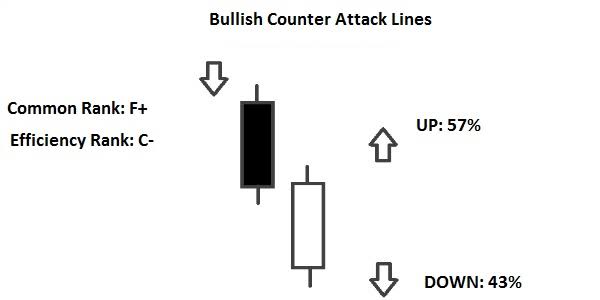
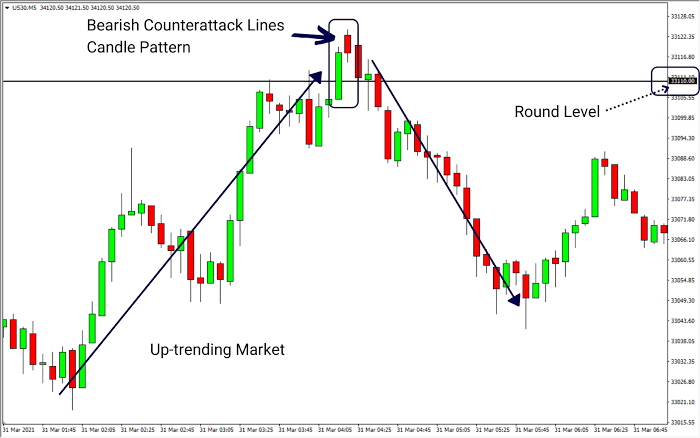
CHART IN ANALYSIS FOREX TRADING :
Dear member market main kamyabi Hasil karna chahte hain to ismein aapko bahut zayda experience ki zarorat hoti hai agr ap different factors par study karty hain to ap bhot zyada advantages available hoty hain es liye ap ko hmesa market Mein candlestick ko achi tarah understand karna chahie ta k ap market main achi earning karain agr apny analysis kar k apni trading ko successful bana sakhty hain . Fundamental aap Kay sath bullish Belt Hold Candlestick Pattern ki further clarification krny Kay liye following Trading outline aap Kay sath share krny ja Raha hun. Ya graph aap Kay liye zyda assisting stage with giving kar sakhta hai. Iski help sa aap is candle design ko previously mentioned subtleties ki ba aik sat tradin ho jay gi.aor jab bhe selling pressure ko bhi dekha rahi hoti hai. Jitni ziada sellers market me active hongey, us hisab se candle ki length nechay ki taraf ziada hogi. Chonkeh candle ki up aur down side pe koi shadow ya wick nahi hoti hai, is waja se market me qeematon ka incrase ho gi.Dear agar aap market geometry to properly study karna chahte hain to is mein aapko market ki different waves ko bhi study karna hota hai isi mein aapke liye bahut hi important theory Jisko aap Elliott Wave kay Naam Se Jante hain is mein aapko bahut jyada perfect analysis karne ke liye ek acchi opportunity aur chance mil sakta hai is mein aapko market ki prediction karne ke liye bahut hi best anus is complete karna Hote Hain.
Dear members i hope ap sab kehriyat sy hon gay, or market main achi earning kar rhy hon gy. Dear agr ap market main kamyabi Hasil karna chahty hain to aapko Hamesha experience k satg kam karna hota hai aur apni learning ko perfect banana hota hai. Tab hi ap kamyabi hasil kar sakte hain.Forex trading mein agar aap successful trading karna chahte hain. To ap ko different factor par study karty hain to ap ko bhot zyda advantages available hoty hain. Ye market ki volatility ki study kay ly use ky jata hy Jb certian point sy above or below move karta hy or es ka ye matlab hota kay market ka trend change hony wala hy . Bhot sary technical tool ki tarha ye daily chart kay laye banaya giya hai. Lkn trader esko kisi bhe time frame mein use kar sakty hain Aaj aaj ki post ke Ek technical post hai aur aapko bahut pasand I Hogi aur bhi improve mint kar rahi ho gai isliye aap koshish karen* knowledge experience information saath saath Hasil Karte. forex ma bhot sari techniques or methods k zaryae trade open ki jati hai jis ka main maqsad ye hota hai k trader ko benefit hasil ho jae. Jis trader k pass acha capital or acha knowledge ho ga wo acha profit hasil karny ma kamyab ho jae ga. Jis trader k pass kio technique or acha capital ni hota wo profit hasil karny ma hamesa nakam ho jata hai. So es topic ma ham yaha par discuss karyn gy.
WHAT IS COUNTERATTACK LINE CANDLESTICK PATTERN
Dear members counter attack line candles pattern hmain current trend k reversal ka signal daita ha, ye bullish aur bearish dono ho saktay hain jo is baat par depend karta ha k ye kis tarah k trend ma appear ho raha ha, ye do candles sa mil kar bnta ha jo color aur direction ma aik dusray k opposite hoti hain, is ma trend ki direction ko confirm karnay k liay hmain 3rd ya 4th candle par depend karna parta ha, ye pattern show karta ha k uptrend ma buyers control loose kar rahay hain aur downtrend ma sellers control loose kar rahay hain, ye aik specific pattern ha jo candles chart par ziada nhi milta, traders ko successful trade k liay is pattern ko dusray technical anaylisis k sath use karna chaiay.
BULLISH COUNTERATTACK LINE :
Dear member Bullish counterattack piercing line k similar ha, dono ma difference first candle k penetration level ka ha, ye pattern downtrend ma appear hota ha, is ma 2 candles hoti hain jin ma sa first long aur black yani bearish hoti ha auf second candle white mtlb bullish hoti ha in doni candles ki real body aur length takreeban aik jaisi hoti ha, trend ko confirm karnay k liay confirmation candle ki zarurat hoti ha, jis k baad buy ya sell ki trade set ki ja sakti hai.
BEARISH COUNTERATTACK LINE :
Dear member Bearish counter attack candle pattern dark cloud cover pattern pattern k similar ha, ye uptrend ma appear hota ha, jis ma pehli candle long aur white matlb bullish hoti ha aur second candle black mtlb bearish hoti ha, jiska close first candle k same level par hota ha, is pattern ma b dono candles ki real body same hoti ha aur confirmation candle ki zarurat hoti ha.
WORKING STRATEGY :
Dear member Is pattern ma pehle candle bearish banti hai or second candlestick bullish banti hai. Ye second candlestick market ma down gap sy open hoti hai or phr ye usi point k kareeb close hoti hai jaha par previous candle close hoe thi. Pattern ma jo bullish candle banti hai wo pehle candle ki nisbat large body ki hoti hai. Ye long bullish candle darsal market k reverse hony ko zahir karti hai k market pehle bearish trend ma thi or ab bullish ma ah chuki hai. Es pattern k bad agr trader ko bull ki trade open karni hain to unko chahe k wo stop loss second candle k bottom par set karyn. is ka benefit ye ho ga k wo big loss sy bach jayn gy. Ye bhot important hai k both candles large hon or dono ka closing point b approx same he ho. Agr second candle bullish ni ho gi or market k gap ko fill ni kary gi to ye pattern invalid samaja jae ga.
CHART IN ANALYSIS FOREX TRADING :
Dear member market main kamyabi Hasil karna chahte hain to ismein aapko bahut zayda experience ki zarorat hoti hai agr ap different factors par study karty hain to ap bhot zyada advantages available hoty hain es liye ap ko hmesa market Mein candlestick ko achi tarah understand karna chahie ta k ap market main achi earning karain agr apny analysis kar k apni trading ko successful bana sakhty hain . Fundamental aap Kay sath bullish Belt Hold Candlestick Pattern ki further clarification krny Kay liye following Trading outline aap Kay sath share krny ja Raha hun. Ya graph aap Kay liye zyda assisting stage with giving kar sakhta hai. Iski help sa aap is candle design ko previously mentioned subtleties ki ba aik sat tradin ho jay gi.aor jab bhe selling pressure ko bhi dekha rahi hoti hai. Jitni ziada sellers market me active hongey, us hisab se candle ki length nechay ki taraf ziada hogi. Chonkeh candle ki up aur down side pe koi shadow ya wick nahi hoti hai, is waja se market me qeematon ka incrase ho gi.Dear agar aap market geometry to properly study karna chahte hain to is mein aapko market ki different waves ko bhi study karna hota hai isi mein aapke liye bahut hi important theory Jisko aap Elliott Wave kay Naam Se Jante hain is mein aapko bahut jyada perfect analysis karne ke liye ek acchi opportunity aur chance mil sakta hai is mein aapko market ki prediction karne ke liye bahut hi best anus is complete karna Hote Hain.
تبصرہ
Расширенный режим Обычный режим