Pipe Top Pipe Bottom Candlestick Pattern Me kya Han ?
Dear members ye aik double candlestick pattern hota ha.ye pattern hr time frame k liye useful ha lekin ye long time frame main acha perform karta ha.ye pattern reversal pattern hota ha jo k trend change hony ki nishani hoti ha.esko pipe ka nam es lye dia gia ha k es main 2 candles aik sth bnti hn or pipe ki shakal ke dekhti hain.
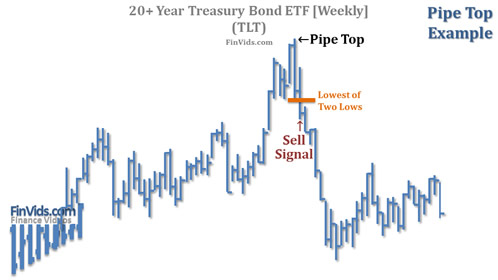
pipe top pattern bullish trend k end main bnta ha or ye trend reversal ki indication hota ha
pipe bottom pattern bearish trend k end main bnta ha or ye trend reversal ki indication hota ha.es main bhi 2 candles aik sth banti hain or pipe ki shakal ke dekhti hain.
Is Pattern Ki Sinkat ?
Dear members pipe top or pipe bottom ki confirmation k lye nechy dye gye components lazmi hai.
Spikes:
Spike ka mtlb hota bahut lambi price movement jo k previous movement se zada ho or es main lambi candles banti ha. Ye 2 candles hoti hain jo k opposite direction main banti hai 1 sell ki or 1 buy ki.overlaps:
2 spike candles jab banti hai to wo apni body ka zada tr hissa share krti hain mtlb k 70% dobo ki height matching hoti ha. Ye lazmi ni hota k high se le kr low to match hn. Es body matching ko overlap kaha jata ha.
Volume:
ye es pattern ki validity ka important factor ha. Average se zyada market volume involve hona chahiye in spikes k banny main.

Dear members ye aik double candlestick pattern hota ha.ye pattern hr time frame k liye useful ha lekin ye long time frame main acha perform karta ha.ye pattern reversal pattern hota ha jo k trend change hony ki nishani hoti ha.esko pipe ka nam es lye dia gia ha k es main 2 candles aik sth bnti hn or pipe ki shakal ke dekhti hain.
pipe top pattern bullish trend k end main bnta ha or ye trend reversal ki indication hota ha
pipe bottom pattern bearish trend k end main bnta ha or ye trend reversal ki indication hota ha.es main bhi 2 candles aik sth banti hain or pipe ki shakal ke dekhti hain.
Is Pattern Ki Sinkat ?
Dear members pipe top or pipe bottom ki confirmation k lye nechy dye gye components lazmi hai.
Spikes:
Spike ka mtlb hota bahut lambi price movement jo k previous movement se zada ho or es main lambi candles banti ha. Ye 2 candles hoti hain jo k opposite direction main banti hai 1 sell ki or 1 buy ki.overlaps:
2 spike candles jab banti hai to wo apni body ka zada tr hissa share krti hain mtlb k 70% dobo ki height matching hoti ha. Ye lazmi ni hota k high se le kr low to match hn. Es body matching ko overlap kaha jata ha.
Volume:
ye es pattern ki validity ka important factor ha. Average se zyada market volume involve hona chahiye in spikes k banny main.
تبصرہ
Расширенный режим Обычный режим