Bullish Rectangular

No announcement yet.
`
X
  • وقت
  • دکھائیں
Clear All
new posts
  • #1 Collapse

    Bullish Rectangular
    Bullish Rectangles

    Bullish rectangles key mutabiq trades ko open karny key ley traders ko resistance level ko key level samjna ho ga aur esi key level/resistance level par agar market ki movement ki measurement ki jaye to market agar bullish trend key bad some time tak resistance level par stay kary aur sideways trend key sath na to zeyda up move kary aur na hi zeyda down move to ye market ka bullish rectangles ho sakta hay es key bad market strong bullish move per se kar sakti hay, es satiation me market ki moving average zaror calculate karni chahiye.

    Click image for larger version

Name:	grade7-bullish-rectangle-before.png
Views:	8
Size:	6.6 کلوبائٹ
ID:	12532640

    Forex market main different kisam pattern banty rehty hay aur en patterns pka market main bohat acha result hota hay aur en say humay pata chalta hay keh en main kaisy entry lay sakty hay aur kaisy hum es say exit ho sakty hay es liye humay chahiye keh eskay bary main bhi apny knowledge ko enhance karen kyun keh agar hum esko bhi use karen gay to acha profit bna sakty hay es pattern main market ka chance hota hay keh aik trend line ko brake kar kay upward move kary aur agar hum upward move ko follow karty huay esmain trade place karen gay to market main us trade say acha profit hasil kea ja sakta hay aur esmain humay aik target bohat acha achive ho jata hay es business main humay har chance ko avail karna chahiye esi main humara faida hota ha.

    Click image for larger version

Name:	IFCM_patterns_rectangle_bullish.png
Views:	4
Size:	5.7 کلوبائٹ
ID:	12532641

    Market ki swing movement ko profitable banany key ley bullish ya bearish rectangles ko samjna bahot zarori hay, market kabi support level ko aur kabi resistance level tak ja ponchti hay ye level kab break hoty hey es key ley bullish and bearish rectangles traders key ley helpful ho sakty hey,
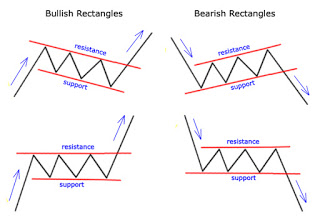
    bullish rectangles ki agar bat ki jaye to bullish ki major trend agar support level ko beak na kary to ye major trend continue rak sakti hay aur 3 time support level ko touch kar key ye trend again strong resistance level ko break kar sakti hay, esi tarha bearish rectangles be agar strong resistance level ko break nahi karti aur down to up aur per se up to down move karti hay to strong se strong support level break ho sakta hay.
    Last edited by ; 29-05-2022, 11:31 PM.
  • <a href="https://www.instaforex.org/ru/?x=ruforum">InstaForex</a>
  • #2 Collapse

    ### Bullish Rectangular Pattern: Kya Hai Aur Kaise Trade Karein?
    Bullish Rectangular pattern ek technical analysis pattern hai jo forex aur stock trading mein bullish trends ko identify karne ke liye use hota hai. Yeh pattern market mein consolidation aur breakout ke potential opportunities ko signal karta hai. Aaj hum discuss karenge ke Bullish Rectangular pattern kya hota hai, iski pehchan kaise ki jati hai, aur isse trade karne ke strategies kya hain.

    **1. Bullish Rectangular Pattern Kya Hai?**

    - **Definition:** Bullish Rectangular pattern ek continuation pattern hai jo generally downtrend ke baad develop hota hai. Is pattern mein price ek rectangular range mein consolidate karti hai, aur phir upward breakout ke through bullish trend ko signal karti hai. Yeh pattern market ki temporary consolidation aur phir upward momentum ko dikhata hai.
    - **Formation:** Pattern ki formation ke liye, price pehle ek downtrend ko experience karti hai, phir consolidate hoti hai aur ek rectangular shape banaati hai. Is pattern ke baad, price typically upward breakout karti hai jo bullish trend ko confirm karta hai.

    **2. Pattern Ki Pehchan Aur Interpretation:**

    - **Pehchan:** Bullish Rectangular pattern ko identify karne ke liye, price chart par ek rectangular consolidation range ko dekhna hota hai. Yeh range support aur resistance levels ke beech hoti hai aur market ki temporary stability ko show karti hai.
    - **Interpretation:** Pattern ke baad upward breakout market ke bullish trend ko signal karta hai. Jab price rectangular range ko upper side se break karti hai aur volume bhi increase hota hai, to yeh bullish confirmation hota hai.

    **3. Trading Strategy Aur Entry Points:**

    - **Entry Points:** Bullish Rectangular pattern ke confirm hone ke baad trade entry point ko rectangular range ke upper boundary ke upar set kiya jata hai. Yeh upward breakout ke signal ko capture karne ke liye hota hai.
    - **Stop-Loss Placement:** Risk management ke liye, stop-loss orders ko pattern ke lower boundary ke neeche place kiya jata hai. Yeh sudden market reversals aur potential losses se protection provide karta hai.
    - **Take-Profit Targets:** Take-profit targets ko previous resistance levels ya risk-reward ratio ke basis par set kiya jata hai. Yeh profit-taking aur trade management ko optimize karta hai.

    **4. Pattern Ki Limitations:**

    - **False Breakouts:** Bullish Rectangular pattern kabhi kabhi false breakouts bhi generate kar sakta hai, khas taur par jab market volatility high ho. Isliye, additional confirmation indicators aur volume analysis ka use karna zaroori hai.
    - **Market Conditions:** Pattern ko trading strategy ke sath combine karte waqt market conditions aur overall market sentiment ko bhi consider karna zaroori hai. Fundamental factors aur news events ko evaluate karke trading decisions ko refine kiya ja sakta hai.

    **5. Additional Indicators Aur Tools:**

    - **Volume Analysis:** Volume ko analyze karna zaroori hai. Bullish Rectangular pattern ke sath high volume dekhne se pattern ki authenticity aur bullish trend ka signal strong hota hai.
    - **Technical Indicators:** Moving averages, RSI (Relative Strength Index), aur MACD (Moving Average Convergence Divergence) jese indicators ko use karke pattern ke signals ko confirm kiya ja sakta hai. Yeh indicators market momentum aur trend strength ko analyze karne mein madad karte hain.

    **6. Conclusion:**

    Bullish Rectangular pattern ek valuable tool hai jo market consolidation aur potential bullish breakout ko identify karne mein madad karta hai. Accurate pattern identification, effective risk management, aur additional confirmation signals ke zariye traders market ke upward movement ko capture kar sakte hain aur profitable trades execute kar sakte hain. Trading decisions ko pattern ke sath combine karke aur market conditions ko consider karke aap trading performance ko enhance kar sakte hain aur successful outcomes achieve kar sakte hain.
    • <a href="https://www.instaforex.org/ru/?x=ruforum">InstaForex</a>
    • #3 Collapse

      Bullish Rectangular Pattern


      Bullish Rectangular Pattern kya hai?

      Bullish Rectangular Pattern ek technical analysis pattern hai jo stock market aur forex trading mein bullish signals indicate karta hai. Yeh pattern tab banta hai jab price ek specific range mein consolidate hoti hai aur phir us range ke upar breakout hota hai. Is pattern ko samajhna aur identify karna trading decisions mein madadgar ho sakta hai.

      Pattern ki Pehchaan

      Bullish Rectangular Pattern ko pehchaanne ke liye, aapko market ki price action ko dekhna hoga. Yeh pattern ek rectangle ki tarah hota hai jisme price upar aur neeche ki taraf ek specific range ke andar move karti hai. Is range ko support aur resistance levels ke zariye identify kiya jata hai. Jab price is rectangular range ke upper boundary ko todti hai, tab yeh bullish signal hota hai.

      Pattern ka Formation
      1. Consolidation Phase: Pattern ka pehla step consolidation phase hota hai. Is phase mein price ek tight range ke andar move karti hai, jahan na to price zyada upar jaati hai aur na hi neeche girti hai. Yeh range resistance aur support levels ke beech hoti hai.
      2. Breakout: Consolidation phase ke baad, jab price range ke upper boundary ko break karti hai, tab yeh bullish breakout signal hota hai. Is breakout ke baad price ke upar jane ki umeed hoti hai aur trader is moment ka fayda uthane ki koshish karte hain.
      3. Volume Analysis: Breakout ke time volume bhi important hota hai. Agar volume breakout ke sath increase hoti hai, toh yeh indicate karta hai ke breakout strong hai aur price higher levels tak reach kar sakti hai.

      Trading Strategy
      1. Entry Point: Bullish Rectangular Pattern ki entry point ko identify karne ke liye, trader ko pattern ke upper boundary ko dekhna hota hai. Jab price is boundary ko break karti hai, tab entry signal milta hai. Entry point ko thoda higher rakha jata hai taake false breakout se bacha ja sake.
      2. Stop-Loss: Trading mein risk management zaroori hota hai. Isliye, stop-loss ko pattern ke lower boundary ke thoda neeche rakha jata hai. Isse agar price pattern ke opposite direction mein move kare, toh loss minimize ho sakta hai.
      3. Target Price: Target price ko calculate karne ke liye, trader ko pattern ki height ko measure karna hota hai. Yeh height pattern ke consolidation phase ke upar add ki jati hai. Isse ek target price milti hai jahan tak price increase ho sakti hai.

      Conclusion

      Bullish Rectangular Pattern ek useful tool hai jo traders ko market ke bullish trends identify karne mein madad karta hai. Is pattern ko samajhna aur accurately identify karna trading success ke liye zaroori hai. Pattern ke formation aur breakout ki timing ko dekh kar, trader apne trades ko plan kar sakte hain aur market ki volatility ka fayda utha sakte hain.

      اب آن لائن

      Working...
      X