Triangle chart pattern
No announcement yet.
X
  • وقت
  • دکھائیں
Clear All
new posts
  • #1 Collapse

    Triangle chart pattern
    Assalam alaikum dear members umeed ha ap sb thk hn gy.Dear members aj hum chart patterns ki list main agy barhty hovy triangle pattern ko discuss karny lagy hain hum dekhen gy k ye pattern kesy bnta ha or eski direction kia hoti ha or esy kesy trade kia jata ha.

    What is triangle pattern?

    Dear members triangel pattern 1 continuation chart pary pattern ha mtlb k price jis direction main move kar ri hoti ha ye us trend ya direction ki continuation ki indication ha.
    Jb price 2 convergin lines k darmiyan estrha highs kr lows bnati ha k highs upper line ko touch karty hain kr lows lower line ko touch karty hain to 1 triangle shape structure bnta ha.
    Commonly triangle pattern ki 3 different types hoti hain jo k hum aj bari bari discuss karen gy.

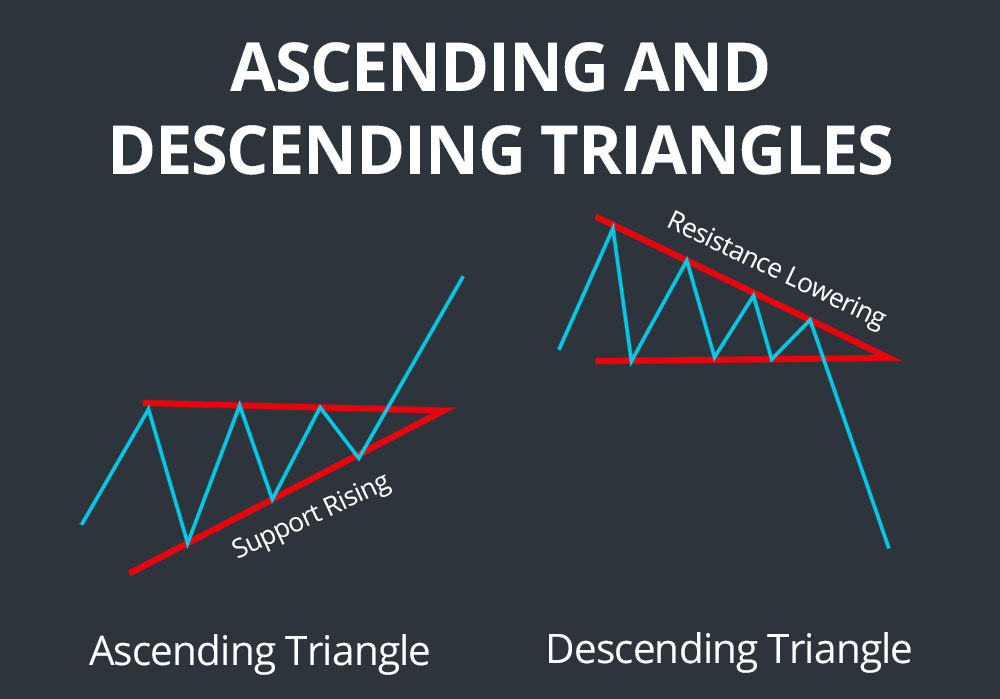
    1) Ascending triangle:

    Ascending triangle 1 breakout pattern hota ha or ye tb bnt ha jb market opr ki trf 1 horizontal trendline se bar bar resist hoti ha estrha es triangel ki oper ki trend line horizontal hoti ha or nechy ki trend line upward direction main hoti ha mtlb k market higher lows bnati ha.q k buyer apni bids barhaty jaty hain jiski waja se higher lows bnty hain or 1 wqt ata ha k buyers momentum pakarty hain or triangle ka breakout hota ha.
    Es pattern main ap triangel ki lower trend line se trade le skty hain or stop loss lower trend line k nechy ho jb k take profit apka triangle ki length k equal ho.
    ya phr ap breakout py bhi trade le skty hain.


    Click image for larger version

Name:	E6CCFF4F-FE03-4A2D-99B0-DAE431B5B320.jpeg
Views:	9
Size:	12.0 کلوبائٹ
ID:	12528198

    2) Descending triangle:

    Decending triangel inverted type ha ascending triangle ki. Es main triangle ki nechy wali trend line horizontal hoti ha jo k support k tor py kaam krti ha jb k oper wali trend line downward sloping hoti ha jiska mtlb ha market lower lows bnati ha or sellers dominate kye hoty hain market ko or at the end market breakdown ho k mazeed nechy jati ha.
    Es main ap breakdown py bhi trade le skty hain ya us se phly triangle ki upper trend line py trade le skty hain or stop loss trend line se thora opr rkh skty hain.

    Click image for larger version

Name:	E1B5ABE4-9A53-464E-A7DB-F66B9218A43E.png
Views:	27
Size:	11.1 کلوبائٹ
ID:	12528199
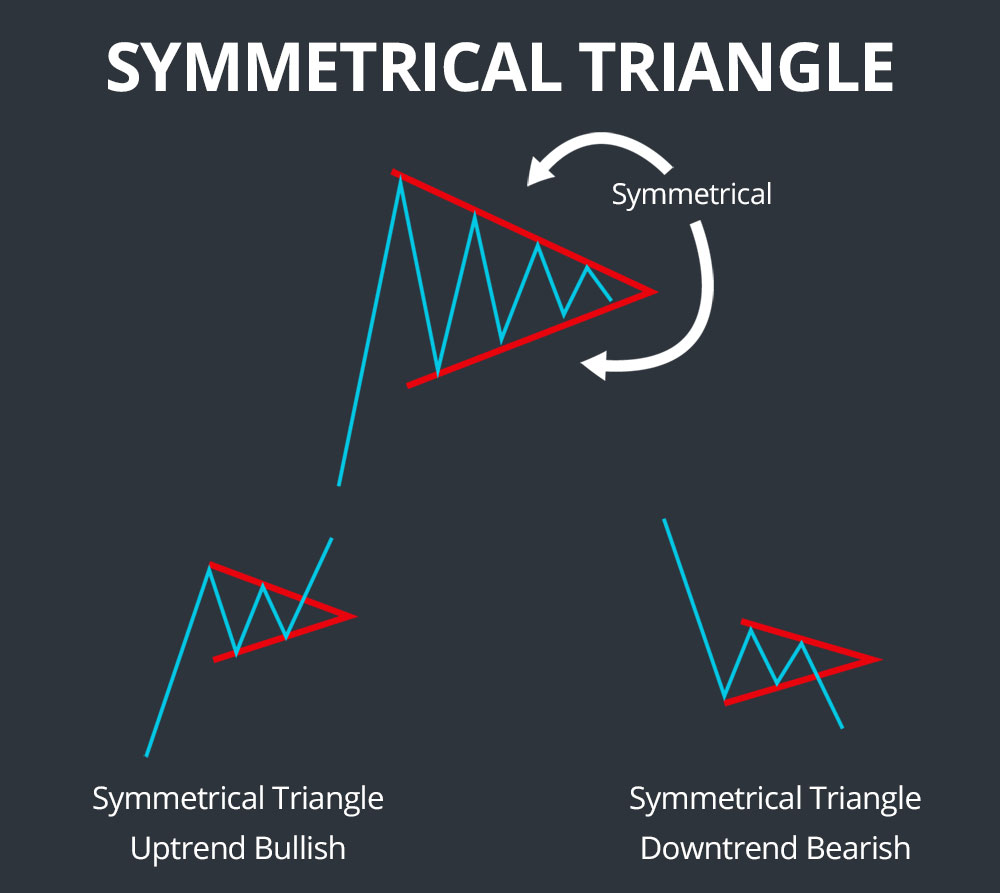
    3) Symmetrical triangle:

    Symmetrical triangle ki upper trend line downward sloping hoti ha or lower trend line upward sloping hoti ha mtlb k market converge hoti jati ha or jesy hi range short hoti ha to market breakout ya bteakdown ho k bullish ya bearish ho jati ha.
    Es main sirf or sirf breakout ya breakdown py hi apko trade karni chahye.

    Click image for larger version

Name:	E3A55E41-4A80-432C-B1EF-1B9D75A950C4.jpeg
Views:	9
Size:	25.7 کلوبائٹ
ID:	12528200
  • <a href="https://www.instaforex.org/ru/?x=ruforum">InstaForex</a>
  • #2 Collapse

    Re: Triangle chart pattern

    The Arrow Triangle chart pattern is a technical analysis pattern that is used to identify potential trend reversals in financial markets. It is a bullish pattern that is formed by a series of lower highs and higher lows, which converge to form a triangle shape.
    The Arrow Triangle pattern is characterized by a series of lower highs and higher lows that form two trendlines that converge towards each other. The pattern is completed when the price breaks out of the triangle formation, typically to the upside, and continues in the direction of the breakout.
    Traders look for the Arrow Triangle pattern as a potential signal that a downtrend may be coming to an end and that a new uptrend may be starting. However, it is important to note that the Arrow Triangle pattern is just one tool in technical analysis and should be used in conjunction with other indicators and analysis when making trading decisions.
    It is also important to note that technical analysis patterns are not always accurate and can sometimes provide false signals. Therefore, traders should always use risk management strategies and have a solid understanding of the markets before making any trading decisions.
    • #3 Collapse

      Re: Triangle chart pattern

      What Is a Triangle?
      A triangle is a chart pattern, depicted by drawing trendlines along a converging price range, that connotes a pause in the prevailing trend. Technical analysts categorize triangles as continuation patterns.
      Understanding Triangle Patterns
      Triangle patterns are aptly named because the upper and lower trendlines ultimately meet at the apex on the right side, forming a corner. Connecting the start of the upper trendline to the beginning of the lower trendline completes the other two corners to create the triangle. The upper trendline is formed by connecting the highs, while the lower trendline is formed by connecting the lows.

      Triangles are similar to wedges and pennants and can be either a continuation pattern, if validated, or a powerful reversal pattern, in the event of failure. There are three potential triangle variations that can develop as price action carves out a holding pattern, namely ascending, descending, and symmetrical triangles. Technicians see a breakout, or a failure, of a triangular pattern, especially on heavy volume, as being potent bullish/bearish signals of a resumption, or reversal, of the prior trend.

      Type of Triangles;
      Ascending Triangle: An ascending triangle is a breakout pattern that forms when the price breaches the upper horizontal trendline with rising volume. It is a bullish formation. The upper trendline must be horizontal, indicating nearly identical highs, which form a resistance level. The lower trendline is rising diagonally, indicating higher lows as buyers patiently step up their bids. Eventually, the buyers lose patience and rush into the security above the resistance price, which triggers more buying as the uptrend resumes. The upper trendline, which was formerly a resistance level, now becomes support.
      Descending Triangle: A descending triangle is an inverted version of the ascending triangle and considered a breakdown pattern. The lower trendline should be horizontal, connecting near identical lows. The upper trendline declines diagonally toward the apex. The breakdown occurs when the price collapses through the lower horizontal trendline support as a downtrend resumes. The lower trendline, which was support, now becomes resistance.
      Symmetrical Triangle: A symmetrical triangle is composed of a diagonal falling upper trendline and a diagonally rising lower trendline. As the price moves toward the apex, it will inevitably breach the upper trendline for a breakout and uptrend on rising prices or breach the lower trendline forming a breakdown and downtrend with falling prices.
      Traders should watch for a volume spike and at least two closes beyond the trendline to confirm the break is valid and not a head fake. Symmetrical triangles tend to be continuation break patterns, meaning that they tend to break in the direction of the initial move before the triangle formed. For example, if an uptrend precedes a symmetrical triangle, traders would expect the price to break to the upside......
      • <a href="https://www.instaforex.org/ru/?x=ruforum">InstaForex</a>
      • #4 Collapse

        جواب: Triangle chart pattern

        A Comprehensive Guide to :Triangle Patterns


        Triangle patterns are a chart pattern commonly identified by traders when a stock price’s trading range narrows following an uptrend or downtrend. Unlike other chart patterns, which signal a clear directionality to the forthcoming price movement, triangle patterns can anticipate either a continuation of the previous trend or a reversal. Although triangles more frequently predict a continuation of the previous trend, it is essential for traders to watch for a breakout of the triangle before acting on this chart pattern.
        Triangle Patterns

        A triangle pattern forms when a stock’s trading range narrows following an uptrend or downtrend, usually indicating a consolidation, accumulation, or distribution before a continuation or reversal.
        Triangle patterns come in three varieties – ascending, descending, and symmetrical – although all three types of triangles are interpreted similarly.
        Ascending and Descending Triangles

        Ascending and descending triangle patterns are right-angle triangles in that the line extending along two or more lows or two or more highs, respectively, is horizontal. Ascending triangles have a rising lower trendline as a result of accumulation and are always considered bullish signals regardless of whether they form after an uptrend or downtrend. Descending triangles have a falling upper trendline as a result of distribution and are always considered bearish signals.

        Symmetrical Triangles

        Symmetrical triangles have descending highs and ascending lows such that both the upper and lower trendlines are angled towards the triangle’s apex. Symmetrical triangles are a sign of consolidation and usually result in a continuation of the prior trend, although they can also indicate reversals.

        Triangle Pattern Timescales

        Triangle patterns are most commonly applied on daily charts and interpreted over a period of several months. For example, strong triangle patterns on daily chart require a prior trend that is at least a few months old and typically develop for several months before a breakout occurs. However, triangle patterns can also be observed and used for trading on shorter timescales, although doing so leaves the drawing of the triangle patterns up to a greater degree of interpretation.

        How to Trade Triangle Patterns

        A symmetrical triangle requires at least four points – two highs, where the second high is lower than the first, and two lows, where the second low is higher than the first. In ascending triangles the highs are the same across the triangle rather than descending, while in descending triangles the lows are the same across the triangle rather than ascending.
        For a triangle to exist, there must be a well-established prior trend: for example, one that is at least a few months old when looking at a daily chart.
        For all three types of triangle patterns, drawing a line from the first high to the second and continuing it while drawing a line from the first low to the second and continuing should form a triangle as the two lines intersect. The triangle pattern identification is more supported as more high and low points are added to the lines. As the stock proceeds further into the triangle pattern over time, volume should also diminish.


        اب آن لائن

        Working...
        X