Assalam alaikum dear members!
umeed karta hun aap sb thk hn gy or pak forex forum se knowledge gain kar rhy hn gy.
dear members aj ki post main hum bearish flag pattern ko detail se study karen gy k ye laisy banta ha or esko kaisy trade kia jay.
What is Bearis Flag Pattern?
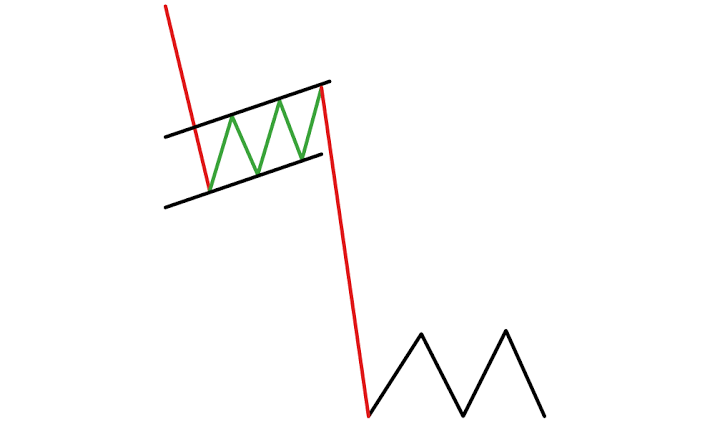
dear members bearish flag pattern bearish trend k darmyan main banta ha or ye aik continuation pattern ha mtlb k ye pattern es bat ki nishani hota ha k abhi bearish trend continue rhy ga market main or price mazeed nechy jaen ge.
es lye es k breakout k bad hum sell ki entries hi lety hain market main.
How its is formed?
Dear members jb market downtrend main nechy jaa rahi hoti ha to seedha seedha nechy ni jati bal k kch nechy jaa k phr retracement lyti ha or opr nechy zig zag kr k nechy jati ha.
aisy hi retracement lety hovy market kch patterns bnati hai jin main se aik bearish flag pattern ha.
Es main market higher highs or higher lows bnati ha.
agr highs ko highs se mlaya jay to aik rising trendline banti ha jo k resisting line hoti ha.
jb k nechy ki trf lows ko lows se mla k aik or rising trendline banti ha jo k supporting trendline hoti ha.
estrha ye 2 trendlines ml k aik flag type pattern bnati hain.
How to trade it?
Dear members es pattern main trade leny k kye hamen pattern k complete hony or phr es k breakout ka wait karna chahye.
breakout us situation ko khty hain jb market flag se bhr nklti ha or eski confirmation ye hoti ha k js time frame main market ye flag bnati ha usi time frame main market flag k bhr closing dy.
breakout ki confirmation k bad hum es main sell ki trade lety hain.
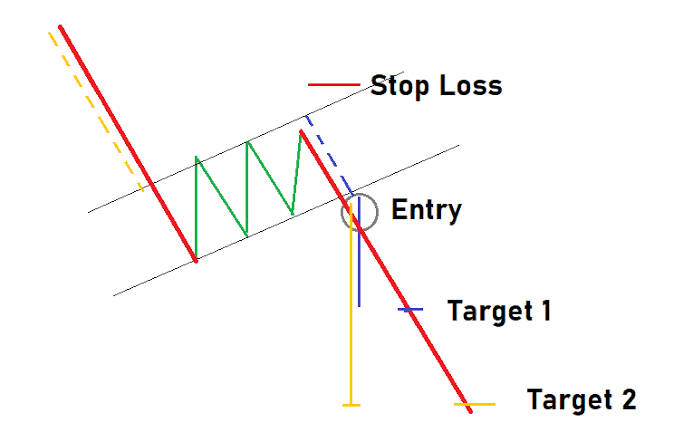
es main hmara stop loss flag ki resisting trendline tk hota ha jb k profit target flah se opr moujoof pole ki height k equal nechy ki trf hota ha.
umeed karta hun aap sb thk hn gy or pak forex forum se knowledge gain kar rhy hn gy.
dear members aj ki post main hum bearish flag pattern ko detail se study karen gy k ye laisy banta ha or esko kaisy trade kia jay.
What is Bearis Flag Pattern?
dear members bearish flag pattern bearish trend k darmyan main banta ha or ye aik continuation pattern ha mtlb k ye pattern es bat ki nishani hota ha k abhi bearish trend continue rhy ga market main or price mazeed nechy jaen ge.
es lye es k breakout k bad hum sell ki entries hi lety hain market main.
How its is formed?
Dear members jb market downtrend main nechy jaa rahi hoti ha to seedha seedha nechy ni jati bal k kch nechy jaa k phr retracement lyti ha or opr nechy zig zag kr k nechy jati ha.
aisy hi retracement lety hovy market kch patterns bnati hai jin main se aik bearish flag pattern ha.
Es main market higher highs or higher lows bnati ha.
agr highs ko highs se mlaya jay to aik rising trendline banti ha jo k resisting line hoti ha.
jb k nechy ki trf lows ko lows se mla k aik or rising trendline banti ha jo k supporting trendline hoti ha.
estrha ye 2 trendlines ml k aik flag type pattern bnati hain.
How to trade it?
Dear members es pattern main trade leny k kye hamen pattern k complete hony or phr es k breakout ka wait karna chahye.
breakout us situation ko khty hain jb market flag se bhr nklti ha or eski confirmation ye hoti ha k js time frame main market ye flag bnati ha usi time frame main market flag k bhr closing dy.
breakout ki confirmation k bad hum es main sell ki trade lety hain.
es main hmara stop loss flag ki resisting trendline tk hota ha jb k profit target flah se opr moujoof pole ki height k equal nechy ki trf hota ha.
تبصرہ
Расширенный режим Обычный режим