Pivot Point Trading Strategy

No announcement yet.
`
X
  • وقت
  • دکھائیں
Clear All
new posts
  • #1 Collapse

    Pivot Point Trading Strategy
    Assalam alaikum dear members!
    hope so you all are doin well.
    dear memebrs aj ki post main hum pivot point ko study karen gy or dkhn gy ye kia hota ha esko kesy find karen or eski trading strategy kia hoti ha.


    What is Picot Point?

    Dear members pivot point basicall aik turning point hota ha market main jahan se market wapis turn leyti ha.
    day traders pivot point ko use kr k support & resisatnce concept k sth market main achi entry talash karty hain q k ye reversal ya turning point hota ha ksi bhi bullish ya bearish trend ka.
    Pivot points previous day k high low or closing & opening price ko use kr k find kia jata ha.
    Agr ap khud se calculate karna chahen to bhi ap esko calculate kar k market main dkh skty hain warna bht se indicators moujood hain jo k pivot ooint or es se opr or nechy 2,3 resistance & support levels bhi provide karty hain.
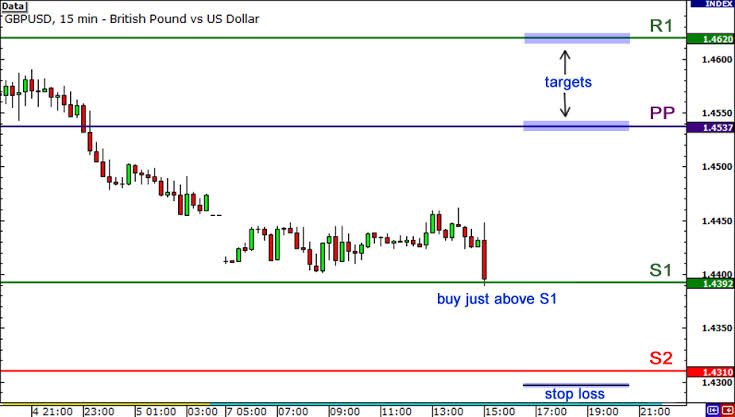


    jesa k opr picture main PP line pivot point ko indicate kar rhi ha ja k us se opr R1 line resitance ko show kar rhi ha or nechy S1 line support ko show kar rahi ha.


    HOW to trade using pivot point?

    Dear members pivot point intraday trend or market main entry or exit main help karta ha.
    agr market pivot point se nechy ho to market bearish consider ki jati ha or hn wait karty hain k market pivot point ko touch kary or phr wahan se hum sell ki trade ln hmara first targrt S1 support hoti hai or 2nd S2 support.
    or hmara stop loss Pivot point se opr hota ha.
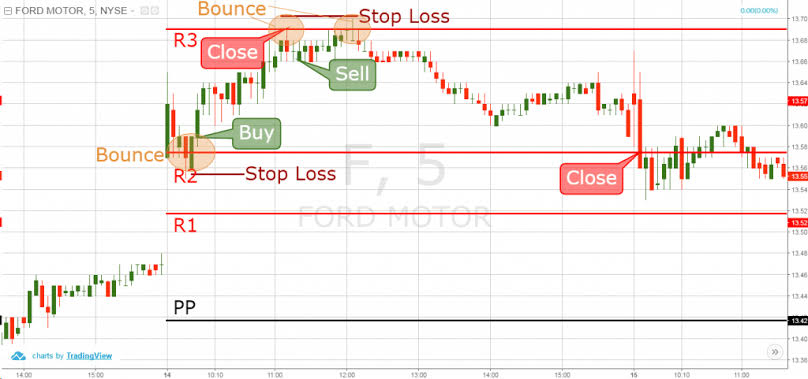


    or aisy hi agr market pivot point se opr ho to market ko bullish consider kia jata ha or pivot point se buy ki trade li jati ha or R1 resistance hmara 1st target hota ha.
    Agr market pivot point ko break kar dy to trend reversal expected hota ha.
    THANK YOU GUYS ! :1f60a:
  • <a href="https://www.instaforex.org/ru/?x=ruforum">InstaForex</a>
  • #2 Collapse

    Re: Pivot Point Trading Strategy

    Pivot point:

    Forex trading me pivot point se murad wo point jis pe ik trend ruk gta hai, aur us point tak market ki price ponchne k bad bar wapis ati hai. Jab bhi aik continue trend forex trading market mn chahay wo upward side ho ya downward side pe ik khas position ko touch krne k bad reverse ho jata hai aur us k bad trend reversal ho jata hai forex trading ka pivot point hota hai. Is point pe market ki prices pounch to gati hai lkin is point ko break up nahi karti hai. Forex trading mn jb bhi ye point break ho jata hai to ye pivot point nai rehta hai. Pivot point se trend reversal ho jata hai. Forex trading me aksar hum indicators pe dekhty hen k wo mukhtalif qisam ki resistance aur support levels ko show karti hai jis se trends wapis ati hai. Pivot point hamare risestance aur support levels ka wo last point hota hai ji se trend ne return back karna hota hai.

    Click image for larger version

Name:	images.png
Views:	2
Size:	11.6 کلوبائٹ
ID:	12391481

    Forex trading mn pivot point ki bhut ziada importance Hoti Hai Jab aap Forex trading me Is point ki proper calculation kar lety hain To Aisi situation main aapko bhut best entries mil sakti hai no doubt Forex trading Mein yah Kaisa point Hota Hai Jiski basis per per aap apni different decision-making complete kar rahe hote hain Diye Jab Bhi aap market ko is point ki basis per differentiate kar rahe hote hain aur isko comparison ki basis per decision making Karte Hain To aap apne best results produce karne mein bahut ziada help Hasil kar sakte hain.

    Click image for larger version

Name:	images (1).png
Views:	7
Size:	26.2 کلوبائٹ
ID:	12391482

    Pivot point technical indicator ha jo k ziada tr "commodities markets" me use hota hay, commodities markets me risk factor ziada hony ki waja se pivot point indicator ko development ki gia jo key market key esy levels ko determine kar sakta hay jo key market ka main potential turning point hota hay, Forex pivot point market esy level ki calculation aur andaza lagta hey key market bullish to bearish ya bearish to bullish me change ho sakti hay esy levels pivot point ki technique use kar key asani se es ko determine kia ja sakta hay.
    • <a href="https://www.instaforex.org/ru/?x=ruforum">InstaForex</a>
    • #3 Collapse

      Re: Pivot Point Trading Strategy

      A pivot point is a technical analysis indicator, or calculations, used to determine the overall trend of the market over different time frames. The pivot point itself is simply the average of the intraday high and low, and the closing price from the previous trading day. On the subsequent day, trading above the pivot point is thought to indicate ongoing bullish sentiment, while trading below the pivot point indicates bearish sentiment.

      [COLOR=#111111][FONT=SourceSansPro]The pivot point is the basis for the indicator, but it also includes other support and resistance levels that are projected based on the pivot point calculation. All these levels help traders see where the price could experience support or resistance. Similarly, if the price moves through these levels it lets the trader know the price is trending in that direction

      How to Calculate Pivot Points
      The pivot point indicator can be added to a chart, and the levels will automatically be calculated and shown. Here's how to calculate them yourself, keeping in mind that pivot points are predominantly used by day traders and are based on the high, low, and close from the prior trading day.

      If it is Wednesday morning, use the high, low, and close from Tuesday to create the pivot point levels for the Wednesday trading day.

      After the market closes, or before it opens the next day, find the day's high and low, as well as the close from the most recent previous trading day.
      Sum the high, low, and close and then divide by three.
      Mark this price on the chart as P.
      Once P is known, calculate S1, S2, R1, and R2. The high and low in these calculations are from the prior trading day
      The Formulas for Pivot Points:
      \begin{aligned} &P = \frac{\text{High} + \text{Low} + \text{Close}}{3}\\ &R1 = (P \times 2) - \text{Low}\\ &R2 = P + (\text{High} - \text{Low})\\ &S1 = (P \times 2) - \text{High}\\ &S2 = P - (\text{High} - \text{Low})\\ &\textbf{where:}\\ &P=\text{Pivot point}\\ &R1=\text{Resistance 1}\\ &R2=\text{Resistance 2}\\ &S1=\text{Support 1}\\ &S2=\text{Support 2}\\ \end{aligned}

      P=
      3
      High+Low+Close

      R1=(P×2)−Low
      R2=P+(High−Low)
      S1=(P×2)−High
      S2=P−(High−Low)
      where:
      P=Pivot point
      R1=Resistance 1
      R2=Resistance 2
      S1=Support 1
      S2=Support 2

      اب آن لائن

      Working...
      X