Technically outlooks
No announcement yet.
X
  • وقت
  • دکھائیں
Clear All
new posts
  • #1 Collapse

    Technically outlooks
    Technical analysis gbpusd updates

    daily time frame chart

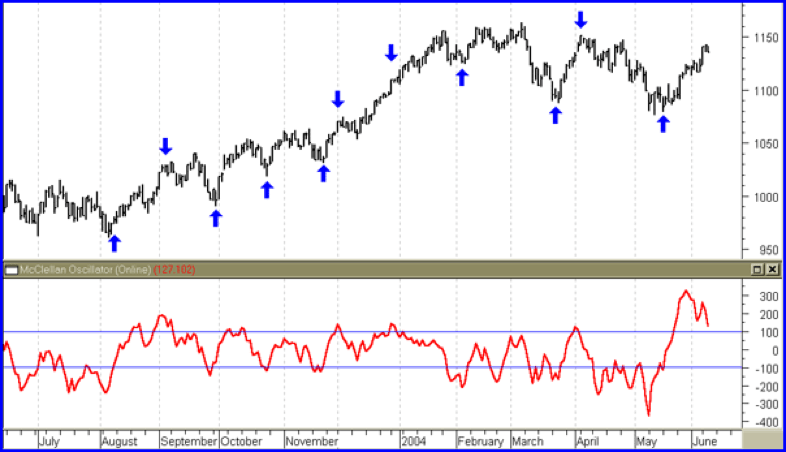
    Hello guys good afternoon my dear traders kisy Ho ummid krta hon theek aur khairiyat se hongy aur aj gbpusd 1. 3020 ke ird gird mandala raha hai, jis se yeh zahir hota hai ke baichnay walay 50% fibonacci retracement level cross over ke sath qeemat ko mazeed 1. 2949 tak barha rahay hain. is soorat mein, aik taweel mudti mandi ka istehkaam zahir ho sakta hai kyunkay 1. 3200 ka multi time mustard honay se qeemat 200 day sma se 1. 2900 tak taizi se gir jaye gi. you s index exchange rate pichlle session mein barhta rahay ga aur 100. 70 par decorations trained line mid day par wapas aajay ga, jo ke nai muzahmat se guzarte hue 1. 2849 ke aas paas gbpusd mein mutawaqqa kami hai. haliya uuchaal 1. 2990 ki satah se qadray oopar mandlana aik mazboot baichnay walay ka inqilab ho ga jis se qeemat ko 40 aur 50 din ki saada harkat pazeeri ost se 1. 2970 par laya jaye ga. is rukawat ki mazboot khilaaf warzi mandi ke taasub ko barqarar rakhay gi, aur yeh shaam ke session mein 38. 8 % fibonacci retracement ki satah tak pahonch gayi. takneeki nuqta nazar se, bolungar baind ke isharay aur asketars aik wazeh manfi raftaar ko barqarar rakhtay hain aur ab bhi ziyada farokht honay walay kndishng area se kuch faaslay par hain, jab ke macd aahista aahista apni mid line se neechay ki taraf barh raha hai jaisay ke phislan ko neechay kar raha ho. yeh jora 1. 3150 par fori muzahmati rukawat ko rivers kar sakta hai aur kharidaron ke liye pichlle haftay ki buland 1. 3290 par dobarah daawa karne ka darwaaza khol sakta hai,

    Click image for larger version

Name:	image.jpeg
Views:	1
Size:	154.3 کلوبائٹ
ID:	12523722

    Gbpusd h4 chart

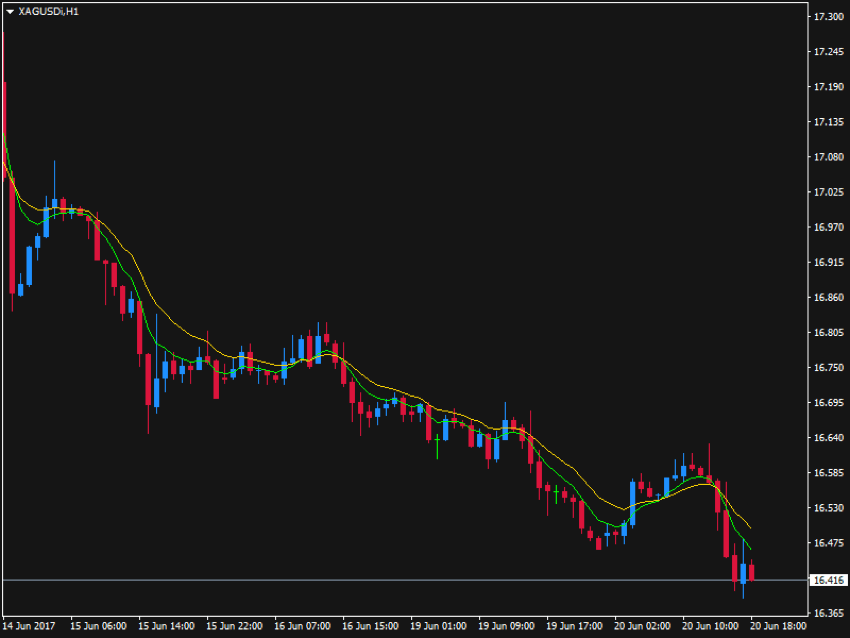
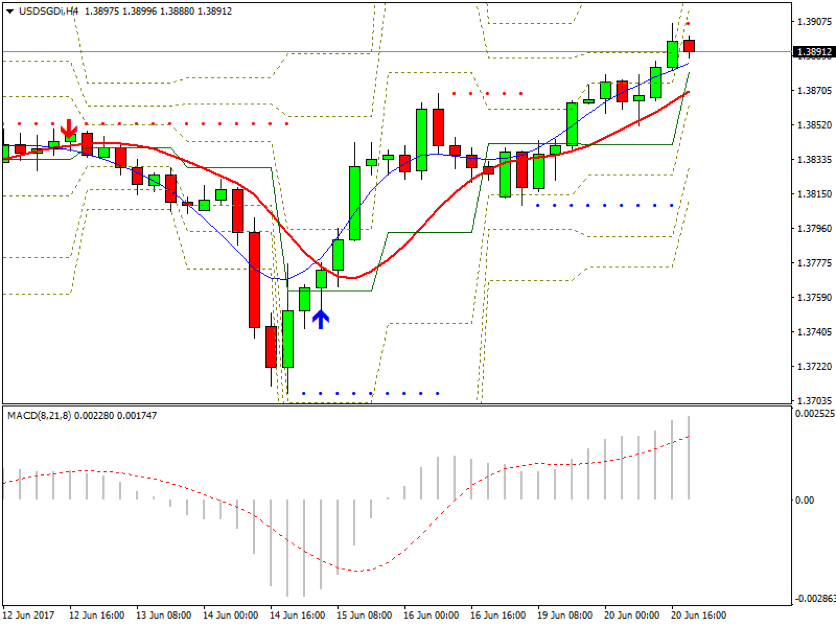
    my dear friend gbpusd h4 ke time frame par, aakhri band honay wali mom batii aur sir aur kandhay ka ulta patteren qaim karne se kharidaron ki tawajah hatt jaye gi aur qeemat 1. 3000 se neechay rahay gi. is manzar naame mein, 200 din ke saada moving everest ke sath mazeed tasdeeq aur tasfia ke muntazir baichnay walay 1. 2870 ke qareeb reechh ko challenge karen ge. is ke bar aks, agar kharidaron ki taaqat manfi pehlu se palat jati hai aur qeemat 1. 3120 par 38. 3 % fibonacci retracement ki satah se oopar jati hai, to Amrici session mein 1. 3190 par izafi numoo dekhi ja sakti hai. taajiron ko anay wali range par nazar rakhnay aur aala assar walay khabron ke adaad o shumaar ko dekhnay ki zaroorat hai, jo taweel mudti ulat jane ki simt ko bhi badal day ga aur market se پپس haasil karne ke liye tijarat ka intizam kere ga. is haftay ahem awamil kharidaron ki tawajah mabzol kar den ge, aur baichnay walay ka dabao 1. 2760 ke ird gird aglay manfi pehlu par mukammal control kar le ga

    Click image for larger version

Name:	image.jpeg
Views:	1
Size:	151.9 کلوبائٹ
ID:	12523723
     
    Last edited by ; 19-04-2022, 01:47 PM.
  • <a href="https://www.instaforex.org/ru/?x=ruforum">InstaForex</a>
  • #2 Collapse

    Re: Technically outlooks

    what is technical Outlook
    aslam oa alikum dear forex technical outlook kya hota hai aur is ki importance hoti hai forex form dear forex on the weekly prices jo hoti haen market mein wo sub ki sub bullish momentum aur is ky bad abiding assending trendline hoti haen ham en ko see kr sakty haen potential tour per wo bhe bullish momentum ky lye jo climb from hoti hai is mein fibonacci retracement hoti hai jo first resistancse line with finbonacci extension tak ly jati haen
    Click image for larger version

Name:	technical 1.jpg
Views:	1
Size:	6.8 کلوبائٹ
ID:	12387983
    Key takeware in forex of technical Outlook
    dear forex trader market mein agar to ap new haen to pher ap ko sub se phely jo kam krna chye wo hai market analysis ka agar ap ko market ka analysis krna a jata hai to pher os ky bad next step jo wo pher ap trade kren agar ap baghir kesi analysis ky trade lagana start krty haen to pher ap ko zyda ter chance losses ky hoty haen to is lye ap ko chaen koi bhe kam ho to so ko success krny k y lye ap ko phely know how krna para hai smajhna perta hai
    Click image for larger version

Name:	technical 3.jpg
Views:	1
Size:	7.1 کلوبائٹ
ID:	12387984
    market mein technical analysis mein jo sub se imortant role hai wo trade lagany ky bary mein mean ye ko ap ko pata hona chye ky kab trade lagni hai aur kab os trade ko close krna hai jub koi candle pattern banta hai to os ky bary mein ap ko information ka hona lazmi hai agar to ap os candle pattern ky bary mein nhe jatnty haen to p her ap ko loss bhe hota hai zidy jo chance ban jata hai wo loss ka hai profit to bhot kam he hota hai to is lye market mein technical analysis ki bhot bari importance hai
    Click image for larger version

Name:	technical 2.jpg
Views:	1
Size:	7.4 کلوبائٹ
ID:	12387988
    Last edited by ; 20-04-2022, 10:07 AM.
    • #3 Collapse

      Re: Technically outlooks

      Today's update gbpusd currency pairs

      Gbpusd chart daily time frame

      Hello guys and good afternoon aur aaj ham gbpusd per hi krty hain to fi al haal, mein d1 time frame ka istemaal karte hue gbp / usd jori ko dekh raha hon, aur 132. 90 muzahmati zone ke baichnay walay is ki qeemat par haawi hain, lekin sailors mimbraan ne apni position barqarar nahi rakhi hai. aur mangal ko Amrici session ke aaghaz par, is ki qeemat 130. 56 ki talabb se barh gayi. taham, gbp / usd jori ki taraqqi bilkul wazeh hai. is ki wajah yeh hai ke roos aur roosi bankon par aed sakht pabandion ke baad rouble mazeed girnay laga. yaqeenan, rosyon ne khud ko rouble ki qader mein kami se bachanay ke liye Amrici dollar kharidne ke liye daud laga di. is terhan, gbp / usd aik baar phir 133. 70 par muzahmat ki taraf mazboot ho raha hai, aur mere khayaal mein gbp / usd is waqt tak nahi ruke ga jab tak ke yeh 130. 90 ki qeemat ki satah ko check nahi kar laita. lekin aaj, tajir adp ghair forme rozgaar ki tabdeeli ki taraf tawajah mabzol kar rahay hain, jis ka elaan Amrici session ke aaghaz mein kya jaye ga.

      Click image for larger version

Name:	image.jpeg
Views:	1
Size:	129.1 کلوبائٹ
ID:	12388394

      Gbpusd chart h4 time frame

      Aur ab h4 time frame ke liye, gbp / usd bilkul 133. 70 muzahmat par hai, jo barah e raast 130. 20 supply ke liye aik ahem ilaqa hai. is maqam par, agar qeemat mazeed barh jati hai, khredar 131. 80 ke hadaf se rabita kar satke hain, aur agar yeh kami aati hai, to qeemat aik baar phir demand zone 130. 80 tak pahonch sakti hai. jahan tak raftaar ke isharay ka talluq hai, qeemat kaafi had se ziyada kharidi hui mahol hai. lehaza aap qaleel mudti mandi ki simt ke liye islaah ki tawaqqa kar satke hain. taham, taweel mudti taasub ab bhi taiz hai kyunkay sma ki takneeki linen qeemat se bohat neechay hain. muawza aur geographiyai siyasi sorat e haal roz burrows bigarti ja rahi hai, jis se dollar ki maang mein mazeed izafah ho sakta hai aur gbp / usd ka taasub barh sakta hai. nateejatan, hamein kharidari ke mawaqay talaash karne chahiye jab tak ke qeemat 130m50 zone ki jaanch nah kar le, aur agar khredar un rukawaton par qaboo pa letay hain, to April 133. 70 ki chouti kharidaron ke liye agla hadaf ho sakti hai,

      Click image for larger version

Name:	image.jpeg
Views:	1
Size:	132.0 کلوبائٹ
ID:	12388395
         
      • #4 Collapse

        Re: Technically outlooks

        Gbpusd technical analysis

        daily time frame

        daily time frame ka istemaal karte hue gbpusd jore mein paish anay walay taaza tareen halaat ko dekhte hue, yeh dekha ja sakta hai ke pichlle chand hafton mein kaafi geherai se neechay ki taraf harkat hui hai, yeh dekha gaya hai ke taqreeban har roz mom batii ki harkat jari reh sakti hai. aisay halaat ke sath band kya jata hai jin mein kami ka rujhan hota hai, yeh trading friday mein bhi hota hai jo aisa lagta hai ke mom batii ka namona neechay ki taraf ishara kar raha hai aur candle body ka size itna lamba hai, yeh ho sakta hai ke aglay haftay market khilnay ke mauqa par blush ko muntaqil karne ke liye qeemat, lekin yaqeenan hamein install andikitrz ke faraham kardah data ko bhi dekhna chahiye, surkh are s aayi indicetor jis line ki taraf ishara kar raha hai is ki simt ko dekhen, aisa maloom hota hai ke macd indicetor histogram ki position neechay hai. nisbatan lambay size ke sath sifar ki satah, aap dekh satke hain ke macd signal line ufuqi tor par harkat kar rahi hai, yeh sabz lakeer, peeli line aur niilii line ki terhan nazar aati hai jo ke 150 ema line hai, yeh sab st. aisa lagta hai ke bemaar neechay ki taraf barh raha hai.

        Click image for larger version

Name:	image.jpeg
Views:	1
Size:	148.8 کلوبائٹ
ID:	12388753

        Gbpusd h1 chart


        h1 time frame ka istemaal karte hue gbpusd market mein mom btyon ki naqal o harkat ka mushahida karte hue, yeh dekha gaya ke is arsay mein trading mein qeematon ki naqal o harkat waqai kaafi mutharrak thi, haftay ke aaghaz mein trading budh tak simt ab bhi oopar jati nazar aati thi, lekin jab jumaraat ki trading mein daakhil honay se dobarah qeemat mein kami nazar anay lagi, yahan tak ke agli tijarat mein yeh dekha gaya ke farokht knndgan ki taraf se sakht dabao dala gaya jis ki wajah se qeemat ki position subah ki ibtidayi qeemat se bohat kam qeemat ke sath band hogayi, is liye simt mein ab bhi mandi ka rujhan hai, yaqeenan is ka kaafi mauqa hoga agar hum isi simt mein position kholeen, lekin yeh bohat acha hoga agar hum asharion ke halaat par bhi nazar rakhen, yeh are s aayi ki surkh lakeer ki terhan nazar aata hai. Indicetor over sealed area mein daakhil ho gaya hai, macd indicetor histogram baar ki position ab bhi kaafi lambay size ke sath sifar ki satah se neechay hai, aisa lagta hai ke macd signal line ki simt bhi harkat kar rahi hai. neechay ki taraf, ema line 8, ema line 21 aur ema line 150 neelay rang ki hain, aisa lagta hai ke sab kuch neechay ki taraf barh raha hai.

        Click image for larger version

Name:	image.jpeg
Views:	1
Size:	147.1 کلوبائٹ
ID:	12388755

        Collection
        Dear friends install kardah andikitrz ki taraf se di gayi Hadayat par dheyaan day kar is baat ki nigrani ki ja sakti hai ke ziyada tar asharie ab bhi is baat ka imkaan dete hain ke qeemat mein dobarah mandi aaye gi, lekin phir bhi aap ko mohtaat rehna ho ga kyunkay deegar isharay hain jo dekhaya gaya hai ke qeemat ziyada farokht honay walay ilaqay mein daakhil ho chuki hai, is liye waqai, mehfooz rehne ke liye, hum is waqt tak intzaar karte hain jab tak ke mom batii demand zone mein neechay ki taraf daakhil nah ho jaye, phir khula khula sale kya ja sakta hai, kyunkay mom batii simt ko mourr sakti hai aur maang se daur ho sakti hai. sab se oopar ki taraf zone jo kharidari ke mawaqay ko mazboot banata hai
           
        • #5 Collapse

          Re: Technically outlooks

          What is Technical Analysis?

          Technical analysis is a tool, or , used to predict the probable future price movement of a security – such as a stock or currency pair – based on market data.

          The theory behind the validity of technical analysis is the notion that the collective actions – buying and selling – of all the participants in the market accurately reflect all relevant information pertaining to a traded security, and therefore, continually assign a fair market value to the scurity.


          movement that occurs within a 15-minute time span may be very significant for an intra-day trader who is looking for an opportunity to realize a profit from price fluctuations occurring during one trading day. However, that same price movement viewed on a daily or weekly chart may not be particularly significant or indicative for long-term trading purposes.

          It’s simple to illustrate this by viewing the same price action on different time frame charts. The following daily chart for silver shows price trading within the same range, from roughly $16 to $18.50, that it’s been in for the past several months. A long-term silver investor might be inclined to look to buy silver based on the fact that the price is fairly near the low of that range.


          However, the same price action viewed on an hourly chart (below) shows a steady downtrend that has accelerated somewhat just within the past several hours. A silver investor interested only in making an intra-day trade would likely shy away from buying the precious metal based on the hourly chart price action.


          Technical Indicators – Moving Averages

          In addition to studying candlestick formations, technical traders can draw from a virtually endless supply of technical indicators to assist them in making trading decisions.

          Moving averages are probably the single most widely-used technical indicator. Many trading strategies utilize one or more moving averages. A simple moving average trading strategy might be something like, “Buy as long as price remains above the 50-period exponential moving average (EMA); Sell as long as price remains below the 50 EMA”.

          Moving average crossovers are another frequently employed technical indicator. A crossover trading strategy might be to buy when the 10-period moving average crosses above the 50-period moving average.

          The higher a moving average number is, the more significant price movement in relation to it is considered. For example, price crossing above or below a 100- or 200-period moving average is usually considered much more significant than price moving above or below a 5-period moving average.


          Technical Indicators – Pivots and Fibonacci Numbers

          Daily pivot point indicators, which usually also identify several support and resistance levels in addition to the pivot point, are used by many traders to identify price levels for entering or closing out trades. Pivot point levels often mark significant support or resistance levels or the levels where trading is contained within a range. If trading soars (or plummets) through the daily pivot and all the associated support or resistance levels, this is interpreted by many traders as “breakout” trading that will shift market prices substantially higher or lower, in the direction of the breakout.

          Daily pivot points and their corresponding support and resistance levels are calculated using the previous trading day’s high, low, opening and closing prices. I’d show you the calculation, but there’s really no need, as pivot point levels are widely published each trading day and there are pivot point indicators you can just load on a chart that do the calculations for you and reveal pivot levels. Most pivot point indicators show the daily pivot point along with three support levels below the pivot point and three price resistance levels above it.


          Technical Indicators – Momentum Indicators

          Moving averages and most other technical indicators are primarily focused on determining likely market direction, up or down.

          There is another class of technical indicators, however, whose main purpose is not so much to determine market direction as to determine market strength. These indicators include such popular tools as the Stochastic Oscillator, the Relative Strength Index (RSI), the Moving Average Convergence-Divergence (MACD) indicator, and the Average Directional Movement Index (ADX).

          By measuring the strength of price movement, momentum indicators help investors determine whether current price movement more likely represents relatively insignificant, range-bound trading or an actual, significant trend. Because momentum indicators measure trend strength, they can serve as early warning signals that a trend is coming to an end. For example, if a security has been trading in a strong, sustained uptrend for several months, but then one or more momentum indicators signals the trend steadily losing strength, it may be time to think about taking profits.

          The 4-hour chart of USD/SGD below illustrates the value of a momentum indicator. The MACD indicator appears in a separate window below the main chart window. The sharp upturn in the MACD beginning around June 14th indicates that the corresponding upsurge in price is a strong, trending move rather than just a temporary correction. When price begins to retrace downward somewhat on the 16th, the MACD shows weaker price action, indicating that the downward movement in price does not have much strength behind it. Soon after that, a strong uptrend resumes. In this instance, the MACD would have helped provide reassurance to a buyer of the market that (A) the turn to the upside was a significant price move and (B) that the uptrend was likely to resume after price dipped slightly on the 16th.


          Because momentum indicators generally only signal strong or weak price movement, but not trend direction, they are often combined with other technical analysis indicators as part of an overall trading strategy.


          .
          • <a href="https://www.instaforex.org/ru/?x=ruforum">InstaForex</a>
          • #6 Collapse

            Re: Technically outlooks

            Today gbpusd technical analysis

            daily time frame


            aaj mein gbp / usd jori aur gbp / usd jori ke baray mein baat karoon ga. kyunkay mein dekh raha hon ke yeh dono jore aaj tijarat ke liye kaafi dilchasp hain. mein ne sab se pehlay gbp / usd jori ke sath shuruvaat ki. jab rozana time frame se dekha jaye to, fi al haal gbp / usd baichnay walay ke zair control hai, is liye meri raye mein yahan farokht ka mood ab bhi ghalib hai. aur mojooda qeemat darasal is ke kami ke hadaf par hai, jo ke 1. 269 ki qeemat ki had mein rozana support area hai. lehaza hum is ilaqay mein qeemat ke jawab ka intzaar kar satke hain, agar yeh toot jata hai to gbp / usd mazeed girnay ke qabil ho jaye ga, aglay yomiya support area ko 1. 2594 ki qeemat ki had par hadaf bana kar. taham, agar baad mein yeh pata chalta hai ke qeemat 1. 2696 support area ko tornay mein nakaam rehti hai, to qeemat bherne ke qabil ho jaye gi kyunkay usay is ilaqay mein mustard kar diya gaya tha, aur meri raye mein, izafay ka qareeb tareen hadaf rozana hai 1. 2858 ki qeemat ki had mein muzahmati ilaqa. is liye hamaray liye intzaar karna dilchasp hai aur hum baad mein lain deen karne ke liye aik chhota time frame istemaal kar satke hain, hamein sirf Europi ya Amrici market sishnz ka intzaar karna parre ga,

            Click image for larger version

Name:	image.jpeg
Views:	1
Size:	168.3 کلوبائٹ
ID:	12389190


            Gbpusd h4 chart

            Gbpusd pair ki trading par gbp / usd currency jora kamzor ho gaya. trade day trading ke liye h1 time frame ka istemaal karte hue, yeh wazeh lagta hai ke moving average indicetor ab bhi mandi ke rujhan mein hai. darin Isna stochastic indicetor 80 ki satah se oopar hai taakay aaj subah asian session mein qeemat mein mazeed tasheeh ka imkaan mojood hai. meri pishin goi yeh hai ke qeemat is waqt tak durust ho jaye gi jab tak ke yeh ma 50 tak nah pahonch jaye jo 1. 2800-1. 2810 par muzahmat par hai. yeh muzahmati satah qeemat ko rivers karne aur mandi ke rujhan ko jari rakhnay ke liye qadam jamanay ki salahiyat rakhti hai. Stochastic indicetor ke neechay honay ka intzaar karte hue aik mukhtasir position kholeen taakay raftaar durust ho, umeed hai ke taweel tairnay ka intzaar kiye baghair qeemat fori tor par hadaf tak neechay aajay gi. aakhir mein, aaj bhi baichnay walay ke camp mein market par ghalba haasil karne ki salahiyat mojood hai, lehaza farokht ke ikhtiyarat par ghhor karna mushkil hai,

            Click image for larger version

Name:	image.jpeg
Views:	1
Size:	159.6 کلوبائٹ
ID:	12389193


            اب آن لائن

            Working...
            X