Assalam alaikum!
dear members umeed ha ap sb thk hn gy or apka trading week acha ja raha ho ga.
jesa k ap janty hain hum forex indicators study kr rhy hain or es main agy barhty hovy aj hum Force Index ko study krn gy or hum dekhen gy ye kesy kam krta ha or trading main kes help krta ha.
WHAT IS FORCE INDEX INDICATOR?
Dear members force index aik technical indicator ha jo k alexender Elder ny bnaya tha.Force index infact aik oscillator ha jo k kisi bhi movement main bears or bulls ki power ya force ko measue karta ha.
3 main components jin k bary main force index maloomat deta ha wo ye hain,
Direction of price
Extent of price change
Trading volume
Dear members agr force index ko moving averages k sth istmal kia jy to ye accurate result deta ha.
jb market main kafi zada trading volume ho to force index ki movement bhi kafi zada hota ha kr jb market main vilatility km ho to force index ki movement bhi km hoti ha.
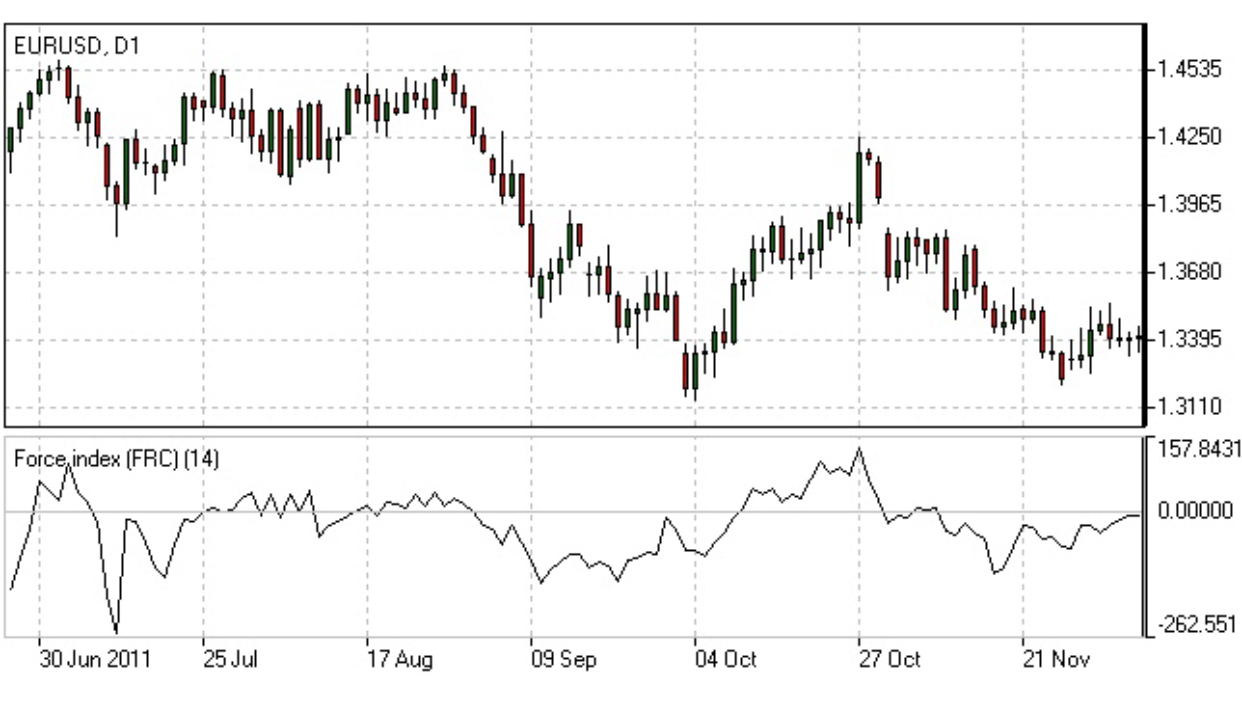
agr es picture main dekha jy to hamen market main kahen kahen choti movement dekhny ko milti ha laikin force index bht zada movement dkhata ha. Eska matlab hota ha k chahe movement km ho ri ha market main laikin jis direction main ja ri ha market us direction ki firce kafi zada ha mtlb k bears ya bulls power main hain or market abi es direction main jygi.
HOW TO TRADE USING FORCE INDEX?
Dear members force index oscillator 1 line k gird move karta ha or us line se opr ki values positive hoti hain jb k nechy ki values negative hoti hain.
to jb market force se opr move karti ha to force index ki values line se opr jati hain or positive ho jati hain.
laikin jb markey kafi zor se nechy girti ha to force index central line se nechy ata ha or negative ho jata ha.
agr aap 13 days Exponential moving average ko istmal karen firce index main to es se apko trading main help ho skti ha.
jb 13 day EMA central line ko opr ki trf cross kry to ye buy ka signal hota ha eska mtlb hota ha k bulls ab powrr main hain or prices oper jaen ge.
or jb 13 days EMA central line ko nechy ki trf cross kary to ye sell ka signal hota ha eska mtlb hota ha k bears ab power mn aa rhy hain or prices mechy giren ge.

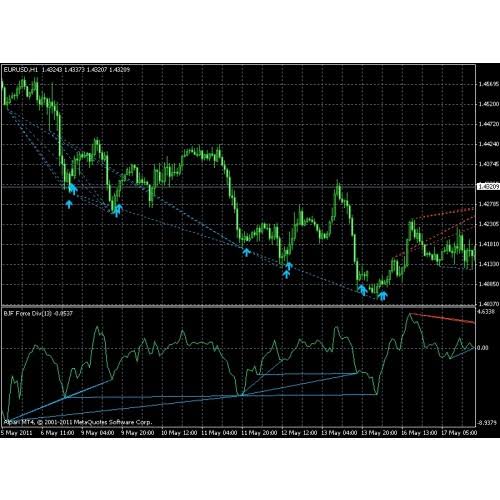
FORCE INDEX Divergence :
Dear members divergence us situation ko kaha jata ha jb prices or force index opposite direction main move karen.for example price opr ki trf jati ha or higher highs bnati ha.
jb k force index ya to lower high bnata ha ya phr apny purany high ko break ni krta.Agr divergence kahen apko dkhny ko ml jy to eska mtlb hota ha k ab ye market ka turning point ha or ab trend change ho ga to ap yahan se achi trade le skty hain.
Divergence bigger time frame main zada accurate hoti ha or trend reversal ho skti ha jb k lower time frame main ye itni effective ni hoti.
Note: use proper risk & money management while trading forex
dear members umeed ha ap sb thk hn gy or apka trading week acha ja raha ho ga.
jesa k ap janty hain hum forex indicators study kr rhy hain or es main agy barhty hovy aj hum Force Index ko study krn gy or hum dekhen gy ye kesy kam krta ha or trading main kes help krta ha.
WHAT IS FORCE INDEX INDICATOR?
Dear members force index aik technical indicator ha jo k alexender Elder ny bnaya tha.Force index infact aik oscillator ha jo k kisi bhi movement main bears or bulls ki power ya force ko measue karta ha.
3 main components jin k bary main force index maloomat deta ha wo ye hain,
Direction of price
Extent of price change
Trading volume
Dear members agr force index ko moving averages k sth istmal kia jy to ye accurate result deta ha.
jb market main kafi zada trading volume ho to force index ki movement bhi kafi zada hota ha kr jb market main vilatility km ho to force index ki movement bhi km hoti ha.
agr es picture main dekha jy to hamen market main kahen kahen choti movement dekhny ko milti ha laikin force index bht zada movement dkhata ha. Eska matlab hota ha k chahe movement km ho ri ha market main laikin jis direction main ja ri ha market us direction ki firce kafi zada ha mtlb k bears ya bulls power main hain or market abi es direction main jygi.
HOW TO TRADE USING FORCE INDEX?
Dear members force index oscillator 1 line k gird move karta ha or us line se opr ki values positive hoti hain jb k nechy ki values negative hoti hain.
to jb market force se opr move karti ha to force index ki values line se opr jati hain or positive ho jati hain.
laikin jb markey kafi zor se nechy girti ha to force index central line se nechy ata ha or negative ho jata ha.
agr aap 13 days Exponential moving average ko istmal karen firce index main to es se apko trading main help ho skti ha.
jb 13 day EMA central line ko opr ki trf cross kry to ye buy ka signal hota ha eska mtlb hota ha k bulls ab powrr main hain or prices oper jaen ge.
or jb 13 days EMA central line ko nechy ki trf cross kary to ye sell ka signal hota ha eska mtlb hota ha k bears ab power mn aa rhy hain or prices mechy giren ge.
FORCE INDEX Divergence :
Dear members divergence us situation ko kaha jata ha jb prices or force index opposite direction main move karen.for example price opr ki trf jati ha or higher highs bnati ha.
jb k force index ya to lower high bnata ha ya phr apny purany high ko break ni krta.Agr divergence kahen apko dkhny ko ml jy to eska mtlb hota ha k ab ye market ka turning point ha or ab trend change ho ga to ap yahan se achi trade le skty hain.
Divergence bigger time frame main zada accurate hoti ha or trend reversal ho skti ha jb k lower time frame main ye itni effective ni hoti.
Note: use proper risk & money management while trading forex
تبصرہ
Расширенный режим Обычный режим