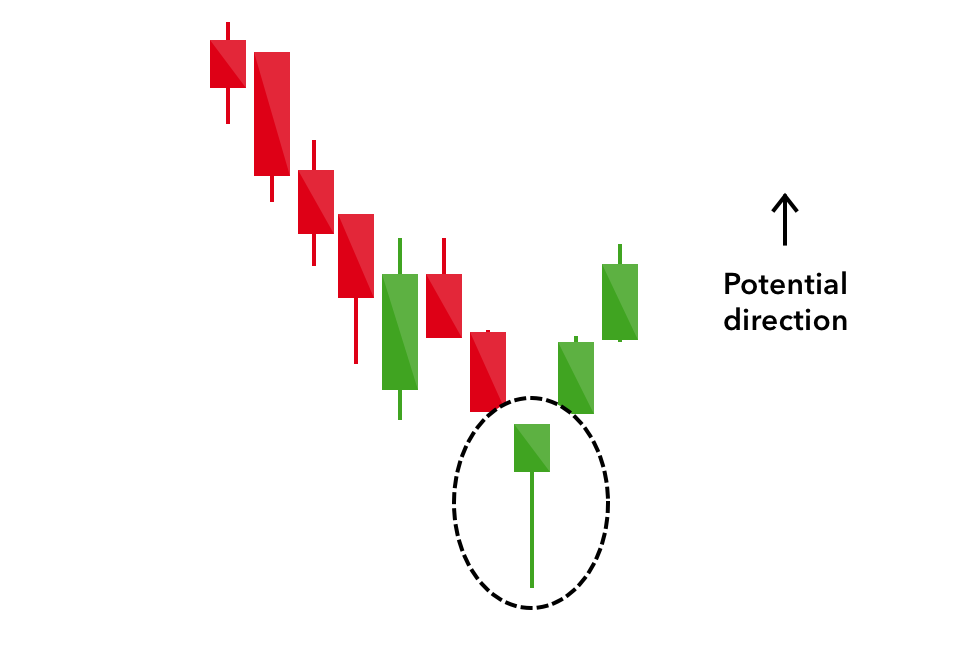
Bearish descending hawk
No announcement yet.
X
  • وقت
  • دکھائیں
Clear All
new posts
  • #1 Collapse

    Bearish descending hawk
    Definition

    yeh patteren aik chhota sa safaid jism hai jis mein pehlay ke nisbatan lambay safaid jism hotay hain. yeh harami patteren se mushabihat rakhta hai, siwaye is ke ke dono jism safaid hain .


    Click image for larger version

Name:	images (1).png
Views:	7
Size:	27.5 کلوبائٹ
ID:	12504186


    Recognition Criteria

    1. market aik murawaja oopri rujhan se mutsif hai .
    2. pehlay din aik safaid jism ka mushahida kya jata hai .
    3. dosray din phir hum ne aik safaid jism dekha jo pehlay din ke jism se poori terhan lipta sun-hwa hai .

    Pattern Requirements and Flexibility

    bearish descending hawk do safaid candle stick par mushtamil hota hai, jis mein pehlay din ka safaid jism mandaa zail safaid jism ko ghair laita hai. sab se pehlay aik aam ya lambi safaid mom batii honi chahiye. dono shama daan ke body tops ya باٹمز aik hi satah par ho satke hain, lekin jo bhi ho, dosray din ka body pehlay se chhota hona chahiye .

    Trader’s Behavior

    yeh patteren tafawut ka ishara hai. up trained ki khasusiyat wali market mein, hum sab se pehlay bhaari kharidari dekhte hain jo pehlay din ki safaid body se zahir hota hai. taham, dosray din namodaar honay wali choti body kharidaron ki kam hoti taaqat aur josh ki taraf ishara karti hai is terhan rujhan ko tabdeel karne ka mahswara deta hai .


    Sell/Stop Loss Levels


    tasdeeq ki satah ko aakhri qareebi ya pichlle safaid jism ke darmiyani nuqta ke tor par bayan kya jata hai, jo bhi kam ho. tasdeeq ke liye qeematein is satah se neechay honi chahiye .


    Click image for larger version

Name:	images (2).png
Views:	11
Size:	25.2 کلوبائٹ
ID:	12504187


    stap nuqsaan ki satah ko aakhri do bulandiyon se ziyada ke tor par bayan kya jata hai. mandi ke isharay par amal karte hue, agar qeematein neechay jane ke bajaye barh jati hain, aur stap nuqsaan ki satah se lagataar do yomiya oonchai ko band kar deti hain, jab ke koi taizi ka namona nahi paaya jata hai, to stap nuqsaan ko mutharrak kya jata hai .
  • <a href="https://www.instaforex.org/ru/?x=ruforum">InstaForex</a>
  • #2 Collapse

    Assalamu Alaikum Dosto!
    Descending Hawk Pattern
    Descending hawk pattern two days candles par mushtamil aik bearish trend reversal pattern hai, jo k prices k top par ya bullish trend k akhtetam par banta hai. Pattern ki pehli aur dosri candle same bullish candles hoti hai jis main dosri candle pehli candle k andar open aur close hoti hai. Descending hawk pattern ki dosri candle ki formation same "Bearish Harami Pattern" aur "Bearish Harami Cross Pattern" jaisi hai lekin aik to iss candle ka color white hoti hai, jo k "Bearish Harami Pattern" k candle main black hoti, dosra ye candle small real body ki hoti hai, jo k "Bearish Harami Cross Pattern" ki candle doji candle hoti hai, jiss ka open aur close same hota hai. Descending hawk pattern aik bearish trend reversal pattern hai, jo k prices k top par ya bullish trend main banta hai. Ye pattern bullish k kamzori ki nishan dahi karta karta hai. Dosree candle aik aik small real body wali bullish candle hoti hai jo uptrend ka ikhtetaam karti hai, jiss k baad prices bearish trend reversal ka sabab banti hai.
    Candles Formation
    Descending hawk pattern two days candles par mushtamil ek bearish trend reversal pattern hai, aur uptrend k baad main bhi bannta hai to us k leye candles ki darrjazel format honi chaheye ;
    1. First Candle: Descending hawk pattern main pehle din ki candle aik long real body wali white/green hotee hai, jo prices k uptrend ki turrjumani kartti hai. Ye candle normal size aur bullish trend k mutabiq banti hai.
    2. Second Candle: Descending hawk pattern main dosre din ki candle bhi same white ya red candle banti hai, jo k prices k bullish trend ka ikhtetaam kartti hai, dosre din ki candle pehle din ki candle k real body k andar open aur close hoti hai.
    Explaination
    Descending hawk pattern "Bearish Harami Pattern" aur "Bearish Harami Cross Pattern" se melta julta pattern hai, jo same bullish trend ko bearish trend me reverse kia jata hai. Descending hawk pattern two days candles par mushtamil pattern hai, jis me pehlee aik long real body wali bullish candle hote hai, jis k baad dosree aik long real body wali small bullish candle banti hai. Pehli candle prices k uptrend ki nishan-dahi kartti hai, ye candle size aur formation me normal long real body wali bullish candle hotti hai. Lekin dosre din ki candle aik small real body wali bullish candle hotee hai, jo k open aur close pehli candle k real body main hoti hai. Pattern ki dono candle bullish hone k bawajood bhi bearish trend reversal pattern ka kaam karta hai.
    Trading
    Descending hawk pattern bhi dosre bearish trend reversal patterns ki tarah sell k signals deta hai. Pattern par trading ka tareeqay kar bhi "Bearish Harami Pattern" jaisa hai, jiss par market main sell ki entry ki jati hai. Pattern par trading se pehle prices ka baghawar study karlen k ya to ye uptrend me honni chaheye aur ya ye high level pe hon. Pattern ki pehlee candle normal long real body wali hotti hai, jis ko dosre din ki small bullish candle follow kartti hai. Descending hawk pattern me dosre din ki candle ki formation bohut zarrori hai, jo k pehli candle k under honi chaheye, yanni candle ki open aur close dono pehli candle k open aur close se kam honi chaheye. Descending hawk Candlestick k leye trend confirmation trade entry se pehle zarrori hai, jab bhi pattern k baad teesre din ki candle bearish ya black candle banne gi to ye market main me sell se entry karne ka time hoga. Stop Loss pattern k sab se highest price ya bearish candle k top se aik ya do pips above resistance point par lagayen.
    • #3 Collapse

      Introduction of Descending Hawk Pattern Aoa Ummid karta hon Ap Sab khariat Say Hon gy AJ Descending hawk pattern two days CANDLES par mushtamil aik bearish trend reversals pattern hai, jo k prices k top par ya bullish trend k akhtetam par banta hai. Pattern ki pehli aur dosri candle same Bullishness candles hoti hai jis main dosri candle pehli candle k andar open aur close hoti hai. Descending hawk pattern ki dosri candle ki formation same "Bearish Harami PATTERN" aur "Bearish Harami Cross Pattern" jaisi hai lekin aik to iss candle ka color white hoti hai, jo k "Bearish Harami Pattern" k candle main black hoti, dosra ye candle small real body ki hoti hai, jo k "Bearish Harami Cross Pattern" ki candle doji candle hoti hai, jiss ka open aur close same hota hai. Descending hawk pattern aik bearish trend reversal pattern hai, jo k prices k top par ya bullish trend main banta hai. Ye pattern bullish k kamzori ki nishan dahi karta karta hai. Dosree candle aik aik small real body wali bullish candles say hi Trad ho Jay gi The Explanation of Descending hawk pattern Dear Jab bh Descending hawk pattern two days CANDLES par mushtamil ek bearish trend reversal pattern hai, aur uptrend k baad main bhi bannta hai to us k leye First Candle Descending hawk pattern main pehle din ki candles aik long real body wali white/Green hotee hai, jo prices k uptrend ki turrjumani kartti hai. Ye candle normal size aur bullish trend k Sath ho jay giDescending hawk pattern main dosre din ki candles bhi same white ya red CANDLE Say Ho Jay gii Trading Stradgy Dear Jab bh Descending hawk pattern "Bearish Harami Pattern" aur "Bearish Harami Cross Pattern" se melta julta PATTERN hai, jo same bullish trend ko BEARISH trend me reverse kia jata hai. Descending hawk pattern two days candles par mushtamil pattern hai, jis me pehlee aik long real body wali bullish candle hote hai, jis k baad dosree aik long real body wali small bullish candle banti hai. Pehli candle prices k uptrends ki nishan-dahi kartti hai, ye candle size aur formation me normal long real body wali Bullishness candle hotti hai. Lekin dosre din ki candle aik small real body wali Bullishness candle hotee hai, jo k open aur close pehli candle k real body main hoti haiAor Descending hawk PATTERN bhi dosre bearish trend reversal patterns ki tarah sell k signals deta hai. Pattern par trading ka tareeqay kar bhi "BEARISH Harami Pattern" jaisa hai, jiss par market main sell ki entry ki jati hai. PATTERN par trading se pehle prices ka baghawar study karlen k ya to ye uptrend me honni chaheye aur ya ye high level pe hon. Pattern ki pehlee candle normal long real body wali hotti hai, jis ko dosre din ki small bullish candle follow kartti hai. Descending hawk pattern me dosre din ki candle ki formation bohut zarrori hai, jo k pehli candle k under honi chaheye, yanni candle ki open aur close dono pehli candle k open aur close se kam honi chaheye. Descending hawk Candlestick k leye Trending confirmation trade entry se pehly Say Hi Takes profit Say Entery ho Jay gi
      Ap ka aik Thanks Post ki quality kalye Bhoot Important hy (Thanks)
      • #4 Collapse

        dle pehli candle k andar open aur close hoti hai. Descending hawk pattern ki dosri candle ki formation same "Bearish Harami PATTERN" aur "Bearish Harami Cross Pattern" jaisi hai lekin aik to iss candle ka color white hoti hai, jo k "Bearish Harami Pattern" k candle main black hoti, dosra ye candle small real body ki hoti hai, jo k "Bearish Harami Cross Pattern" ki candle doji candle hoti hai, jiss ka open aur close same hota hai. Descending hawk pattern aik bearish trend reversal pattern hai, jo k prices k top par ya bullish trend main banta hai. Ye pattern bullish k kamzori ki nishan dahi karta karta hai. Dosree candle aik aik small real body wali bullish candles say hi Trad ho Jay gi The Explanation of Descending hawk pattern Dear Jab bh Descending hawk pattern two days CANDLES par mushtamil ek bearish trend reversal pattern hai, aur uptrend k baad main bhi bannta hai to us k leye First Candle Descending hawk pattern main pehle din ki candles aik long real body wali white/Green hotee hai, jo prices k uptrend ki turrjumani kartti hai. Ye candle normal size aur bullish trend k Sath ho jay giDescending hawk pattern main dosre din ki candles bhi same white ya red CANDLE Say Ho Jay gii Trading Stradgy Dear Jab bh Descending hawk pattern "Bearish Harami Pattern" aur "Bearish Harami Cross Pattern" se melta julta PATTERN hai, jo same bullish trend ko BEARISH trend me reverse kia jata hai. Descending hawk pattern two days candles par mushtamil pattern hai, jis me pehlee aik long real body wali bullish candle hote hai, jis k baad dosree aik long real body wali small bullish candle banti hai. Pehli candle prices k uptrends ki nishan-dahi kartti hai, ye candle size aur formation me normal long real body wali Bullishness candle hotti hai. Lekin dosre din ki candle aik small real body wali Bullishness candle hotee hai, jo k open aur close pehli candle k real body main hoti haiAor Descending hawk PATTERN bhi dosre bearish trend reversal patterns ki tarah sell k signals deta hai. Pattern par trading ka tareeqay kar bhi "BEARISH Harami Pattern" jaisa hai, jiss par market main sell ki entry ki jati hai. PATTERN par trading se pehle prices ka baghawar study karlen k ya to ye uptrend me honni chaheye aur ya ye high level pe hon. Pattern ki pehlee candle normal long real body wali hotti hai, jis ko dosre din ki small bullish candle follow kartti hai. Descending hawk pattern me dosre din ki candle ki formation bohut zarrori hai, jo k pehli candle k under honi chaheye, yanni candle ki open aur close dono pehli candle k open aur close se kam honi chaheye. Descending hawk Candlestick k leye Trending confirmation trade entry se pehly Say Hi Takes profit Say Entery ho Jay gi
        dle pehli candle k andar open aur close hoti hai. Descending hawk pattern ki dosri candle ki formation same "Bearish Harami PATTERN" aur "Bearish Harami Cross Pattern" jaisi hai lekin aik to iss candle ka color white hoti hai, jo k "Bearish Harami Pattern" k candle main black hoti, dosra ye candle small real body ki hoti hai, jo k "Bearish Harami Cross Pattern" ki candle doji candle hoti hai, jiss ka open aur close same hota hai. Descending hawk pattern aik bearish trend reversal pattern hai, jo k prices k top par ya bullish trend main banta hai. Ye pattern bullish k kamzori ki nishan dahi karta karta hai. Dosree candle aik aik small real body wali bullish candles say hi Trad ho Jay gi The Explanation of Descending hawk pattern Dear Jab bh Descending hawk pattern two days CANDLES par mushtamil ek bearish trend reversal pattern hai, aur uptrend k baad main bhi bannta hai to us k leye First Candle Descending hawk pattern main pehle din ki candles aik long real body wali white/Green hotee hai, jo prices k uptrend ki turrjumani kartti hai. Ye candle normal size aur bullish trend k Sath ho jay giDescending hawk pattern main dosre din ki candles bhi same white ya red CANDLE Say Ho Jay gii Trading Stradgy Dear Jab bh Descending hawk pattern "Bearish Harami Pattern" aur "Bearish Harami Cross Pattern" se melta julta PATTERN hai, jo same bullish trend ko BEARISH trend me reverse kia jata hai. Descending hawk pattern two days candles par mushtamil pattern hai, jis me pehlee aik long real body wali bullish candle hote hai, jis k baad dosree aik long real body wali small bullish candle banti hai. Pehli candle prices k uptrends ki nishan-dahi kartti hai, ye candle size aur formation me normal long real body wali Bullishness candle hotti hai. Lekin dosre din ki candle aik small real body wali Bullishness candle hotee hai, jo k open aur close pehli candle k real body main hoti haiAor Descending hawk PATTERN bhi dosre bearish trend reversal patterns ki tarah sell k signals deta hai. Pattern par trading ka tareeqay kar bhi "BEARISH Harami Pattern" jaisa hai, jiss par market main sell ki entry ki jati hai. PATTERN par trading se pehle prices ka baghawar study karlen k ya to ye uptrend me honni chaheye aur ya ye high level pe hon. Pattern ki pehlee candle normal long real body wali hotti hai, jis ko dosre din ki small bullish candle follow kartti hai. Descending hawk pattern me dosre din ki candle ki formation bohut zarrori hai, jo k pehli candle k under honi chaheye, yanni candle ki open aur close dono pehli candle k open aur close se kam honi chaheye. Descending hawk Candlestick k leye Trending confirmation trade entry se pehly Say Hi Takes profit Say Entery ho Jay gi
        • #5 Collapse

          Definition yeh patteren aik chhota sa safaid jism hai jis mein pehlay ke nisbatan lambay safaid jism hotay hain. yeh harami patteren se mushabihat rakhta hai, siwaye is ke ke dono jism safaid hain .
          • #6 Collapse

            Introduce of Bearish Descending Hawk Pattern Sir Jab bh ham Descending hawk pattern two days CANDLESTICKS par mushtamil aik bearish trend reversals pattern hai, jo k prices k top par ya Bullishness trend k akhtetam par banta hai. Pattern ki pehli aur dosri candle same Bullishness candles hoti hai jis main dosri candle pehli candle k andar open aur close hoti hai. Descending hawk pattern ki dosri candle ki formation same "BEARISH Harami PATTERNS" aur "Bearish Harami Cross Pattern" jaisi hai lekin aik to iss candle ka color white hoti hai, jo k "Bearish Harami Pattern" k candle main black hoti, dosra ye candle small real body ki hoti hai, jo k "Bearish Harami Cross Pattern" ki candle doji candle hoti hai, jiss ka open aur close same hota hai. Descending hawk pattern aik bearish trend reversal pattern hai, jo k prices k top par ya bullish Level ho Jay gy The Formation of Bearish Descending hawk pattern Sir Ess Descending hawk pattern two days CANDLES par mushtamil ek bearish trend reversal PATTERN hai, aur uptrend k baad main bhi bannta hai to us k leye First Candle Descending hawks pattern main pehle din ki CANDLES aik long real body wali white/Green hotee hai, jo prices k uptrend ki turrjumani kartti hai. Ye candle normal size aur bullish trend k Sath ho jay giDescending hawk pattern main dosre din ki candles bhi same white say jay giAb Ess Descending hawk pattern "Bearish Harami Pattern" aur "Bearish Harami Cross Pattern" se melta julta PATTERNS hai, jo same bullish trend ko BEARISH trend me reverse kia jata hai. Descending hawk pattern two days candles par mushtamil pattern hai, jis me pehlee aik long real body wali bullish candle hote hai, jis k baad dosree aik long real body wali small bullish candle banti hai. Pehli candle prices k uptrends ki nishan-dahi kartti hai, ye candle size aur formation me normal long real body wali Bullishness candle hotti hai. Lekin dosre din ki candle aik small real body wali Bullishness candle hotee hai, jo k open aur close pehli candle k real body main hoti haiAor Descending hawk PATTERNS bhi dosre bearish trend reversal PATTERNS ki tarah sell k signals deta hai. Pattern par trading ka tareeqay kar bhi "BEARISH Harami Pattern" jaisa hai, jiss par market main sell ki entry ki jati hai. PATTERN par trading se pehle prices ka baghawar study karlen k ya to ye uptrends me honni chaheye aur ya ye high level pe hon. Pattern ki pehlee candle normal long real body wali hotti hai, jis ko dosre din ki small Bullishness candle follow kartti hai. Descending hawk pattern me dosre din ki candle ki formation say hi Sath Trade le gy
            • #7 Collapse

              Sliding Falcon Example Sliding falcon design two days candles standard mushtamil aik negative pattern inversion design hai, jo k costs k top standard ya bullish pattern k akhtetam standard banta hai. Design ki pehli aur dosri candle same bullish candles hoti hai jis primary dosri candle pehli light k andar open aur close hoti hai. Diving falcon design ki dosri candle ki arrangement same "Negative Harami Example" aur "Negative Harami Cross Example" jaisi hai lekin aik to iss candle ka variety white hoti hai, jo k "Negative Harami Example" k light fundamental dark hoti, dosra ye flame little genuine body ki hoti hai, jo k "Negative Harami Cross Example" ki candle doji candle hoti hai, jiss ka open aur close same hota hai. Sliding bird of prey design aik negative pattern inversion design hai, jo k costs k top standard ya bullish pattern principal banta hai. Ye design bullish k kamzori ki nishan dahi karta hai. Dosree candle aik little genuine body wali bullish flame hoti hai jo upturn ka ikhtetaam karti hai, jiss k baad costs negative pattern inversion ka sabab banti hai. Candles Development Slipping bird of prey design two days candles standard mushtamil ek negative pattern inversion design hai, aur upswing k baad fundamental bhi bannta hai to us k leye candles ki darrjazel design honi chaheye ; 1 . First Light: Slipping bird of prey design fundamental pehle racket ki candle aik long genuine body wali white/green hotee hai, jo costs k upturn ki turrjumani kartti hai. Ye light typical size aur bullish pattern k mutabiq banti hai. 2 . Second Flame: Dropping falcon design principal dosre racket ki light bhi same white ya red candle banti hai, jo k costs k bullish pattern ka ikhtetaam kartti hai, dosre clamor ki candle pehle noise ki candle k genuine body k andar open aur close hoti hai. Explaination Plunging falcon design "Negative Harami Example" aur "Negative Harami Cross Example" se melta julta design hai, jo same bullish pattern ko negative pattern me turn around kia jata hai. Sliding bird of prey design two days candles standard mushtamil design hai, jis me pehlee aik long genuine body wali bullish flame hote hai, jis k baad dosree aik long genuine body wali little bullish candle banti hai. Pehli flame costs k upturn ki nishan-dahi kartti hai, ye candle size aur arrangement me ordinary long genuine body wali bullish candle hotti hai. Lekin dosre commotion ki flame aik little genuine body wali bullish candle hotee hai, jo k open aur close pehli candle k genuine body primary hoti hai. Design ki dono flame bullish sharpen k bawajood bhi negative pattern inversion design ka kaam karta hai. Exchanging Slipping bird of prey design bhi dosre negative pattern inversion designs ki tarah sell k signs deta hai. Design standard exchanging ka tareeqay kar bhi "Negative Harami Example" jaisa hai jiss standard market principal sell ki passage ki jati hai. Design standard exchanging se pehle costs ka baghawar study karlen k ya to ye upturn me honni chaheye aur ya ye significant level pe hon. Design ki pehlee flame typical long genuine body wali hotti hai, jis ko dosre racket ki little bullish light follow kartti hai. Plummeting bird of prey design me dosre racket ki candle ki arrangement bohut zarrori hai, jo k pehli light k under honi chaheye, yanni candle ki open aur close dono pehli candle k open aur close se kam honi chaheye. Slipping falcon Candle k leye pattern affirmation exchange passage se pehle zarrori hai, hit bhi design k baad teesre commotion ki light negative ya dark flame banne gi to ye market principal me sell se section karne ka time hoga. Stop Misfortune design k sab se greatest cost ya negative candle k top se aik ya do pips above obstruction point standard lagayen.
              • #8 Collapse


                Bearish Descending Hawk Candlestick Pattern:

                Click image for larger version

Name:	download (48).jpeg
Views:	38
Size:	10.8 کلوبائٹ
ID:	12885191


                Bearish Descending Hawk Mombatti Pattern -

                Bearish Descending Hawk Mombatti Pattern ki Pehchan:

                Bearish Descending Hawk Mombatti Pattern ek bearish reversal pattern hai jo market mein trend change ko darust karta hai. Is pattern mein do consecutive bearish candles hote hain jinmein se pehla candle lamba hota hai aur doosra candle chhota hota hai, jiska close pehle candle ke neeche hota hai.

                Bearish Descending Hawk Mombatti Pattern ka Tafsir:

                Bearish Descending Hawk Mombatti Pattern bearish reversal ko darust karta hai. Is pattern mein pehla candle bullish momentum ko darust karta hai lekin doosra candle bullish momentum ko weak kar deta hai. Doosra candle ke neeche close hone ka matlab hai ke sellers ne control ko haath mein le liya hai aur ab bearish momentum shuru hone ki sambhavna hai.

                Bearish Descending Hawk Mombatti Pattern ka Istemal:
                1. Confirmation ke Liye Intezar: Bearish Descending Hawk Mombatti Pattern ko confirm karne ke liye traders doosre technical indicators aur price action ko dekhte hain. Agar pattern ke baad ek aur bearish candle aata hai, to yeh pattern ki tasdeeq hoti hai.
                2. Entry aur Exit Points: Traders Bearish Descending Hawk Mombatti Pattern ko dekh kar apne positions ko adjust karte hain. Agar pattern confirm ho jata hai, to traders short positions lete hain ya phir existing long positions ko close kar sakte hain.
                3. Stop Loss aur Take Profit Levels: Traders apni positions ke liye sahi stop-loss aur take-profit levels tay karte hain taki nuksan kam ho aur faida zyada ho sake.

                Nateeja:

                Bearish Descending Hawk Mombatti Pattern ek bearish reversal signal hai jo market mein trend change ko indicate karta hai. Lekin, jaise ke har trading tool, is pattern ko istemal karte waqt doosre factors aur market context ko bhi mad e nazar rakha jana chahiye. Sahi tajziya aur discipline ke saath, traders is pattern ka sahi istemal karke apne trading performance ko behtar bana sakte hain.
                • #9 Collapse


                  Bearish Descending Hawk Candlestick Pattern:
                  Click image for larger version

Name:	download (60).png
Views:	14
Size:	3.9 کلوبائٹ
ID:	12885295


                  Bearish Descending Hawk Mombatti Pattern -

                  Pehchan: Bearish Descending Hawk Mombatti Pattern ek bearish reversal pattern hai jo market mein trend change ko darust karta hai. Is pattern mein do consecutive bearish candles hote hain jinmein se pehla candle lamba hota hai aur doosra candle chhota hota hai, jiska close pehle candle ke neeche hota hai.

                  Tafsir: Bearish Descending Hawk Mombatti Pattern bearish reversal ko darust karta hai. Is pattern mein pehla candle bullish momentum ko darust karta hai lekin doosra candle bullish momentum ko weak kar deta hai. Doosra candle ke neeche close hone ka matlab hai ke sellers ne control ko haath mein le liya hai aur ab bearish momentum shuru hone ki sambhavna hai.

                  Istemal:
                  1. Intezar ke Liye Confirmation: Bearish Descending Hawk Mombatti Pattern ko confirm karne ke liye traders doosre technical indicators aur price action ko dekhte hain. Agar pattern ke baad ek aur bearish candle aata hai, to yeh pattern ki tasdeeq hoti hai.
                  2. Entry aur Exit Points: Traders Bearish Descending Hawk Mombatti Pattern ko dekh kar apne positions ko adjust karte hain. Agar pattern confirm ho jata hai, to traders short positions lete hain ya phir existing long positions ko close kar sakte hain.
                  3. Stop Loss aur Take Profit Levels: Traders apni positions ke liye sahi stop-loss aur take-profit levels tay karte hain taki nuksan kam ho aur faida zyada ho sake.

                  Nateeja: Bearish Descending Hawk Mombatti Pattern ek bearish reversal signal hai jo market mein trend change ko indicate karta hai. Lekin, jaise ke har trading tool, is pattern ko istemal karte waqt doosre factors aur market context ko bhi mad e nazar rakha jana chahiye. Sahi tajziya aur discipline ke saath, traders is pattern ka sahi istemal karke apne trading performance ko behtar bana sakte hain.


                  منسلک شدہ فائلیں
                  • #10 Collapse

                    Bearish descending hawk


                    I. Introduction
                    • Aghaz (آغاز)

                    II. Understanding the Bearish Market
                    • Bears Market Ka Samajhna (بیئرز مارکیٹ کا سمجھنا)

                    III. Descending Hawk Pattern
                    • Utarta Huwa Baj Pattern (اُترتا ہوا باج پیٹرن)
                      • A. Description
                        • Tafseeli Bayan (تفصیلی بیان)
                      • B. Formation
                        • Banawat (بناوٹ)

                    Click image for larger version

Name:	images (25).png
Views:	17
Size:	1.6 کلوبائٹ
ID:	12916087
                    IV. Key Characteristics of Bearish Descending Hawk
                    • Bears ka Utarta Huwa Baj Ki Ahem Khasiyat (بیئرز کا اُترتا ہوا باج کی اہم خصوصیات)

                    V. Significance in Technical Analysis
                    • Takneeki Tajziya Mein Ahmiyat (تکنیکی تجزیہ میں اہمیت)

                    VI. How to Identify Bearish Descending Hawk
                    • Bears ka Utarta Huwa Baj Kaise Pehchanein (بیئرز کا اُترتا ہوا باج کیسے پہچانیں)

                    VII. Trading Strategies Using Bearish Descending Hawk
                    • Bears ka Utarta Huwa Baj Istemal Karke Karobar Ki Strategies (بیئرز کا اُترتا ہوا باج استعمال کرکے کاروبار کی استریٹیجیز)

                    VIII. Real-world Examples
                    • Haqeeqati Dunia Ke Usool (حقیقتی دنیا کے اصول)

                    IX. Conclusion
                    • Ikhtitam (اختتام)
                    • <a href="https://www.instaforex.org/ru/?x=ruforum">InstaForex</a>
                    • #11 Collapse

                      **Bearish Descending Hawk Pattern: Understanding and Trading**
                      **Bearish Descending Hawk** ek technical analysis pattern hai jo trend reversal aur market sentiment ki pehchaan ke liye use hota hai. Yeh pattern generally downtrend ya bearish reversal ko indicate karta hai. Is pattern ko samajhne ke liye, iske formation aur trading guidelines ko detail mein dekhenge:

                      ### **Formation of the Bearish Descending Hawk Pattern**

                      1. **Initial Trend:**
                      - Pattern ka formation ek strong uptrend ya bullish trend ke baad hota hai. Yeh initial bullish movement market mein strong buying interest ko dikhata hai.

                      2. **Pattern Formation:**
                      - **First Candlestick:** Pattern ka pehla candlestick ek strong bullish (white) candlestick hota hai. Yeh candlestick uptrend ko confirm karta hai aur market mein strong buying momentum ko show karta hai.
                      - **Second Candlestick:** Dusra candlestick ek bearish (black) candlestick hota hai jo pehle candlestick ke upar open hota hai aur close hota hai. Yeh candlestick ek downward movement ko dikhata hai, lekin yeh first candlestick ke close price ke above open hota hai.
                      - **Third Candlestick:** Teesra candlestick bhi bearish hota hai, lekin yeh dusre candlestick ke close price se lower open hota hai aur lower close hota hai. Yeh candlestick pattern ki bearishness ko aur bhi strengthen karta hai.

                      3. **Gap and Patterns:**
                      - Bearish Descending Hawk pattern ke formation mein, har candlestick ke beech gap ho sakta hai. Yeh gaps pattern ke bearish sentiment ko strengthen karte hain.

                      ### **Interpretation of the Bearish Descending Hawk Pattern**

                      1. **Bearish Reversal Signal:**
                      - Yeh pattern market ke current bullish trend ke reversal ko indicate karta hai. Pehle bullish candlestick ke baad, bearish candlesticks ka formation market mein downward pressure aur selling interest ko indicate karta hai.

                      2. **Potential Trend Reversal:**
                      - Bearish Descending Hawk pattern trend reversal ki potentiality ko show karta hai. Agar yeh pattern complete hota hai, to market me downward movement ya bearish trend ki shuruaat ho sakti hai.

                      3. **Confirmation:**
                      - Pattern ki confirmation ke liye, traders ko pattern ke baad ek additional bearish candlestick dekhna chahiye. Yeh confirmation candlestick pattern ke bearish signal ko validate karta hai aur sell positions ko consider karne mein madad karta hai.

                      ### **Trading Guidelines for Bearish Descending Hawk Pattern**

                      1. **Entry Point:**
                      - Pattern ke complete hone ke baad aur confirmation candlestick ke formation ke baad, traders sell positions open kar sakte hain. Yeh entry point bearish trend ke shuruaat ko capitalize karne ka hota hai.

                      2. **Stop-Loss and Risk Management:**
                      - Stop-loss orders ko set karna zaroori hai taake unexpected market movements se protect ho sakein. Stop-loss ko pattern ke high ke upar set karna chahiye taake losses minimize kiya ja sake.

                      3. **Profit Targets:**
                      - Profit targets ko support levels ya previous low ke around set karein. Yeh targets market ke downward movement ko capture karne aur profits lock karne mein madad karte hain.

                      4. **Volume Analysis:**
                      - Volume bhi pattern ke effectiveness ko confirm karne ke liye important hai. High volume ke sath pattern ki formation zyada significant hoti hai aur bearish trend ko strong indicate karti hai.

                      5. **Combine with Other Indicators:**
                      - Bearish Descending Hawk pattern ko dusre technical indicators ke sath combine karke use karein. Moving averages, RSI, aur MACD jese indicators pattern ki accuracy aur reliability ko enhance karte hain.

                      ### **Conclusion**

                      Bearish Descending Hawk pattern forex aur financial markets mein trend reversal aur bearish sentiment ko identify karne ke liye ek useful tool hai. Pattern ke formation aur confirmation ke zariye traders market ke downward movement ko predict kar sakte hain aur informed trading decisions le sakte hain. Effective risk management aur additional technical indicators ke sath pattern ko use karna trading strategy ko optimize karne mein madad karta hai.

                      اب آن لائن

                      Working...
                      X