Assalamu Alaikum
Dear forex member ummid krti hain sub kharyt sy hn gy or mahnat say apna work krrhy hn gy hmy kamyabi Hasil krny k ly mahnt sy kam krna hota h or hmy chye apna knowledge ko increase kry jitna zeda knowledge ho ga itna hi hm kamyab ho skty hai
dear member ajj ik or new topic kay sath aya hon jo kay bhot important h is topic ko apny complet study karna faida hasill ho ga to chlti hon ajj kay is new topic ki tarf.
Introduction
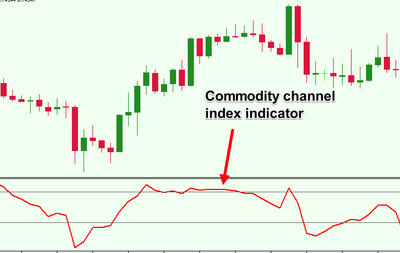
The Commodity Channel Index (CCI) measures the current price level relative to an average price level over a given period of time. CCI is relatively high when prices are far above their average. ... Using this method, CCI can be used to identify overbought and oversold levels

Explained cci
Dear forex member CCi bunyadi tor par naye rujhanaat ko dekhnay, ziyada kharidi hui aur ziyada farokht honay wali sthon ko dekhnay, aur jab isharay qeemat ke sath mukhtalif hotay hain to rujhanaat mein kamzoree ko dekhnay ke liye istemaal kya jata hai. Jab cci manfi ya sifar ke qareeb ilaqay se a hundred se oopar ki taraf jata hai, to yeh is baat ki nishandahi kar sakta hai ke qeemat aik naya oopri rujhan shuru kar rahi hai. Aik baar aisa honay ke baad, tajir qeemat mein wapsi ke liye dekh satke hain jis ke baad qeemat aur cci dono mein taizi aati hai taakay kharidari ka mauqa miley

Important points
Dear forex member Commodity Channel Index ( CCi ) aik takneeki isharay hai jo mojooda qeemat aur tareekhi ost qeemat ke darmiyan farq ko degree hai. Jab CCi sifar se oopar hai, to yeh batata hai ke qeemat tareekhi ost se ziyada hai. Is ke bar aks, jab cci sifar se neechay hota hai, qeemat tareekhi ost se kam hoti hai. Si si aayi aik laa-mehdood oscillator hai, yani yeh ghair muayana muddat tak oopar ya neechay ja sakta hai. Is wajah se, ziyada kharidi gayi aur ziyada farokht ki sthon ka taayun aam tor par har infiradi asasa ke liye tareekhi intehai cci sthon ko dekh kar kya jata hai jahan se qeemat tabdeel hoti hai .
How to trading this pattern
A basic CCI strategy is used to track the CCI for movement above +100, which generates buy signals, and movements below -100, which generates sell or short trade signals. 6 Investors may only want to take the buy signals, exit when the sell signals occur, and then re-invest when the buy signal occurs again.

Dear forex member ummid krti hain sub kharyt sy hn gy or mahnat say apna work krrhy hn gy hmy kamyabi Hasil krny k ly mahnt sy kam krna hota h or hmy chye apna knowledge ko increase kry jitna zeda knowledge ho ga itna hi hm kamyab ho skty hai
dear member ajj ik or new topic kay sath aya hon jo kay bhot important h is topic ko apny complet study karna faida hasill ho ga to chlti hon ajj kay is new topic ki tarf.
Introduction
The Commodity Channel Index (CCI) measures the current price level relative to an average price level over a given period of time. CCI is relatively high when prices are far above their average. ... Using this method, CCI can be used to identify overbought and oversold levels
Explained cci
Dear forex member CCi bunyadi tor par naye rujhanaat ko dekhnay, ziyada kharidi hui aur ziyada farokht honay wali sthon ko dekhnay, aur jab isharay qeemat ke sath mukhtalif hotay hain to rujhanaat mein kamzoree ko dekhnay ke liye istemaal kya jata hai. Jab cci manfi ya sifar ke qareeb ilaqay se a hundred se oopar ki taraf jata hai, to yeh is baat ki nishandahi kar sakta hai ke qeemat aik naya oopri rujhan shuru kar rahi hai. Aik baar aisa honay ke baad, tajir qeemat mein wapsi ke liye dekh satke hain jis ke baad qeemat aur cci dono mein taizi aati hai taakay kharidari ka mauqa miley
Important points
Dear forex member Commodity Channel Index ( CCi ) aik takneeki isharay hai jo mojooda qeemat aur tareekhi ost qeemat ke darmiyan farq ko degree hai. Jab CCi sifar se oopar hai, to yeh batata hai ke qeemat tareekhi ost se ziyada hai. Is ke bar aks, jab cci sifar se neechay hota hai, qeemat tareekhi ost se kam hoti hai. Si si aayi aik laa-mehdood oscillator hai, yani yeh ghair muayana muddat tak oopar ya neechay ja sakta hai. Is wajah se, ziyada kharidi gayi aur ziyada farokht ki sthon ka taayun aam tor par har infiradi asasa ke liye tareekhi intehai cci sthon ko dekh kar kya jata hai jahan se qeemat tabdeel hoti hai .
How to trading this pattern
A basic CCI strategy is used to track the CCI for movement above +100, which generates buy signals, and movements below -100, which generates sell or short trade signals. 6 Investors may only want to take the buy signals, exit when the sell signals occur, and then re-invest when the buy signal occurs again.
 CCI index ka calculation price ke average, average deviation aur constant factor par based hota hai. Iske calculation mein kuch steps follow kiye jate hain. Pehle step mein, ek time period select kiya jata hai, jisme price movements analyze kiye jayenge. Normal trading mein commonly 20-day period ya 14-day period istemal kiya jata hai. CCI index ka calculation formula is tarah hota hai: CCI = (Typical Price - 20-day SMA of Typical Price) / (0.015 * Mean Deviation) Yahan Typical Price price high aur low ka average hota hai. 20-day SMA of Typical Price 20-day Simple Moving Average hota hai, jisme Typical Price ke 20-day ka average calculate kiya jata hai. Mean Deviation price aur 20-day SMA ke deviation ka average hota hai. CCI index ke values positive aur negative dono ho sakti hain. Positive values overbought conditions ko indicate karte hain jab price bahut tezi se badh rahi hoti hai. Negative values oversold conditions ko indicate karte hain jab price bahut tezi se ghat rahi hoti hai. CCI index ka use trend reversal points aur extreme levels ko identify karne ke liye kiya jata hai. Jab CCI index overbought level se neeche aata hai aur negative territory mein enter karta hai, to yeh ek sell signal provide karta hai. Aur jab CCI index oversold level se upar jata hai aur positive territory mein enter karta hai, to yeh ek buy signal provide karta hai. CCI index ke saath kuch common trading strategies bhi istemal kiye jate hain. Kuch traders sirf overbought aur oversold levels par trading karte hain. Jab CCI index overbought level par hota hai, to woh sell order place karte hain, aur jab CCI index oversold level par hota hai, to woh buy order place karte hain. Lekin sirf overbought aur oversold levels par depend karna risk wala decision ho sakta hai, isliye trend aur market context ko bhi consider karna zaroori hota hai. CCI index ke saath divergence bhi observe ki jati hai. Divergence tab hoti hai jab price aur CCI index ke movements opposite directions mein hote hain. Agar price higher high bana raha hai lekin CCI index lower high bana raha hai, to yeh bearish divergence ho sakti hai, jo trend reversal ke liye indicate karti hai. Upar se ghatne wali price ke saath CCI index higher low bana raha hai, to yeh bullish divergence ho sakti hai, jo trend reversal ke liye indicate karti hai. CCI index ek versatile indicator hai, lekin iski bhi limitations hain. Iska istemal sideways markets mein kam kar sakta hai aur trending markets mein false signals bhi generate kar sakta hai. Isliye, dusre technical indicators aur price action analysis ke saath CCI index ko confirm karne ki zaroorat hoti hai.
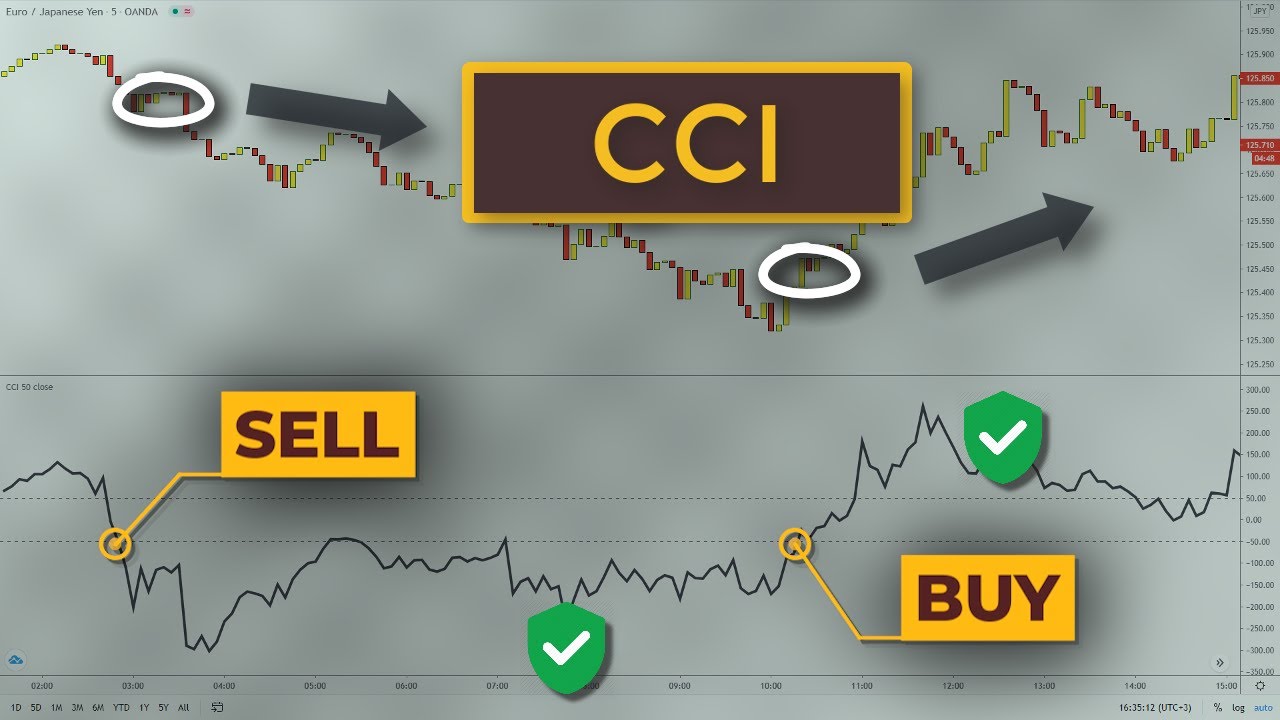

تبصرہ
Расширенный режим Обычный режим