Leading and Lagging indicators in Forex
X
  • وقت
  • دکھائیں
Clear All
new posts
  • #1 Collapse

    Leading and Lagging indicators in Forex
    Technical Indicators

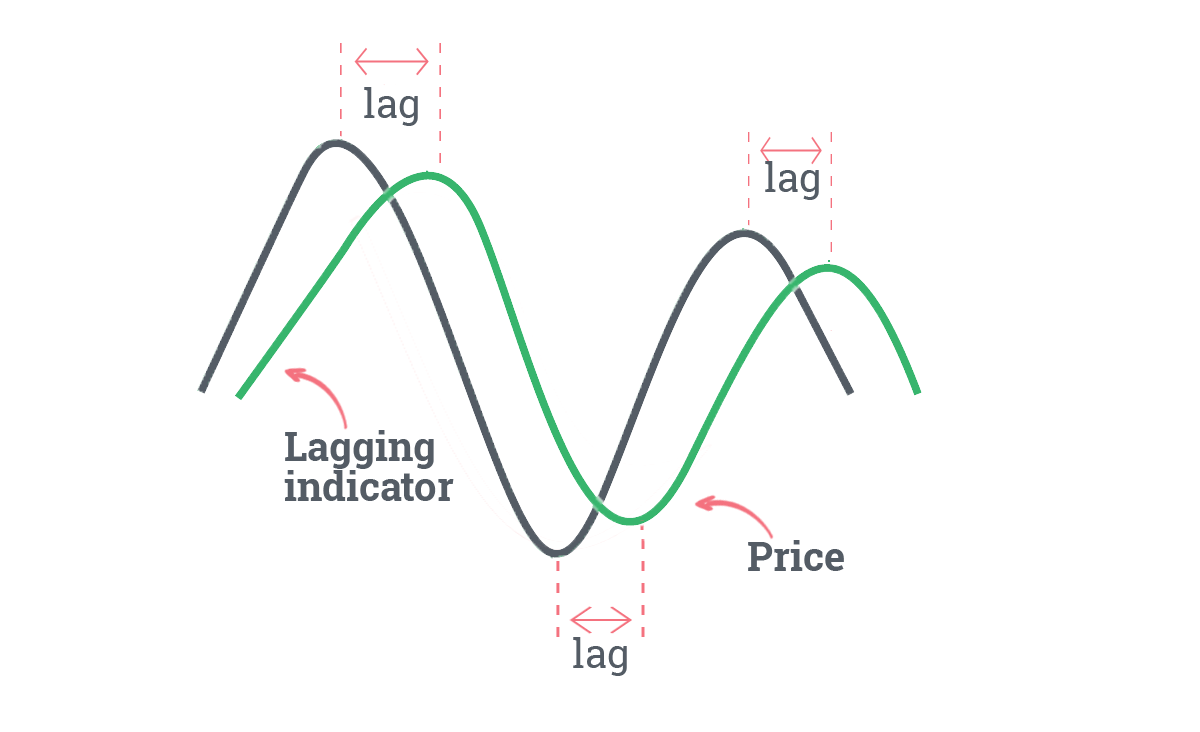
    Dear Friends, Forex me technichal indicators wo indicators hain jo trader use karty hain market analysis k laey or ye indicator signal provide karty hain using average previous price action data. technichal indicators jesa k name sy he zahir hai market ko lagg karty hain. Es ma trader signal ki verification sy pehle es ekdam ka mosahida karty hain. Es ka matlab hai k trader start ma kuch pips sy mehroom ho jaty hain. En pips ko khona bhot sy trader zaruri samajty hain or kuch trader ye samajty hain k unho ny enter hony ka moka he ganwa deya hai.

    Click image for larger version

Name:	images (6) - 2022-01-25T153244.456.jpeg
Views:	1
Size:	40.5 کلوبائٹ
ID:	12499498

    Lagging Indicators

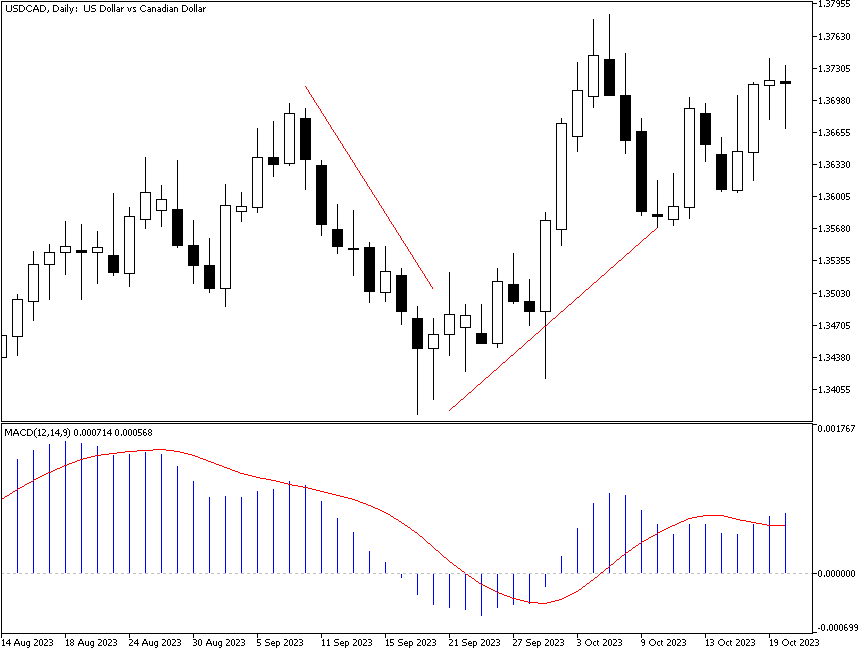
    Common lagging indicators ye hain Moving Average Convergence Divergence (MACD), Simple Moving Average (SMA), Stochastic Oscillator and Relitive Strength Index (RSI) wagera asy technical indicator hoty hain jo use karty hain previous price data or es sy forecast karty hain market ki future price movement. Ye indicators allow karty hai k trader move k start ma he market ma in ho jayn. Es ka disadvantage ye hai k trader ko us time par anticipate karna hota hai jb ye move start he ni howa hota. Es k result ma aksar wo buri jaga py ya trend reversal k time par market ma in ho jaty hain.


    Click image for larger version

Name:	images - 2022-01-25T153222.770.png
Views:	19
Size:	8.6 کلوبائٹ
ID:	12499500

    Leading Indicators

    In me Fibonacci retacement, Donchian Channels, Support and Resistance Level and Client sentiments. indicators help kar dety hain trend ki important se Koi inkar nahin kar sakta , kyun ki trend ke sath kam karne se aap ko mostly fayda hota hai aur agar aap opposite to the trend jaen ge to nuksan ki chances barh jaate Hain. Forex trading ki learning mein sab se mushkil kam yahi hota hai ki trend ko judge kaise karna hai, jis trader's ko judgement ka idea ho jata hai us ke liye trading karna bahut aasan ho jata hai. Trend hamesha calculation ki buniyad per develop hota hai aur is mein dono technical of fundamental effects ko madhya nazar rakha jata hai. Trading trend do qisam ke hote Hain ek hota hai short term trading aur dusra hota hai long term trend in donon ko follow Kiya jata hai jo bhi trend ko follow nahi kerta wo aisay businessmen jo trends ko follow ker rahey hotay hain unn say bohat peechay rehjata hai. Issi tarah yeh formula forex trading business mai bhi kaam kerta hai kiyu kay forex bhi aik business he hai bus faraq currencies aur commodities ka aur aam goods ka hai. Investment dono businesses mai hoti hai aur profit loss bhi dono businesses mai he hota hai.

    Click image for larger version

Name:	images - 2022-01-25T153227.279.png
Views:	6
Size:	13.7 کلوبائٹ
ID:	12499502
  • <a href="https://www.instaforex.org/ru/?x=ruforum">InstaForex</a>
  • #2 Collapse

    Re: Leading and Lagging indicators in Forex

    Introduction
    Dear friends forex market mein kamyabi hasil karne ke liye hamen bahut jyada hardworking karne ki jarurat hoti hai aur hamen Yahan per jab bhiDear friends forex market mein kamyabi hasil karne ke liye hamen bahut jyada hardworking karne ki jarurat hoti hai aur hamen Yahan per jab bhi kam karna hai hamen Yahan per learning complete Karke forex market mein entry leni hai jab tak Ham apni learning ko complete Nahin karna hai hamen Yahan per learning complete Karke forex market mein entry leni hai jab tak Ham apni learning ko complete Nahin karenge Ham forex market mein entry Nahin Le sakte kyunki aisa karne se hamara loss ho sakta hai to ja liye aaj ke topic per baat karte Ham forex market mein entry Nahin Le sakte kyunki aisa karne se hamara loss ho sakta hai to ja liye aaj ke topic par baat karte hain

    Use of indicator
    Dear friends forex market main Indicator ka mtlb hota hai k ishara deny wala To indicator humy Market ki movement ki confirmation deta hai. Kun k Indicator market ki differnt values ko use kr ky trend or possible Support & resistance k bary main information deta hai Is ly Indicator ko technical Analysis main use kia jta hai indicator ko 2 types hn jin ko use kia jta ha

    Two types of indicators
    1. Leading indicator
    2. Lagging indicator


    (1) Leading indicator
    Ye indicator trader trend reversal ya continuation ki probability ka Advance me btaty hn Ziada tar Indicator fixed look back period price momentum measure krty hain Commodities channel index stochastic oscillator or reletive strength index indicator mainly use hony waly leading Indicator hain Forex main leading Indicator wo Indicator hai Jo market main trend reversal or time se pehly indicate krta hai Or ye bhi information deta ha k next level per prices kis side per move krny wali hai
    Click image for larger version

Name:	Leading-Indicators-vs-Lagging-Indicators.jpg
Views:	3
Size:	25.4 کلوبائٹ
ID:	12367972

    (2) Lagging indicator

    Jab makret apna trend change kr chuki hoti hai Ye Indicator ye show krta hai k market ka trend start ho chuka hai or hum ny ye miss kr dia hai Lagging Indicator market k long trend main bahut helpful hoty hain But agr hum bad main b entry lety hain to humy kuch sy kuch profit ho jata hai. Is Indicator ka ek disadvantage hota hai k ye market main advance main market ki prices k bary main inform ni krta hai
    Click image for larger version

Name:	kh-leading-lagging-indicators-in-safety_01.png
Views:	5
Size:	51.6 کلوبائٹ
ID:	12367973

    Dear friend agar aap in indicators ka istemal Apne analysis ke dauran karte hain to Iske acche effects aapko profitable trading Ki Surat Mein zaroor Milte Hain lekin agar aap in indicators ki learning per Koi focus Nahin Karte, aur na hi inke mutabik apni working karte hain to aapko uska Achcha advantage Bhi Nahin Mil pata
    • #3 Collapse

      Trading mein leading aur lagging indicators do ahem tools hain jo traders ko market trends aur price movements ko analyze karne mein madad karte hain. In indicators ka istemaal traders ko informed decisions lene aur profitable trading opportunities identify karne mein bohot madadgar hota hai.

      Leading Indicators

      Definition aur Basic Understanding
      Leading indicators wo tools hain jo future price movements aur market trends ko predict karte hain. Yeh indicators traders ko pehle se hi signal dete hain ke market kis direction mein move karne wala hai, jis se unhein early entry aur exit points identify karne mein madad milti hai.

      Common Leading Indicators
      1. Relative Strength Index (RSI): RSI ek momentum oscillator hai jo price movements ki speed aur change ko measure karta hai. Yeh indicator 0 se 100 tak scale par hota hai. Jab RSI 70 se zyada hota hai, to market overbought condition mein hota hai aur price gir sakti hai. Jab RSI 30 se niche hota hai, to market oversold condition mein hota hai aur price barh sakti hai.
      2. Stochastic Oscillator: Stochastic Oscillator bhi ek momentum indicator hai jo closing price ko ek specific time period ke high aur low se compare karta hai. Yeh 0 se 100 tak scale par hota hai. Jab Stochastic Oscillator 80 se zyada hota hai, to market overbought condition mein hota hai. Jab yeh 20 se niche hota hai, to market oversold condition mein hota hai.
      3. Moving Average Convergence Divergence (MACD): MACD ek trend-following momentum indicator hai jo do moving averages ka difference calculate karta hai. MACD signal line ke sath crossover ke zariye buy aur sell signals generate karta hai. Positive crossover (MACD line signal line ko upar cross kare) buy signal hota hai aur negative crossover (MACD line signal line ko niche cross kare) sell signal hota hai.
      4. Bollinger Bands: Bollinger Bands price volatility ko measure karte hain. Yeh indicator do standard deviations ka band form karta hai jo moving average ke around hota hai. Jab price upper band ke qareeb hoti hai, to market overbought condition mein hota hai. Jab price lower band ke qareeb hoti hai, to market oversold condition mein hota hai.


      Advantages of Leading Indicators
      1. Early Signals: Leading indicators traders ko market trends aur reversals ke early signals dete hain, jo unhein timely entry aur exit points identify karne mein madadgar hote hain.
      2. High Reward Potential: Early entry points ki wajah se, leading indicators high reward potential offer karte hain kyunki traders market movements ke initial stages mein positions enter kar sakte hain.
      3. Risk Management: Leading indicators effective risk management ke liye useful hote hain kyunki yeh traders ko overbought aur oversold conditions ke signals dete hain, jo unhein potential reversals ke liye prepare karte hain.
      Disadvantages of Leading Indicators
      1. False Signals: Leading indicators aksar false signals generate karte hain jo traders ko misleading aur potentially unprofitable positions enter karne par majboor karte hain.
      2. Complexity: Leading indicators ka analysis aur interpretation complex ho sakta hai, khaaskar beginners ke liye. Proper understanding aur experience zaroori hota hai taake in indicators ko effectively use kiya ja sake.
      Lagging Indicators

      Definition aur Basic Understanding
      Lagging indicators wo tools hain jo past price movements aur market trends ko confirm karte hain. Yeh indicators traders ko market ke trend ko follow karne aur confirmation ke signals provide karte hain, jo unhein trend ke continuation ko capitalize karne mein madadgar hote hain.

      Common Lagging Indicators
      1. Moving Averages: Moving averages price data ko smooth karte hain aur overall market trend ko identify karne mein madadgar hote hain. Simple Moving Average (SMA) aur Exponential Moving Average (EMA) do common types hain. Moving average crossovers buy aur sell signals generate karte hain.
      2. Moving Average Convergence Divergence (MACD): Jabke MACD ek leading indicator ke taur par bhi use hota hai, yeh ek lagging indicator ke taur par bhi kaam karta hai. Yeh trend ke continuation aur strength ko confirm karne mein madadgar hota hai.
      3. Average Directional Index (ADX): ADX ek trend strength indicator hai jo trend ki strength ko measure karta hai. Yeh 0 se 100 tak scale par hota hai. ADX value 25 se upar hone ka matlab hai ke trend strong hai, aur 25 se niche hone ka matlab hai ke trend weak hai.
      4. Parabolic SAR (Stop and Reverse): Parabolic SAR ek trend-following indicator hai jo potential reversal points ko identify karta hai. Yeh indicator price ke upar aur niche dots plot karta hai jo trend direction ko indicate karte hain. Jab dots price ke niche hoti hain, to uptrend hota hai. Jab dots price ke upar hoti hain, to downtrend hota hai.
      Advantages of Lagging Indicators
      1. Trend Confirmation: Lagging indicators trend confirmation provide karte hain, jo traders ko high probability trading opportunities identify karne mein madadgar hote hain.
      2. Reduced False Signals: Lagging indicators ki nature ki wajah se, yeh false signals ko filter karne mein madadgar hote hain, jo traders ko more reliable trading signals provide karte hain.
      3. Ease of Use: Lagging indicators comparatively simple hote hain aur beginners ke liye bhi easy to use aur interpret karne mein madadgar hote hain.
      Disadvantages of Lagging Indicators
      1. Delayed Signals: Lagging indicators delayed signals generate karte hain kyunki yeh past price movements par base karte hain. Yeh traders ko late entry aur exit points provide kar sakte hain, jo potential profits ko reduce karte hain.
      2. Limited Early Warning: Lagging indicators market reversals aur sudden price movements ke early warnings provide nahi karte, jo high risk aur potential losses ka sabab ban sakte hain.
      Leading aur Lagging Indicators Ka Combination
      Trading mein leading aur lagging indicators ka combination effective strategies develop karne ke liye nihayat zaroori hota hai. Yeh combination traders ko early signals aur trend confirmation dono provide karta hai, jo overall trading performance ko enhance karta hai.

      Combining RSI aur Moving Averages
      1. RSI for Early Signals: RSI leading indicator ke taur par overbought aur oversold conditions identify karne mein madad karta hai. Jab RSI 70 se upar hota hai, to market overbought hai aur price gir sakti hai. Jab RSI 30 se niche hota hai, to market oversold hai aur price barh sakti hai.
      2. Moving Averages for Trend Confirmation: Moving averages lagging indicator ke taur par trend ko confirm karte hain. Agar 50-day SMA 200-day SMA ko upar cross karta hai, to yeh uptrend ka confirmation hota hai. Agar 50-day SMA 200-day SMA ko niche cross karta hai, to yeh downtrend ka confirmation hota hai.
      Combining MACD aur ADX
      1. MACD for Momentum Signals: MACD leading indicator ke taur par buy aur sell signals generate karta hai jab MACD line signal line ko cross karti hai. Positive crossover buy signal aur negative crossover sell signal hota hai.
      2. ADX for Trend Strength Confirmation: ADX lagging indicator ke taur par trend ki strength ko measure karta hai. ADX value 25 se upar hone ka matlab hai ke trend strong hai, jo MACD ke signals ko confirm karne mein madadgar hota hai.


      Practical Examples of Leading aur Lagging Indicators
      Forex trading mein leading aur lagging indicators ka combination bohot effective hota hai. Suppose ek trader EUR/USD pair trade kar raha hai aur use karta hai RSI aur Moving Averages ko.
      1. RSI Signal: Trader dekh raha hai ke RSI 70 se upar hai, jo overbought condition indicate kar raha hai. Yeh leading signal hai ke price gir sakti hai.
      2. Moving Average Crossover: Trader wait kar raha hai ke 50-day SMA 200-day SMA ko niche cross kare taake downtrend ka confirmation mil sake. Jab crossover hota hai, trader short position enter karta hai.
      3. MACD Signal: Trader dekh raha hai ke MACD line signal line ko upar cross kar rahi hai, jo buy signal generate kar raha hai. Yeh leading signal hai ke price barh sakti hai.
      4. ADX Confirmation: Trader check kar raha hai ke ADX value 25 se upar hai, jo strong trend indicate kar raha hai. Jab confirmation milta hai, trader long position enter karta hai.
      Leading aur lagging indicators trading mein bohot ahem tools hain jo traders ko market trends aur price movements ko analyze karne mein madad karte hain. Leading indicators future price movements ko predict karte hain aur early signals provide karte hain, jabke lagging indicators past price movements ko confirm karte hain aur trend continuation ke signals dete hain. Dono types ke indicators ka combination effective trading strategies develop karne aur profitable opportunities capitalize karne mein madadgar hota hai. Proper understanding aur use of these indicators traders ko informed decisions lene aur overall trading performance ko enhance karne mein bohot madadgar hote hain.

      ​​​​​​​
      Believe in yourself and your abilities. When you fight for your dreams, you can achieve anything.
      • #4 Collapse

        **Forex Mein Leading Aur Lagging Indicators: Kya Hai Aur Kaise Use Karein?**
        Forex trading mein indicators market analysis aur trading decisions ko enhance karne mein madad karte hain. Indicators ko broadly do categories mein divide kiya ja sakta hai: leading aur lagging indicators. Dono indicators ki apni unique roles aur benefits hain. Aaiye, dekhte hain ke leading aur lagging indicators kya hain aur inko forex trading mein kaise use kiya jata hai.

        **Leading Indicators:**

        - **Definition:** Leading indicators aise tools hain jo market ke future movements ko predict karne mein madad karte hain. Yeh indicators market trends ke changes ko early stage par identify karte hain, isliye traders ko potential entry aur exit points ko samajhne mein madad milti hai.

        - **Examples:**
        - **Relative Strength Index (RSI):** RSI ek momentum oscillator hai jo overbought aur oversold conditions ko identify karta hai. Agar RSI value 70 se upar hoti hai, to market overbought consider kiya jata hai, aur agar 30 se neeche hoti hai, to oversold consider kiya jata hai.
        - **Stochastic Oscillator:** Yeh indicator bhi overbought aur oversold conditions ko detect karta hai. Stochastic oscillator price momentum ko measure karta hai aur potential reversals ko predict karne mein madad karta hai.
        - **Moving Average Convergence Divergence (MACD):** MACD bhi ek leading indicator hai jo market momentum aur trend changes ko identify karta hai. MACD line aur signal line ke crossovers se trading signals milte hain.

        **Lagging Indicators:**

        - **Definition:** Lagging indicators market trends ke changes ko confirm karne mein madad karte hain. Yeh indicators past price movements aur data par based hote hain aur trends ke changes ko late stage par identify karte hain.

        - **Examples:**
        - **Moving Averages:** Simple Moving Average (SMA) aur Exponential Moving Average (EMA) lagging indicators hain jo market ke past price movements ko average karte hain. Moving averages trends ko smooth karte hain aur trend-following signals provide karte hain.
        - **Average True Range (ATR):** ATR volatility indicator hai jo market ke volatility ko measure karta hai. Yeh indicator trend ke strength ko confirm karne aur risk management mein madad karta hai.
        - **Bollinger Bands:** Bollinger Bands market volatility aur price levels ke extremes ko identify karte hain. Price bands ke breakouts trend confirmations ke signals provide karte hain.

        **Indicators Ka Use Kaise Karein:**

        1. **Combination Approach:** Leading aur lagging indicators ko combine karke trading decisions le sakte hain. Leading indicators potential market changes ko predict karte hain, jabke lagging indicators trends ko confirm karte hain.

        2. **Confirmations Aur Signals:** Leading indicators ke signals ko lagging indicators ke confirmation ke saath validate karna chahiye. Yeh approach trading signals ke accuracy ko enhance karti hai aur false signals se bachati hai.

        3. **Market Conditions:** Indicators ko market conditions ke hisaab se adjust karna zaroori hai. Har indicator ki effectiveness different market conditions mein vary kar sakti hai.

        **Conclusion:**

        Forex trading mein leading aur lagging indicators market analysis aur trading decisions ko improve karne mein madad karte hain. Leading indicators future price movements ko predict karte hain, jabke lagging indicators trends ko confirm karte hain. Effective trading strategies mein in indicators ka combination aur market conditions ke hisaab se use karke, traders better trading decisions le sakte hain aur apni trading success ko enhance kar sakte hain. Regular practice aur analysis se in indicators ko effectively use kiya ja sakta hai.
        • #5 Collapse

          ### Support Par Kharidari Aur Resistance Par Bechna
          Forex trading mein "Support" aur "Resistance" levels ki pehchaan aur in levels par trading decisions lena ek effective strategy hai. Support aur resistance levels market ke critical points hote hain jahan price direction change ho sakti hai. Is post mein hum samjhenge ke support aur resistance levels kya hote hain aur kyun buy at support aur sell at resistance ek successful trading strategy ban sakti hai.

          **1. Support Aur Resistance Levels Kya Hain:**

          **a. Support Level:**
          Support level wo price point hai jahan ek downtrend ke doran market ki price rukti hai aur bounce back karti hai. Is point par demand zyada hoti hai aur sellers se buyers zyada hote hain. Jab price is level tak pahunchtay hai, toh buyers market ko support karte hain aur price upar jati hai.

          **b. Resistance Level:**
          Resistance level wo price point hai jahan ek uptrend ke doran market ki price rukh jati hai aur girti hai. Is level par supply zyada hoti hai aur buyers se sellers zyada hote hain. Jab price is level tak pahunchtay hai, toh sellers market ko resist karte hain aur price neeche aati hai.

          **2. Buy at Support:**

          **a. Entry Point:**
          Support level par buy karna ek popular strategy hai. Jab price support level tak pahunchtay hai aur wahan bounce karti hai, toh yeh signal hota hai ke market ka downtrend reverse ho raha hai. Traders is point par buy orders place karte hain, expecting ke price upar jayegi.

          **b. Risk Management:**
          Support level par buy karte waqt, stop-loss orders ko support level ke niche place karna chahiye. Yeh aapko unexpected price movements ke against protect karta hai aur potential losses ko limit karta hai.

          **c. Confirmation:**
          Buy signals ko confirm karne ke liye technical indicators, jaise Moving Averages ya RSI, ka use bhi kiya ja sakta hai. Yeh indicators support level par buy signal ko strengthen karte hain aur decision-making ko support karte hain.

          **3. Sell at Resistance:**

          **a. Entry Point:**
          Resistance level par sell karna ek effective strategy hai. Jab price resistance level tak pahunchtay hai aur wahan se reverse hoti hai, toh yeh signal hota hai ke market ka uptrend reverse ho raha hai. Traders is point par sell orders place karte hain, expecting ke price neeche aayegi.

          **b. Risk Management:**
          Resistance level par sell karte waqt, stop-loss orders ko resistance level ke upar place karna chahiye. Yeh aapko market ke against unexpected price movements se protect karta hai aur potential losses ko control mein rakhta hai.

          **c. Confirmation:**
          Sell signals ko confirm karne ke liye bhi technical indicators ka use kiya ja sakta hai. Indicators, jaise MACD ya Bollinger Bands, resistance level par sell signal ko validate karte hain aur trading decisions ko enhance karte hain.

          **4. Importance of Support and Resistance:**

          **a. Trend Reversals:**
          Support aur resistance levels market ke trend reversals aur price corrections ko identify karne mein madad karte hain. Yeh levels key points hote hain jahan price movements change hoti hain.

          **b. Trading Opportunities:**
          Support aur resistance levels traders ko precise entry aur exit points provide karte hain. In levels par trading decisions le kar, traders apni trading strategies ko optimize kar sakte hain aur market conditions ko better utilize kar sakte hain.

          **5. Conclusion:**

          Support aur resistance levels forex trading mein important roles play karte hain. Support level par buy karna aur resistance level par sell karna ek well-established trading strategy hai jo market trends aur price movements ko effectively capitalize karne mein madad karti hai. Accurate identification aur risk management ke sath, yeh strategy trading success ko enhance kar sakti hai. Trading decisions ko confirm karne ke liye technical indicators ka use bhi zaroori hai. Effective analysis aur disciplined approach se aap in levels ko apni trading strategy mein efficiently implement kar sakte hain.
          • <a href="https://www.instaforex.org/ru/?x=ruforum">InstaForex</a>
          • #6 Collapse

            Leading and Lagging indicators in Forex

            Here is a brief overview of leading and lagging indicators in Forex in Roman Urdu:

            ### Leading Indicators
            Leading indicators signal future price movements. They help traders anticipate potential changes in the market before they actually occur. Common leading indicators include:

            1. **RSI (Relative Strength Index)**:
            - Yeh indicator market ki overbought ya oversold conditions ko measure karta hai.
            - Agar RSI 70 se upar ho, to yeh overbought signal hota hai.
            - Agar RSI 30 se neeche ho, to yeh oversold signal hota hai.

            2. **Stochastic Oscillator**:
            - Yeh indicator closing prices ko specific period ke high aur low prices ke sath compare karta hai.
            - Agar %K line %D line ko cross karey neeche se upar, to yeh buy signal hota hai.
            - Agar %K line %D line ko cross karey upar se neeche, to yeh sell signal hota hai.

            3. **MACD (Moving Average Convergence Divergence)**:
            - Yeh indicator two moving averages ke darmiyan ka difference dikhata hai.
            - Jab MACD line signal line ko neeche se cross kare, to yeh bullish signal hota hai.
            - Jab MACD line signal line ko upar se cross kare, to yeh bearish signal hota hai.

            ### Lagging Indicators
            Lagging indicators follow the price movement and confirm trends. They are useful for identifying established trends. Common lagging indicators include:

            1. **Moving Averages**:
            - Simple Moving Average (SMA) aur Exponential Moving Average (EMA) ka use hota hai.
            - Agar price moving average ke upar ho, to yeh bullish trend indicate karta hai.
            - Agar price moving average ke neeche ho, to yeh bearish trend indicate karta hai.

            2. **Bollinger Bands**:
            - Yeh indicator standard deviation aur moving average ka use karta hai.
            - Agar price upper band ko touch karey, to yeh overbought condition dikhata hai.
            - Agar price lower band ko touch karey, to yeh oversold condition dikhata hai.

            3. **Average Directional Index (ADX)**:
            - Yeh indicator trend ki strength ko measure karta hai.
            - ADX 20 se neeche ho, to trend weak hai.
            - ADX 40 se upar ho, to trend strong hai.


            اب آن لائن

            Working...
            X