Forex market mein jab ham trading karte Hain to hamen pehlay analysis krne parte hain, aur ham mostly market mein technical analysis krte hain jab ham price chart ke analysis karte hain to tab ham market men opportunity find krte hain.Trading main ap apni Strategy main indicator istemal karin bahot zyada help milti hy. Different types k indicator apko market main bahot zyada help dety hain jis sy apko trade krny main asani hoti hy. Ap demo account par practice karin aur trading experience increase karin.ham market mein indicator ki madad se market men divergence pe bhi trading kar sakte hain.
DIVERGENCE IN FOREX MARKET:
Dear technical Analysis k doran agr ap technical Analysis ka istemal karin gy to is main apko divergence dekhny koilti hain. Divergence iako kehty hain k jab market kisi bhe trend main move kar rahe hoti hy chaye wo bullish ho ya bearish apka Indicators ya Oscillator apko usk against trend show kar raha hota hy. Jesa k market Uptrend main kove ksr rahe hu aur Indicators apko downtrend show kar rahy hoty hain. Inko hidden divergence kehty hain jok Indicators ke madat sy find krty hain. Iski madat sy apko market k trend ka change hony ka idea ho jata hy aur ik achi trades milti hain.
TYPES OF DIVERGENCE:
Dear forex market main apk pass chart aur indicators k madat sy apko different types ke divergence dekhny ko milti hain jink mutabik ap trade kar sakty hain. Is main apk pass Two types k divergence hoti hain
BULLISH DIVERGENCE
BEARISH DIVERGENCE
Ye apk pass two types k divergence hain jis main ap trading kar k faida utha sakty hain.

BULLISH DIVERGENCE:
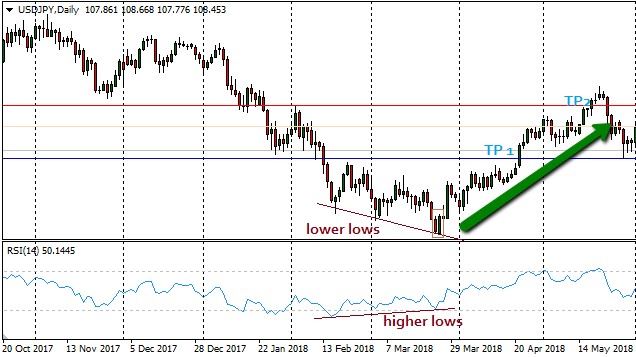
Dear jab ap analysis ko perform kar rahy hoty hain to jab bhe market ka trend down hoga aur market down side move kar rahe hoge to apka Indicators apko bullish trend show kar raha hoga. Ap agr chart par trend line lgain to market ka trend down nazar aye ga aur agr Indicators pa trend line lgain to wo Uptrend show kary ga. Bullish Divergence ko delhny k liay ap apko chart par market Lower Lows bnati dikhai dy ge jab k Indicators ya Oscillator main apko market lower high bnati hue dikhai dy ge. Is chez ko bullish Divergence kaha jata hy. Bullish divergence main apko market k uptrend ka idea ho jata hy jis main candlestick pattern aur chart patterns ko dekh kar trade kar sakty hain.
Trading with Bullish divergence:
Dear jab bhe indicator apko chart k against koi bhe indicates karta hy to us main ap bullish trend main trade kar sakty hain. Iska apko faida hota hy jis timeframe main bhe istemal karin gy iska apko faida utna he hoga. Is divergence main ap Buy ke trade find karty hain.
BEARISH DIVERGENCE:
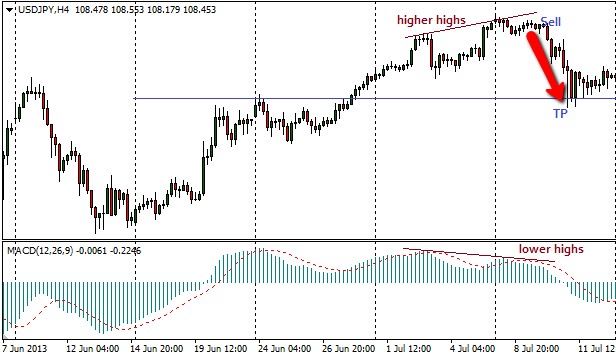
Dear jab bhe market Uptrend main movement kar rhe Hoti hy to agr ap market ka swing pakrna chaty hain to isk liay apko Indicators ka istemal karna hota hy. Divergence ko find krny k liay apko different indicator ka istemal karna hoga. Jab Indicators apko downtrend show karta hy aur market Uptrend mainove kar rahe hoti hy. Jesa k agr ap dekhain to market chart par Higher High bana rahe hoti hy aur Indicators main apk pass latest high break nahi hota. Isko bearish hidden divergence kaha jata hy. Bearish trend ko finds kia jata hy aur market main sell ke trade find indicator ke madat sy kia jata hy.
Trading with Bearish Divergence:
Dear jab market uptrend main higher high bnati hy to indicators apko higher high bnany main nakam hoty hain. To is main ap candlesticks pattern dekhty hain aur market main sell ke trade ko dekhty hain aur sell ke trade laga k market sy faida hota hy. In divergence sy apko bahot faida hota hy.
ADVANTAGES OF DIVERGENCE:
Dear is main ap dekhty hain k apko bahot zyada benefits aur apko isk advantage milty hain. Is main ap dekhty hain to market main apko achi trade milti hain. Jesy k short term k liay market ka trend agr change hota hy aur market short term k liay agr move krti hy to wo trades bhe ap indicator ke madat sy laga sakty hain. Ap different timeframe ka istemal kar k in divergence ko finds kar sakty hain aur trade kar sakty hain.
DIVERGENCE IN FOREX MARKET:
Dear technical Analysis k doran agr ap technical Analysis ka istemal karin gy to is main apko divergence dekhny koilti hain. Divergence iako kehty hain k jab market kisi bhe trend main move kar rahe hoti hy chaye wo bullish ho ya bearish apka Indicators ya Oscillator apko usk against trend show kar raha hota hy. Jesa k market Uptrend main kove ksr rahe hu aur Indicators apko downtrend show kar rahy hoty hain. Inko hidden divergence kehty hain jok Indicators ke madat sy find krty hain. Iski madat sy apko market k trend ka change hony ka idea ho jata hy aur ik achi trades milti hain.
TYPES OF DIVERGENCE:
Dear forex market main apk pass chart aur indicators k madat sy apko different types ke divergence dekhny ko milti hain jink mutabik ap trade kar sakty hain. Is main apk pass Two types k divergence hoti hain
BULLISH DIVERGENCE
BEARISH DIVERGENCE
Ye apk pass two types k divergence hain jis main ap trading kar k faida utha sakty hain.
BULLISH DIVERGENCE:
Dear jab ap analysis ko perform kar rahy hoty hain to jab bhe market ka trend down hoga aur market down side move kar rahe hoge to apka Indicators apko bullish trend show kar raha hoga. Ap agr chart par trend line lgain to market ka trend down nazar aye ga aur agr Indicators pa trend line lgain to wo Uptrend show kary ga. Bullish Divergence ko delhny k liay ap apko chart par market Lower Lows bnati dikhai dy ge jab k Indicators ya Oscillator main apko market lower high bnati hue dikhai dy ge. Is chez ko bullish Divergence kaha jata hy. Bullish divergence main apko market k uptrend ka idea ho jata hy jis main candlestick pattern aur chart patterns ko dekh kar trade kar sakty hain.
Trading with Bullish divergence:
Dear jab bhe indicator apko chart k against koi bhe indicates karta hy to us main ap bullish trend main trade kar sakty hain. Iska apko faida hota hy jis timeframe main bhe istemal karin gy iska apko faida utna he hoga. Is divergence main ap Buy ke trade find karty hain.
BEARISH DIVERGENCE:
Dear jab bhe market Uptrend main movement kar rhe Hoti hy to agr ap market ka swing pakrna chaty hain to isk liay apko Indicators ka istemal karna hota hy. Divergence ko find krny k liay apko different indicator ka istemal karna hoga. Jab Indicators apko downtrend show karta hy aur market Uptrend mainove kar rahe hoti hy. Jesa k agr ap dekhain to market chart par Higher High bana rahe hoti hy aur Indicators main apk pass latest high break nahi hota. Isko bearish hidden divergence kaha jata hy. Bearish trend ko finds kia jata hy aur market main sell ke trade find indicator ke madat sy kia jata hy.
Trading with Bearish Divergence:
Dear jab market uptrend main higher high bnati hy to indicators apko higher high bnany main nakam hoty hain. To is main ap candlesticks pattern dekhty hain aur market main sell ke trade ko dekhty hain aur sell ke trade laga k market sy faida hota hy. In divergence sy apko bahot faida hota hy.
ADVANTAGES OF DIVERGENCE:
Dear is main ap dekhty hain k apko bahot zyada benefits aur apko isk advantage milty hain. Is main ap dekhty hain to market main apko achi trade milti hain. Jesy k short term k liay market ka trend agr change hota hy aur market short term k liay agr move krti hy to wo trades bhe ap indicator ke madat sy laga sakty hain. Ap different timeframe ka istemal kar k in divergence ko finds kar sakty hain aur trade kar sakty hain.


تبصرہ
Расширенный режим Обычный режим