Falling And Rising Wedge Pattern !!!
Dear Freinds, I hope ap sab khriyt say hon gy or mehant say kam jarri rakh rahy hin gy forex member aj k topic bht important ha ap logo kay liye is liye is topic pay apko ziyda foce rakhna kamiyabi hasill kar sakty hay chalta hon apny topic ki tarf ek aisa pattren samjhna chahta hun jisko agar ap log samjh lain or kuch bhi apko forex ka na pta ho to ap sirf es ek pattren se bhi forex main earning karne k kabil ho jaen gy es pattren ko agar samjhna chahty hain to post ko pura or achey se read karen examples se samjhen to ap foec es pattren ko jiska naam hao falling wedgw and raising wedge in pattren kko seekhen or trade kren. baqi ap sb achey se trade kar k profit earn karen jis ka pako kafi faida ho ga.
Falling Wedge Pattren
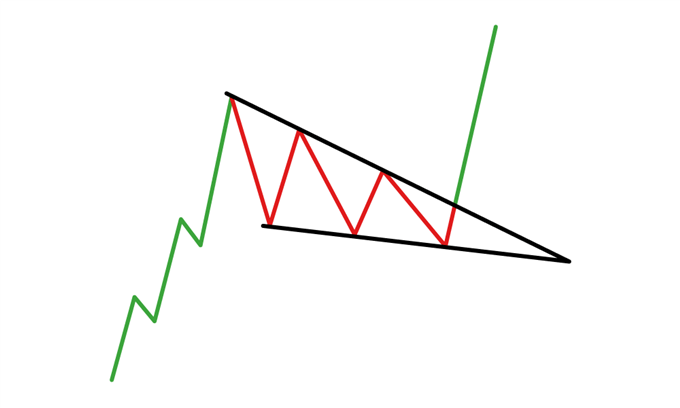
Forex member Agr hum chart main dekhe k mrket main ek trend kafi time se chal rha hai or falling wedge k banney me zaroori hai k peche trend down trend ho ya down trend neche ki traf girty hove ek level per rejection ly kr oper ki traf ek pull back karta hai yahan se pattren formation start hoti hai or agly kuch he swings main pattren mukamal ho ata hai esko ap triangle ki sahpe main daikhen gy or eska break out hamesa new trend formation hoti hai kyon k falling wedgw ek trend ki end new tred ki formation hoti hai es pattren main apke uper tren line ko ap market ki resistance or lower trend line market support ki trah ly kar mazeed agy barhti hai.falling wedge pattren ki yeh khasiyaat hai k yeh chart pattren main banta hai jahan market lower lows or lower highs bnati hai jo ke ek range main banty hain jab yeh pattren downtrend main banta hai to yeh reversal pattren mana jata hai or yeh pattren es bat ko confirm karta hai ab new trend start honey wala hai buyers ka rujhaan ziada hai(The falling wedge pattern is characterized by chart pattern which forms when the market makes lower lows and lower highs with a contracting range. When this pattern is found in a downward trend, it is considered reversal pattern, as the contraction of the range indicates the downtrend is losing steam.)falling wedge ek bullish pattren hai esi trha se esk dusra pattren raising wedge hai jisko hum bearish pattren kehte hain yeh signals maney jaty hain market main trend change honey k.

Rising Wedge Pattern:
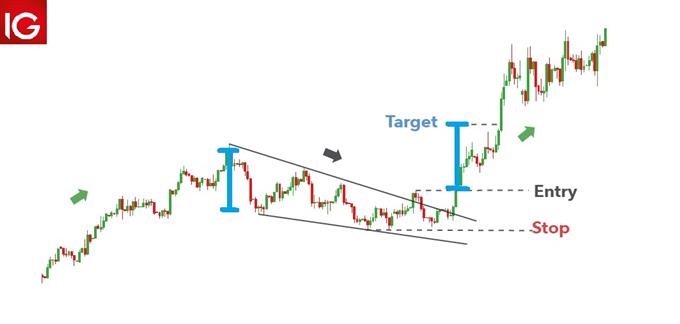
Forex member yeh pattren bhi fallig wedge k bilkul opposite hai jese k woh apko market main milta hai jahan apko downtrend nazar aye esi traha raising wedge bhi uptrend market main apko milta hai same supportor resistance es pattren main bhi milta hai market apne trend k high prices per ja kr range main movekarna start karta hai wahaan apko es baat ka andaza ho jana chahye k ab maarket main new trend staarthone wal hai buyers ka market main rujhaan kaaam hai sellers ab market maain heavy hoty ja rahe hainyahan apko support k downout per entry leni hoti hai or pattren k pehle swing k mutabiq apko apna target rakhna hota hai.

Dear Freinds, I hope ap sab khriyt say hon gy or mehant say kam jarri rakh rahy hin gy forex member aj k topic bht important ha ap logo kay liye is liye is topic pay apko ziyda foce rakhna kamiyabi hasill kar sakty hay chalta hon apny topic ki tarf ek aisa pattren samjhna chahta hun jisko agar ap log samjh lain or kuch bhi apko forex ka na pta ho to ap sirf es ek pattren se bhi forex main earning karne k kabil ho jaen gy es pattren ko agar samjhna chahty hain to post ko pura or achey se read karen examples se samjhen to ap foec es pattren ko jiska naam hao falling wedgw and raising wedge in pattren kko seekhen or trade kren. baqi ap sb achey se trade kar k profit earn karen jis ka pako kafi faida ho ga.
Falling Wedge Pattren
Forex member Agr hum chart main dekhe k mrket main ek trend kafi time se chal rha hai or falling wedge k banney me zaroori hai k peche trend down trend ho ya down trend neche ki traf girty hove ek level per rejection ly kr oper ki traf ek pull back karta hai yahan se pattren formation start hoti hai or agly kuch he swings main pattren mukamal ho ata hai esko ap triangle ki sahpe main daikhen gy or eska break out hamesa new trend formation hoti hai kyon k falling wedgw ek trend ki end new tred ki formation hoti hai es pattren main apke uper tren line ko ap market ki resistance or lower trend line market support ki trah ly kar mazeed agy barhti hai.falling wedge pattren ki yeh khasiyaat hai k yeh chart pattren main banta hai jahan market lower lows or lower highs bnati hai jo ke ek range main banty hain jab yeh pattren downtrend main banta hai to yeh reversal pattren mana jata hai or yeh pattren es bat ko confirm karta hai ab new trend start honey wala hai buyers ka rujhaan ziada hai(The falling wedge pattern is characterized by chart pattern which forms when the market makes lower lows and lower highs with a contracting range. When this pattern is found in a downward trend, it is considered reversal pattern, as the contraction of the range indicates the downtrend is losing steam.)falling wedge ek bullish pattren hai esi trha se esk dusra pattren raising wedge hai jisko hum bearish pattren kehte hain yeh signals maney jaty hain market main trend change honey k.
Rising Wedge Pattern:
Forex member yeh pattren bhi fallig wedge k bilkul opposite hai jese k woh apko market main milta hai jahan apko downtrend nazar aye esi traha raising wedge bhi uptrend market main apko milta hai same supportor resistance es pattren main bhi milta hai market apne trend k high prices per ja kr range main movekarna start karta hai wahaan apko es baat ka andaza ho jana chahye k ab maarket main new trend staarthone wal hai buyers ka market main rujhaan kaaam hai sellers ab market maain heavy hoty ja rahe hainyahan apko support k downout per entry leni hoti hai or pattren k pehle swing k mutabiq apko apna target rakhna hota hai.
تبصرہ
Расширенный режим Обычный режим