Detail understanding of stochastic indicator

No announcement yet.
`
X
  • وقت
  • دکھائیں
Clear All
new posts
  • #1 Collapse

    Detail understanding of stochastic indicator
    Dear forum members, Forex trading Mein professional traders different indicators use krty hain in main stochastic Indicator buht famous indicator hai. Is ko achi tarah study kr k ap profitable trade kr sakty hain. Yah sab say zayda use hony wala indicator hai. Aaj main apni post main stochastic Indicator k bary main important information share krna chata hoon.

    Understanding of cross over and its meaning:

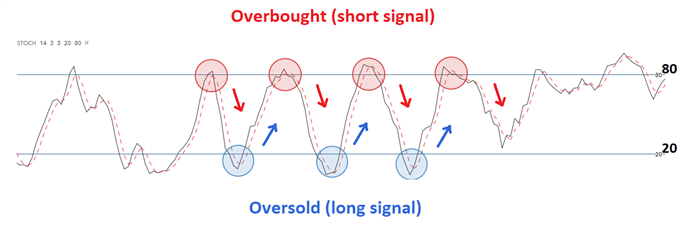
    Dear forum members, Stochastic Indicator ko ager ap use krna chaty hain aur faida Hasil krna chaty hain to os kay liye aapko hamesha red and blue line ki crossing ka intezar krna hota hai. Liken yah tabi powerful hota hai jab ya crossing level 20 and level 80 per hoti hai.

    Level 20 / oversold level:

    Dear forum members, stochastic Indicator ko metatrader 4 per use krty hain, tu sb sa phly level 20 ko samjhna zarori hota hai. Yah market ka resistance level ko show krta hai. Is point say market sell main jany k chances hoty hain.

    Level 80 / over bought level:

    Dear forum members, Level 80, stochastic Indicator main support level ko show krta hai. jis main aapko support level per buht achi opportunity milti hoti hai. Is level say market k buying opportunity daiti hai.

    Useage and importance of Stochastic Techniques:

    Dear forum friends, Forex market mein stochastic Indicator ko use krty howy ap trading krna chahty hain, tu os k liy aap ko blue and red line k crossover ko focus krna hota hai. Aur sath sath aapko level 20 and level 80 ko consider krna hota hai. Jab bhi ap 2 line 20 and 80 kay level per cross krti hain, tu time per aapko selling and buying trade entry chaiy.

    Importance of Stochastic indicator in Forex market:

    Dear forum member, Forex trading market mein stochastic Indicator sab say zayda use hony wala indicator hai aur yah buht reliable hota hai. Jo ap ko market mein successful trading karny Mai help krta hai.

    Click image for larger version

Name:	download (1).jpeg
Views:	8
Size:	14.3 کلوبائٹ
ID:	12498389
  • <a href="https://www.instaforex.org/ru/?x=ruforum">InstaForex</a>
  • #2 Collapse

    Re: Detail understanding of stochastic indicator

    Assalamualaikum Dear forum members, Forex trading Mein professional traders different indicators use krty hain in main stochastic Indicator buht famous indicator hai. Is ko achi tarah study kr k ap profitable trade kr sakty hain. Yah sab say zayda use hony wala indicator hai. Aaj main apni post main stochastic Indicator k bary main important information share krna chata hoon.
    • #3 Collapse

      Re: Detail understanding of stochastic indicator

      WHAT IS A STOCHASTIC OSCILLATOR?

      A stochastic oscillator is a momentum indicator that calculates whether the price of a security is overbought or oversold when compared to price movement over a specified period. The oscillator essentially weighs up the most recent price level as a percentage of the range (highest high – lowest low) over a defined period of time.
      HOW DOES A STOCHASTIC OSCILLATOR WORK?

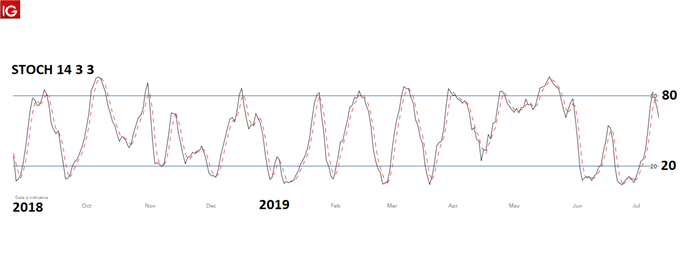
      The stochastic oscillator presents two moving lines that ‘oscillate’ between two horizontal lines. The solid black line in the image below is called the %K and is determined by a specific formula (explained later in the article), while the red dotted line is a 3-period moving average of the %K line.
      Price is shown to be ‘overbought’ when the two moving lines break above the upper horizontal line and ‘oversold’ once they break below the lower horizontal line.
      The overbought line represents price levels that fit into the top 80% of the recent price range (high – low) over a defined period – with the default period often being ‘14’. Likewise, the oversold line represents price levels that fit into the bottom 20% of the recent price range.
      Timing entries
      Furthermore, the stochastic indicator provides great insight when timing entries. When both lines are above the ‘overbought’ line (80) and the %K line crosses below the dotted %D line, this is viewed as a possible entry signal to go short and visa versa when the %K line crosses above the %D line when both lines are below the oversold line (20).
      Additionally, traders should not blindly trade based on overbought/oversold conditions alone. Traders need to understand the direction of the overall trend and filter trades accordingly. For example, when looking at the USD/SGD chart below, since the overall trend is down, traders should only look for short entry signals at overbought levels. Only when the trend reverses or a trading range is well-established, should traders look for long entries in oversold conditions.
      STOCHASTIC OSCILLATOR FORMULA

      The below calculation is presented for a 14-period stochastic indicator but ultimately, can be tailored to any desired time frame.
      Calculation for %K:
      %K = [(C – L14) / H14 -L14)] x 100
      Where:
      C = latest closing price
      L14 = Lowest low over the period
      H14 = Highest high over the period
      Calculation for %D:
      %D = simple moving average of %K (3 period simple moving average is the most common)
      PROS AND CONS OF STOCHASTIC OSCILLATORS

      Traders ought to understand where the stochastic oscillator excels and where its short-comings lie, in order to get the most out of the indicator.
      Clear entry/exit signals Can produce false signals when used incorrectly
      Signals appear frequently (depending on the selected time setting) If trading against the trend, prices can remain overbought/oversold for long periods
      • <a href="https://www.instaforex.org/ru/?x=ruforum">InstaForex</a>
      • #4 Collapse

        Re: Detail understanding of stochastic indicator

        INTRODUCTION :


        Hello friends kasa ho ap sab umeed ha ap sab thek ho ga or ap ke trading achi horahe ho ge or ap log trading karka acha profit bhi hasil kar raha ho ga or mara kuch dost abhi abhi trading start kar raha ho ga jin ko trading ka bara ma abhi kuch bhi ni pata ho ga par aj ma apna inin dosto ka sath forex trading ka kuch point share karo ga jin ko samjna ap sab ka liyaliya zarori ha q ka ya market or trading ma ak kas ahmet rakhta ha. Jo aj ka hamara topic ha os ka name stochastic indecator kiya ha or is forex ma kasa use karta ha. Agar ap na aj ka topic sai sa samaj liya toto mujha yaken ha ka ap ko trading ma kuch na kuch profit zaror ho ga to isis liya aj ka topic mara sab dosto ka liya kas hona walawala ha jo dost new ha trading ma or jo mara dost kafi time sa kar raha ha trading.


        WHAT IS STOCHASTIC INDICATOR :


        Ya stochastic indecator ak momentum indecator hota ha jis ko hum closing price sa compaire kar ta ha or market ka price range ko find karta ha jo ka ak small time period ka liya use karta ha or market ka range ko find kar lata ha. Is indecator ko use kar ka hum market ke moving average ko janta ha is sa ke madad sa huma pata chalta ha ka market na kon se side par jana ha. Ya indecator resistance ka level par kam ata ha or is par zada tar traders sell ke trade lagata ha jab market ke movement na down trend ma jana hota ha. Is ko use kar ka hum market ka buy trend or sell trend dono ko jan sakta ha phir is par achi trade ko bhi laga sakta ha.


        IMPORTANT STOCHASTIC POINTS :


        1:


        Ya stochastic indecator ak popular indecator ha jo huma market ka up trend ma jana or sell trend ma ana ka batatha. Is indecator ko use kar ka hum buy ke trade laga sakta ha or sell ke bhi.


        2:


        Ya indecator 1950 ma bana tha or ya abhi tak ka popular indecator ha is ko traders bahot pasand karta ha q ka ya kese bhi time frame ma kam kar sakta ha.


        3:


        Ya indecator resistance ka kareb or support level ka kareb signal data ha trade lagana ka is ka bad market long trend ma os traf jate ha jaha ke traf signa ya indecator data ha.


        THE FORMULA FOR STOCHASTIC :


        ​ %K=( H14−L14C−L14)×100


        where:


        C = The most recent closing price
        L14 = The lowest price traded of the 14 previous trading sessions
        H14 = The highest price traded during the same 14-day period
        %K = The current value of the stochastic indicator


        WHAT DOES STOCHASTIC INDICATOR TELL YOU:


        Ya indecator 0 sa 100 ke boundary range ka ander banta ha jo is ko ak useful indecator banate ha. Ya indicator huma buy or sell do conditions data ha is par hum sell ke trade laga sakta ha or buy ke bhi. Is indecator ko use kar ka hum 80 par sell ke trade lagata ha or buy ke close karta ha or 20 par hum buy ke trade ko enter karta ha or sell ke trade ko close karta ha ya indecator ak strong trend ko la kar move karta ha ya market ka tremd ko 80 or 20 ka level par change karta rahta ha. Is indecator ma market ak mumantum ma move kar rahe hote ha. Is indecator ko bahot sa traders pasand larta ha or is sa acha profit bhi hasel karta ha q ka is ko use karna bahot he asan ha.

        اب آن لائن

        Working...
        X