EMA strategy with forex trend
X
  • وقت
  • دکھائیں
Clear All
new posts
  • #1 Collapse

    EMA strategy with forex trend
    What is EMA trading strategy;


    EMA simple moving average ka result hey EMA aik indicator hey jo keh zyada tar charts pakg par paish kea ja sakta hey j trader ko trend kay sath sath mumkana entry or exit signal ko identify karnay kay kabel banata hey jab baat trend saze ke market ke ho to trader ko strategy kay hawallay say bohut say ekhterat hotay hein


    three step EMA trading strategy;


    zail mein EMA trading strategy aik series kay estamal kay gard ghomay ge graph bhe kese specific period kay ley price ke average ko indicate kar kay yeh SMA ko indicate karte hey EMA kay hesaab ketaab mein majodah price par zyada zoor daynay kay ley kuch gap par zor dayta hey EMA trend trading kay ley aik behtareen omeedwar hey


    Step1 find the trend in forex market;


    trend par mobne position mein enter honay kay ley trader sab say pehlay trend ke tasdeeq karne chihay zail mein EUR/USD daily ka chart hey to ghoor karen keh rader higher high bana raha hey jo keh EUR/USD pair kay upper trend aik strong hey es analysis ke tasdeeq chart par neshan zad 200EMA kay estamall say ke ja sakte hey ravaytee tor par jab trade 200EMA say up chalee jate hey t trading bullish say hote hey ager price average down rehte hey t bearish ka shekar hotay hein
    Click image for larger version

Name:	ema-trading_body_200EMA.png
Views:	1
Size:	21.2 کلوبائٹ
ID:	12488053


    Step2 EMA entries ka estamall;


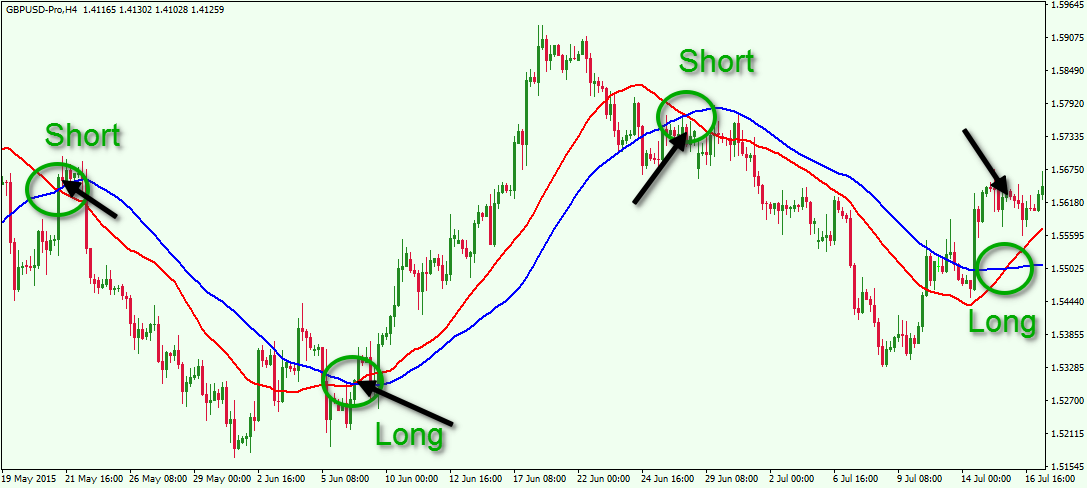
    aik bar market ke direction ko indicate karnay kay bad trader market mein enter honay kay ley EMA ke aik series kar saktay hein 12 or 26 EMA kay period ko shamell kea geya hey kun keh trader up trend mein buy hona chahtay hein es ley en area ko neshan dahe karna ho ge jahan par momentum trend direction indicate ho rehe hey EMA trader ko aik aisay area ke pehchan karnay mein help kar sakta hey jahan par short period 12 moving average or long period 26 moving average say up jate hey or es makam par trader market mein buy kar saktay hein
    EUR/USD ka chart EMA ka estamall kartay hovay trader kai mumkana buy entry k dekhata hey es action ko down trend kay ley es sorat mein sell ke movement ko nakall kar sakta hey jab 12 ke period 26 EMA say low ho jay
    Click image for larger version

Name:	ema-trading_body_entries.png
Views:	1
Size:	27.9 کلوبائٹ
ID:	12488054


    step3 EMA ko exit position ko estamall karnay kay ley ke jate hey


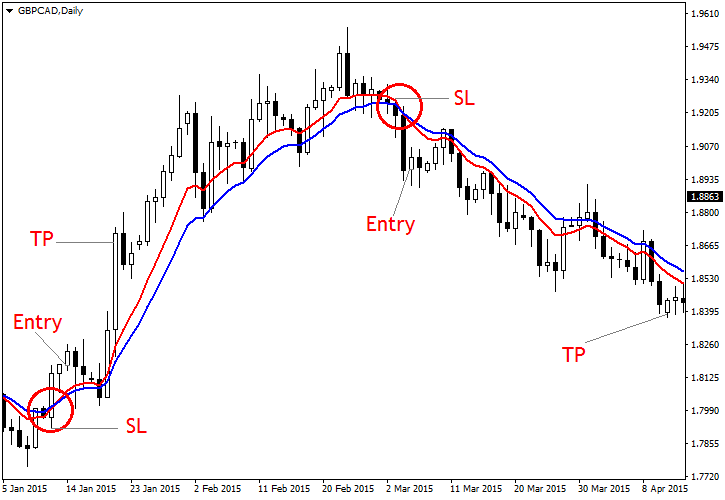
    ab jab keh trade ka akhaz ho choka hey trader ko yeh identify karnay ke zaroorat hote hey keh market say exit karnay ka wakt kab ho ga yeh aik kamyaab strategy ka step no 3 hey trader apni trading ke zaroorat k pora karnay kay ley yahan par mokhtalef kesam kay stop loss or risk reward ke rati ko chose karta hey tahum EMA ko trade exit karnay kay ley bhe estamal kea ja sakta hey trade bullish ke raftar mein wapcee par buy kartay hein or 12 period EMA ko touch karte hey to trader ko position ko close karna chihay
    trend mein trade kartay wakt stop bhe lagay janay chihay aik asaan tareka yeh hey keh graph par higher highs swing kay down mein stop lagain es tarah ager trend badal jata hey to kese bhe position ko loss kay ley jald az jald exit kea ja sakta hey jaisa keh nechay dey gay chart mein dekhaya geya hey
    Click image for larger version

Name:	ema-trading_body_exits.png
Views:	1
Size:	16.9 کلوبائٹ
ID:	12488055
    دیتے جائیںThanksحوصلہ افزائی کے لیے
  • <a href="https://www.instaforex.org/ru/?x=ruforum">InstaForex</a>
  • #2 Collapse

    Re: EMA strategy with forex trend

    Exponential Moving Average (EMA)

    Dear Friend, exponential moving average aik technical indicator ha jis ko Patrick Mulloy na develop kia, is ma hm 2 exponential moving averages ko use kartay hain, ye price changes par quick responce daita ha jis ka mtlab ye ha k day traders aur swing traders in sa acha faida hasil kar saktay hain, is indicator k zariay hm price ki uptrend aur downtrend ma strength ko b maloom kar saktay hain, ye hmain support aur resistance k baray ma b achi infirmatiin daita ha,

    Click image for larger version

Name:	images - 2021-12-24T133828.503.jpeg
Views:	10
Size:	30.8 کلوبائٹ
ID:	12355646

    Working Mathod of EMA

    Exponential Moving Average indicator range bounded markets ki bjay trending markets ma behtar results faraham kartay hain, is ma crossover signals bht commonly use hotay hain jis ma hmain exponential moving average ki line ko price bars sa cross karnay ka wait karna parta ha, ya short term EMA ko long term EMA ki crossing par depend karna parta ha jis sa trend ma change zahir hoti ha, ye crossovers normal EMA's sa jaldi respond kartay hain, jis sa hmain trend reversal ka jaldi pata chal jata ha, isko hm dusray signals ya anaylisis techniques k sath combine kar k yse karnay sa achay results hasil kar saktay hain,

    Click image for larger version

Name:	images (1) - 2021-12-24T133835.676.png
Views:	12
Size:	19.8 کلوبائٹ
ID:	12355647

    Average Calculation

    Exponential Moving Average ki calculation k liay hmain pehlay step ma simple moving average maloom karna parta ha, 2nd step ma exponential moving average find kartay hain aur final step ma hasil shuda exponential moving average ko 2 sa multiply kar k us ma sa smooth moving average ko minus kar daitay hain, EMA divergence ko b identify karnay ma helpfull ha ye Hull moving average k similar ha, jb b 2 EMA crossover kartay hain prices ki moment reverse ho jati ha.

    Click image for larger version

Name:	images - 2021-12-24T133841.754.jpeg
Views:	2
Size:	32.2 کلوبائٹ
ID:	12355648

    Analysis Using Exponential Moving Average

    Trader or investor EMA ko market analysis k lae use karty hain. Moving average ko widely technical analysis tool ki sorat ma use kiya jata hai. Ye technique market k long term trend ko find or analyze karny k lae use kiya jata hai. Agr moving average ko observe kiya jae to ye lagging indicator hai. Ye market ka bhot quicker or responseable indicator hai. DEMA investor or trader ko long term trend ko find karny ma help karty hain. Bhot sary tradet DEMA ko use karty hain market reversal ko find karny ma b help karta hai. So eski help sy he trader ko buying or selling oppertunities mel jati hai. Trader ko but kisi b strategy ko blindly follow ni karna chahe balky esk sath apna experience b use karna chahe. Kiu k market ki state bhot complex hoti hai or ye kisi b indicator ko ya strategy ko 100 percent follow ni karti balky ye hae move ma new spots ko pick karti hai or trader wo he es ma kamyab ho sakta hai jis k pass experience acha ho. Jis trader k pass acha experience ni ho ga wo market ma bhot suffer kary ga. Kiu k experience usko market sy deal karny ma bhot help karta hai. Trader ko loss ho ya profit wo apni experience sy better account management kar sakta hai.

    Click image for larger version

Name:	images (1) - 2021-12-24T133823.792.png
Views:	5
Size:	22.2 کلوبائٹ
ID:	12355649
    There is always light. If only we're brave enough to see it. If only we're brave enough to be it.
    • #3 Collapse

      Forex market dunya ki sab se bari aur sab se zyada liquid market hai. Har roz trillions of dollars ka kaam hota hai is market mein. Traders is market mein mukhtalif strategies ka istemal karte hain taake woh profit kama saken. In strategies mein se aik bht effective strategy jo forex market mein use hoti hai, woh hai Exponential Moving Average (EMA) strategy. Exponential Moving Average (EMA) aik technical analysis tool hai jo price action ko smooth karne mein madad deta hai aur recent price data ko zyada weight deta hai. Yeh Moving Average (MA) ki aik form hai, lekin simple moving average (SMA) ke muqable mein, EMA recent prices ko zyada importance deta hai, jo isay market ki recent movement ka behtar indicator banata hai.


      EMA Strategy Ka Basic Concept
      EMA strategy ka basic concept yeh hai ke aap trend ko identify karein aur uske sath trade karein. Trend ko identify karne ke liye, multiple EMAs ka istemal kiya jata hai. Generally, short-term EMA aur long-term EMA ko compare kiya jata hai. Jab short-term EMA long-term EMA ko cross kare upar ki taraf, to yeh bullish trend ka signal hota hai. Aur jab short-term EMA long-term EMA ko cross kare neeche ki taraf, to yeh bearish trend ka signal hota hai.

      EMA Strategy Ko Forex Trend
      EMA strategy ko forex trend ke sath istemal karne ke liye, pehle humein yeh samajhna hoga ke trend kya hai. Forex market mein trend do tareeqon se ho sakta hai:
      1. Uptrend (bullish)
      2. Downtrend (bearish)
      Uptrend (Bullish Trend): Jab market ki prices continuously upper direction mein move kar rahi hoti hain, to yeh uptrend hota hai.

      Downtrend (Bearish Trend): Jab market ki prices continuously lower direction mein move kar rahi hoti hain, to yeh downtrend hota hai.
      EMA strategy ka istemal karne ke liye, aap ko short-term EMA (e.g., 10-period EMA) aur long-term EMA (e.g., 50-period EMA) ko chart par plot karna hoga.

      Step-by-Step EMA Strategy
      1. EMAs Ko Chart Par Plot Karein:
        • Apni trading platform ko kholen aur jismein aap trade karte hain uska chart open karein.
        • Chart par 10-period EMA aur 50-period EMA ko plot karein.
      2. Trend Identify Karein:
        • Jab 10-period EMA 50-period EMA ko cross kare upper direction mein, to yeh bullish trend ka signal hota hai.
        • Jab 10-period EMA 50-period EMA ko cross kare neeche ki taraf, to yeh bearish trend ka signal hota hai.
      3. Entry Signal:
        • Bullish Trend (Buy Signal): Jab 10-period EMA 50-period EMA ko neeche se cross karke upper direction mein jaye, to yeh buy signal hai.
        • Bearish Trend (Sell Signal): Jab 10-period EMA 50-period EMA ko upar se cross karke neeche ki taraf jaye, to yeh sell signal hai.
      4. Stop Loss aur Take Profit:
        • Stop Loss: Apni risk management ko madde nazar rakhte hue, stop loss ko recent swing low (bullish trend) ya swing high (bearish trend) par set karein.
        • Take Profit: Apni strategy aur market conditions ke mutabiq take profit levels ko define karein. Aap recent support/resistance levels ko take profit points ke tor par use kar sakte hain.
      5. Trade Manage Karein:
        • Jab tak EMA crossover ka trend maintain rahe, tab tak apni trade ko hold karein.
        • Jab short-term EMA long-term EMA ko wapas cross kare aur trend opposite direction mein move karne lage, to apni trade ko close kar dein.
      EMA Strategy Ki Tafseelat

      Bullish Trend
      Aapne 10-period EMA aur 50-period EMA ko plot kiya hua hai. Aik waqt par, aap dekhte hain ke 10-period EMA ne 50-period EMA ko neeche se cross kiya aur upar ki taraf move kar raha hai. Yeh bullish trend ka signal hai. Aap is waqt buy order place karte hain. Apni risk management ko madde nazar rakhte hue, aap apna stop loss recent swing low par set karte hain. Aap apna take profit recent resistance level par set karte hain. Jab tak 10-period EMA 50-period EMA ke upar rahe, aap apni trade ko hold karte hain. Jab aap dekhte hain ke 10-period EMA wapas neeche ki taraf move kar raha hai aur 50-period EMA ko cross kar raha hai, aap apni trade ko close karte hain.

      Bearish Trend
      Aap 10-period EMA aur 50-period EMA ko plot karte hain. Aik waqt par, aap dekhte hain ke 10-period EMA ne 50-period EMA ko upar se cross kiya aur neeche ki taraf move kar raha hai. Yeh bearish trend ka signal hai. Aap is waqt sell order place karte hain. Apni risk management ko madde nazar rakhte hue, aap apna stop loss recent swing high par set karte hain. Aap apna take profit recent support level par set karte hain. Jab tak 10-period EMA 50-period EMA ke neeche rahe, aap apni trade ko hold karte hain. Jab aap dekhte hain ke 10-period EMA wapas upar ki taraf move kar raha hai aur 50-period EMA ko cross kar raha hai, aap apni trade ko close karte hain.

      EMA Strategy Ke Fayde
      • Asaani: EMA strategy ko samajhna aur use karna asaan hai, khas tor par beginners ke liye.
      • Trend Identification: EMA strategy aapko market ka trend identify karne mein madad deti hai.
      • Flexibility: EMA ko kisi bhi time frame mein use kiya ja sakta hai, chahe woh 1-minute chart ho ya daily chart.
      • Early Signals: EMA strategy aapko early signals provide karti hai jo aapko trend ke start mein entry dene mein madadgar hoti hai.
      EMA Strategy Ke Nuqsanat
      • False Signals: EMA crossover strategies false signals generate kar sakti hain, khas tor par jab market sideways ho.
      • Lagging Indicator: EMA aik lagging indicator hai, matlab yeh past price data par base karta hai. Isliye, kabhi kabhi signals thode late milte hain.
      • Whipsaws: Short-term fluctuations ki wajah se whipsaws ho sakte hain jahan crossovers frequently hote hain, jisse losses ho sakte hain.
      EMA Strategy Ko Behtar Banane Ke Liye Tips
      1. Multiple Time Frames:
        • Multiple time frames ka istemal karein taake aapko broader perspective mil sake. Agar aap short-term trading kar rahe hain to higher time frame trends ko bhi analyze karein.
      2. Confluence with Other Indicators:
        • EMA strategy ko doosre indicators ke sath combine karein jaise ke RSI, MACD ya Fibonacci retracement levels taake aapko zyada confirmation mile.
      3. Risk Management:
        • Proper risk management ko follow karein. Har trade mein apna risk define karein aur usay strictly follow karein.
      4. Backtesting:
        • EMA strategy ko historical data par backtest karein taake aap uski effectiveness ko check kar saken. Yeh aapko real trading environment mein confidence dene mein madadgar hoga.
      5. News and Events:
        • Forex market par economic news aur events ka bht asar hota hai. Important news releases ko track karein aur uske mutabiq apni trading strategy ko adjust karein.


      EMA strategy forex trading mein aik simple aur effective method hai jo traders ko market ka trend identify karne aur profitable trades execute karne mein madad deti hai. Lekin yeh zaroori hai ke is strategy ko use karte waqt risk management aur doosre confirmatory indicators ka bhi khayal rakha jaye. Is tarah se, aap apne trading results ko improve kar sakte hain aur market ke movements se profit kama sakte hain. Forex trading mein consistency aur discipline bht zaroori hai. EMA strategy ko effectively use karne ke liye practice aur patience ki zaroorat hoti hai. Aap apni knowledge ko improve karte rahen, market ki dynamics ko samajhte rahen aur apni strategy ko refine karte rahen taake aap successful trader ban saken.
      Believe in yourself and your abilities. When you fight for your dreams, you can achieve anything.
      • #4 Collapse

        EMA Strategy with Forex Trend

        Forex trading aik complex aur dynamic market hai, jahan par har roz laakhon log trade karte hain. Trading strategies ko samajhna aur implement karna successful trading ke liye bohot zaroori hai. EMA (Exponential Moving Average) strategy forex trend ke sath aik popular aur effective method hai. Iss article mein hum EMA strategy ko detail mein discuss karenge.
        Introduction to EMA (Exponential Moving Average)


        Exponential Moving Average, yaani EMA, aik type ka moving average hai jo latest price data ko zyada weightage deta hai. Yeh aik smooth line draw karta hai jo market ke overall trend ko identify karne mein madadgar hota hai. EMA ko short-term aur long-term trends ko analyze karne ke liye use kiya ja sakta hai.
        EMA vs SMA (Simple Moving Average)


        Simple Moving Average (SMA) aur EMA ke darmiyan aik major difference yeh hai ke EMA recent prices ko zyada importance deta hai jab ke SMA sab prices ko equal weightage deta hai. EMA ka jaldi respond karna usse volatile markets mein zyada effective banata hai.
        Setting Up EMA


        EMA ko set up karna simple hai. Aapko sirf apne trading platform pe EMA indicator ko select karna hai aur desired period input karna hai. Commonly used periods 10, 20, 50, 100 aur 200 hain.
        Identifying the Trend


        EMA strategy ka pehla step trend ko identify karna hai. Jab price EMA line ke upar ho to yeh bullish trend ko indicate karta hai aur jab price EMA line ke neeche ho to yeh bearish trend ko indicate karta hai.
        Entry and Exit Points


        Entry Point:
        • Bullish Trend: Jab price EMA ke upar ho aur EMA upward slope dikha raha ho, to yeh buy signal hota hai.
        • Bearish Trend: Jab price EMA ke neeche ho aur EMA downward slope dikha raha ho, to yeh sell signal hota hai.

        Exit Point:
        • Bullish Trend: Jab price EMA ke neeche cross kare, to yeh exit signal hota hai.
        • Bearish Trend: Jab price EMA ke upar cross kare, to yeh exit signal hota hai.
        Multiple EMA Strategy


        Multiple EMA strategy mein aap do ya zyada EMAs ko use karte hain. Commonly used combinations 20 EMA aur 50 EMA hain. Is method mein aap tab buy signal lete hain jab short-term EMA long-term EMA ko cross karke upar jaye aur sell signal tab lete hain jab short-term EMA long-term EMA ko cross karke neeche aaye.
        Benefits of EMA Strategy
        • Trend Identification: EMA trend ko easily identify karne mein madad karta hai.
        • Quick Response: EMA jaldi market changes ko reflect karta hai.
        • Clear Signals: EMA clear entry aur exit signals provide karta hai.
        Limitations of EMA Strategy
        • False Signals: Kabhi kabhi EMA false signals bhi de sakta hai, especially in choppy markets.
        • Lagging Indicator: EMA ek lagging indicator hai, iska matlab yeh past prices par based hota hai.
        Combining EMA with Other Indicators


        EMA strategy ko aur bhi effective banane ke liye, aap isse doosre indicators ke sath combine kar sakte hain jaise ke RSI (Relative Strength Index), MACD (Moving Average Convergence Divergence), aur Fibonacci Retracement.
        Example of EMA Strategy in Action


        Scenario 1: Bullish Trend

        Ek trader ne 20 EMA aur 50 EMA ko use karte hue dekha ke 20 EMA ne 50 EMA ko cross kar liya aur price EMA ke upar hai. Yeh bullish trend ko indicate karta hai aur trader buy position open karta hai. Jab price 20 EMA ke neeche cross karta hai, trader apni position close kar leta hai.

        Scenario 2: Bearish Trend

        Ek trader ne dekha ke price 20 EMA aur 50 EMA dono ke neeche hai aur 20 EMA downward slope dikha raha hai. Yeh bearish trend ko indicate karta hai aur trader sell position open karta hai. Jab price wapas 20 EMA ke upar cross karta hai, trader apni position close kar leta hai.
        Conclusion


        EMA strategy forex trading mein aik powerful tool hai jo traders ko market trends ko identify karne aur profitable trades execute karne mein madadgar hota hai. Lekin, kisi bhi trading strategy ki tarah, EMA strategy ko bhi practice aur experience ke sath sahi tarike se samajhna zaroori hai. Is strategy ko doosre indicators ke sath combine karne se aapki trading accuracy aur profitability increase ho sakti hai.

        Forex trading mein success ke liye disciplined approach aur risk management bhi bohot zaroori hai. EMA strategy ko apne trading plan ka hissa banake aap market mein sustainable profits kama sakte hain.
        • #5 Collapse


          EMA Strategy with Forex Trend


          Introduction

          EMA (Exponential Moving Average) aik popular technical indicator hai jo traders ke liye market trends ko samajhne aur trading signals generate karne me madad karta hai. Ye strategy forex market me trend following ke liye use hoti hai. Is article me hum EMA strategy ko forex trend ke saath kaise use kiya jata hai, usko discuss karenge.

          EMA (Exponential Moving Average) Kya Hai?

          EMA ek moving average hai jo price data ko smooth karke current price ke trend ko highlight karta hai. EMA normal moving average se alag hota hai kyunki EMA recent price data ko zyada weightage deta hai. Ye trend ka direction aur momentum ko identify karne me madad karta hai.

          EMA Strategy Steps:
          1. EMA Parameters Select Karein:
            • Pehle, aapko EMA ke parameters select karne honge, jaise ke 20-period EMA aur 50-period EMA.
            • Traders different timeframes ke liye alag alag EMA parameters use karte hain, jaise ke short-term aur long-term trends ke liye.
          2. Trend Direction Identify Karein:
            • EMA ka use karke trend ka direction identify karein.
            • Jab short-term EMA (jaise 20-period EMA) long-term EMA (jaise 50-period EMA) se upar hota hai, to ye uptrend ka indication hota hai.
            • Jab short-term EMA long-term EMA se neeche hota hai, to ye downtrend ka indication hota hai.
          3. Entry Points Determine Karein:
            • Uptrend me, entry points long positions ke liye select karein jab short-term EMA long-term EMA ko upar se cross kare.
            • Downtrend me, entry points short positions ke liye select karein jab short-term EMA long-term EMA ko neeche se cross kare.
          4. Stop Loss Aur Take Profit Set Karein:
            • Stop loss ko set karein previous swing low (for long positions) ya swing high (for short positions) ke neeche (upar) tak.
            • Take profit levels ko set karein based on risk-reward ratio aur support/resistance levels ke according.

          Example of EMA Strategy with Forex Trend:
          1. Trend Identification:
            • Maan lijiye aap EUR/USD pair ko analyze kar rahe hain.
            • Aapne 20-period EMA aur 50-period EMA apply kiya hai.
            • Agar 20-period EMA 50-period EMA se upar hai, to ye uptrend ka signal hai.
            • Agar 20-period EMA 50-period EMA se neeche hai, to ye downtrend ka signal hai.
          2. Entry Points:
            • Uptrend me, long position enter karein jab 20-period EMA 50-period EMA ko upar se cross kare.
            • Downtrend me, short position enter karein jab 20-period EMA 50-period EMA ko neeche se cross kare.
          3. Stop Loss Aur Take Profit:
            • Agar long position enter kiya hai, to stop loss ko set karein previous swing low ke neeche.
            • Agar short position enter kiya hai, to stop loss ko set karein previous swing high ke upar.
            • Take profit levels ko set karein based on support/resistance levels ya risk-reward ratio ke mutabiq.

          Conclusion

          EMA strategy ek effective tool hai forex market me trend following ke liye. Is strategy ko use karke traders trend ka direction identify kar sakte hain aur entry/exit points determine kar sakte hain. Proper risk management ke saath EMA strategy ko implement karke traders apne trading decisions ko improve kar sakte hain aur consistent profits earn kar sakte hain.


          Click image for larger version

Name:	download - 2024-06-02T111716.313.jpg
Views:	20
Size:	10.0 کلوبائٹ
ID:	12984137


          • #6 Collapse

            Forex Market Mein EMA Strategy:$:$:$:$

            Forex (foreign exchange) market mein EMA (Exponential Moving Average) strategy ek trading technique hai jo price trends ko identify aur trading decisions lene ke liye use hoti hai. EMA, ek type ka moving average hota hai jo recent price movements ko zyada weight deta hai, isse current price trends ki better reflection milti hai.

            Forex Market Mein EMA Strategy Ke Components:$:$:$:$

            EMA Strategy ke kuch common uses aur components:
            1. EMA Crossovers:
              • Golden Cross: Jab short-term EMA (jaise 50-day EMA) long-term EMA (jaise 200-day EMA) ko cross karke upar jaata hai, toh ye bullish signal hota hai.
              • Death Cross: Jab short-term EMA long-term EMA ko cross karke neeche jaata hai, toh ye bearish signal hota hai.
            2. Trend Identification:
              • EMA ka slope (angle) use karke trend identify kiya ja sakta hai. Agar EMA upar ja rahi hai, toh market uptrend mein hai aur agar neeche ja rahi hai, toh downtrend mein hai.
            3. Support and Resistance Levels:
              • EMA lines ko dynamic support aur resistance levels ke tarah use kiya ja sakta hai. Price action EMA lines ke aas paas reverse ya bounce kar sakti hai.
            4. Combination with Other Indicators:
              • EMA strategy ko dusre technical indicators jaise MACD (Moving Average Convergence Divergence), RSI (Relative Strength Index), etc. ke sath combine karke trading signals ki confirmation li ja sakti hai.
            Forex Market Mein EMA Strategy Ke Steps:$:$:$:$
            • Chart Setup: Apne trading platform par price chart load karein aur usme 20-period aur 50-period EMA add karein.
            • Identify Crossover Points: EMA crossover points ko identify karein. Jab 20 EMA 50 EMA ko upar cross kare, buy signal consider karein. Jab neeche cross kare, sell signal consider karein.
            • Confirm Trends: Dusre technical indicators se trend ki confirmation lein, jaise MACD, RSI, aur volume.
            • Execute Trades: Confirmed signals par buy ya sell orders place karein.
            • Set Stop-Loss and Take-Profit Levels: Risk management ke liye proper stop-loss aur take-profit levels set karein.
            EMA strategy ka effectively use karne ke liye practice aur market understanding zaroori hai. Trading ke saath risk management aur disciplined approach bhi important hai.
            • #7 Collapse

              Sure, here's a more detailed explanation of an EMA strategy with a focus on forex trend trading in Roman English:

              ### Detailed EMA Strategy for Forex Trading

              **1. Basic Concept:**
              - The Exponential Moving Average (EMA) is used to identify the direction of the trend.
              - EMA gives more weight to recent prices, making it more responsive to new information.

              **2. Selecting the Right EMAs:**
              - **Short-term EMA:** Often set at 12 or 20 periods. This will react quickly to price changes.
              - **Long-term EMA:** Typically set at 50 or 200 periods. This will show the overall trend direction.

              **3. Identifying the Trend:**
              - **Uptrend:** Short-term EMA is above the long-term EMA. This indicates a bullish market.
              - **Downtrend:** Short-term EMA is below the long-term EMA. This indicates a bearish market.

              **4. Generating Entry Signals:**
              - **Buy Signal:** When the short-term EMA crosses above the long-term EMA.
              - **Sell Signal:** When the short-term EMA crosses below the long-term EMA.

              **5. Generating Exit Signals:**
              - **For Buy Positions:** Exit when the short-term EMA crosses below the long-term EMA.
              - **For Sell Positions:** Exit when the short-term EMA crosses above the long-term EMA.

              **6. Using Additional Indicators:**
              - **Relative Strength Index (RSI):** Confirms strength of the trend. RSI above 50 supports buying, below 50 supports selling.
              - **Moving Average Convergence Divergence (MACD):** Confirms momentum. Buy when MACD line crosses above the signal line, sell when it crosses below.

              ### Example Setup:

              **1. Selecting Currency Pair and Timeframe:**
              - Let's take EUR/USD on a daily timeframe.

              **2. Plotting the EMAs:**
              - Add a 20-period EMA (short-term) and a 50-period EMA (long-term) to your chart.

              **3. Analyzing the Chart:**
              - Observe where the 20 EMA crosses the 50 EMA for entry and exit points.

              **Practical Trading Examples:**

              **1. Buy Example:**
              - **Entry:** When the 20 EMA crosses above the 50 EMA, enter a buy position.
              - **Confirmation:** Ensure RSI is above 50 and MACD line is above the signal line.
              - **Stop-Loss:** Set just below the recent swing low.
              - **Take-Profit:** Based on your risk-reward ratio or when the 20 EMA crosses back below the 50 EMA.

              **2. Sell Example:**
              - **Entry:** When the 20 EMA crosses below the 50 EMA, enter a sell position.
              - **Confirmation:** Ensure RSI is below 50 and MACD line is below the signal line.
              - **Stop-Loss:** Set just above the recent swing high.
              - **Take-Profit:** Based on your risk-reward ratio or when the 20 EMA crosses back above the 50 EMA.

              ### Risk Management:

              **1. Position Sizing:**
              - Calculate your position size based on your risk tolerance and account size.

              **2. Stop-Loss Orders:**
              - Always use stop-loss orders to protect your capital from unexpected market moves.

              **3. Take-Profit Strategy:**
              - Set take-profit levels or use trailing stops to lock in profits as the trade moves in your favor.

              ### Backtesting:

              **1. Importance of Backtesting:**
              - Test your strategy on historical data to understand how it would have performed in different market conditions.
              - Adjust the parameters based on backtesting results to improve the strategy.

              ### Conclusion:

              **1. Simplicity and Effectiveness:**
              - An EMA strategy is straightforward yet powerful for trend-following in forex trading.

              **2. Combining with Other Tools:**
              - Enhance its effectiveness by using additional indicators like RSI and MACD for confirmation.

              **3. Risk Management:**
              - Proper risk management is crucial to avoid significant losses.

              By following this detailed EMA strategy, traders can make informed decisions and potentially increase their success in the forex market.
              • <a href="https://www.instaforex.org/ru/?x=ruforum">InstaForex</a>
              • #8 Collapse

                EMA strategy with forex trend?
                Click image for larger version

Name:	download (24).png
Views:	8
Size:	8.9 کلوبائٹ
ID:	12984251
                **EMA Strategy aur Forex Trend**
                **1. Tasavvur-e-Awalein:**
                Exponential Moving Average (EMA) ek popular technical analysis tool hai jo traders ko market trends aur price movements ka andaza lagane mein madad deta hai. EMA ek average hoti hai jo recent price data ko zyada weight deti hai, isay current market conditions ko better represent karne ke liye.

                **2. Samajhna:**
                EMA strategy ka istemal karke traders forex market ke trends ko identify aur analyze karte hain. Is strategy mein do types ke EMA ka istemal hota hai: short-term EMA aur long-term EMA. Short-term EMA short-term trends ko reflect karta hai jabke long-term EMA long-term trends ko represent karta hai.

                **3. Trading Mein Istemal:**
                EMA strategy ko trading mein istemal karne ke liye traders ko kuch points ka dhyan rakhna zaroori hai:

                a. **Cross-over Signals**: Jab short-term EMA long-term EMA ko cross karti hai (upward ya downward), yeh ek trend reversal ya continuation ka signal ho sakta hai.

                b. **EMA aur Price Movement**: Price jab EMA se cross karta hai, yeh ek entry ya exit point ban sakta hai, depending on the direction of the crossover.

                c. **Trend Confirmation**: EMA strategy ka istemal karke traders ko market trends ki confirmation milti hai, jisse wo apne trades ko sahi direction mein le sakte hain.

                **4. Faide:**
                EMA strategy ka istemal karne se traders ko kuch faide mil sakte hain:

                a. **Trend Identification**: EMA strategy traders ko market trends ko identify karne mein madad deta hai, jisse wo sahi time par entry aur exit points decide kar sakein.

                b. **Simplicity**: EMA strategy asaan hai samajhne aur istemal karne ke liye, jisse traders ko technical analysis mein confidence milta hai.

                c. **Flexibility**: EMA strategy ko different timeframes aur currency pairs par apply kiya ja sakta hai, making it versatile for various trading styles.

                **Ikhrajat:**
                Exponential Moving Average (EMA) strategy forex trading mein ek mufeed tool hai jo traders ko market trends aur price movements ka analysis karne mein madad deta hai. Is strategy ko sahi tareeqe se istemal karne ke liye traders ko price action aur market psychology ko samajhna zaroori hai.

                اب آن لائن

                Working...
                X