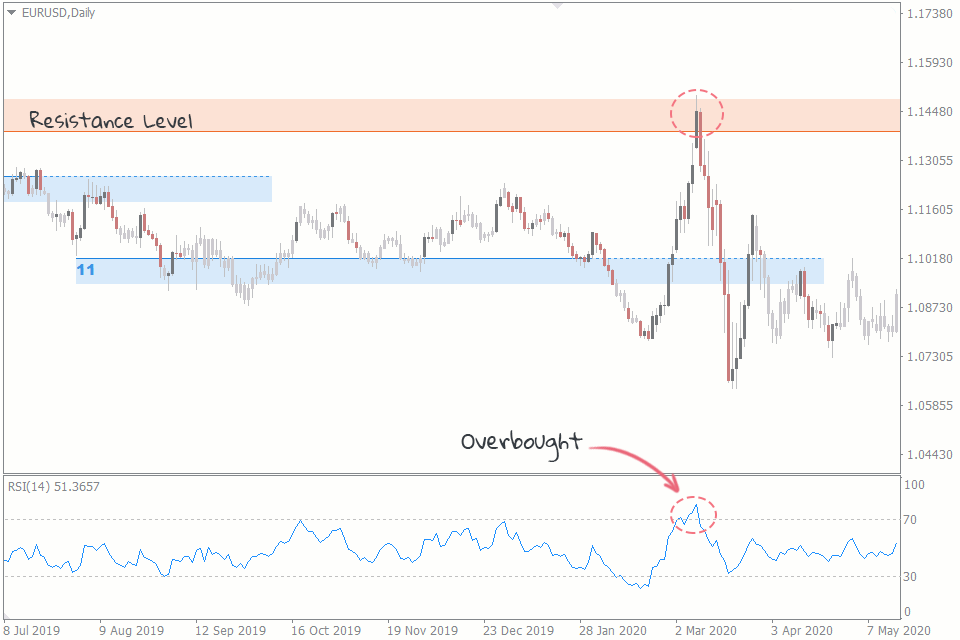
Overbought and Oversold ki definition
Dosto overbough price aur oversold price market me edges sy zahir hoty hen lekin is ky leay jo Indicator use hota hy RSI momentum oscillator jo kisi b time frame ma price ki speed or velocity ko measure karta hai. RSI ka main maqsad ye hota hai k price momentum k change ko measure karta hai. Ye technical indicator k tor par b use hota hai. Jb rsi ki value 70 sy above move karti hai to es ka matlab hai k market overbought condition ma hai es sorat ma trader ko sell ki trade open karni chahe. Ese tarha rsi ki value jb 30 sy down ah jati hai to es ka ye matlab hai market oversold state ma ah chuki hai or hamy es sorat ma buy ki trade open karna chahe. RSI ki kuch special qualities b hoti hai jin ko ham discuss kar letyn hain.

Confirmation in Trendlines
RSI ka interesting fact hai ye closing chart k sath sath chalta hai. Kuch cases ma rsi or closing chart k darmeyan farak karna bhot mushkil ho jata hai. Tb ham closing chart par trend line apply karty hain. Ham rsi ki tarha closing trend line ko b same manner ma use kar sakty hain.

Expected Breakout / Breakdown.
RSI ki help sy hamy market ka breakout or breakdown ka advance ma pata chal jata hai ye RSI k bary ma bhot interesting fact hai. Ye basically advance signal dey deta k market ma kiya hony wala hai.

RSI Calculation Strength
50 value wali line direction ko show karny ma bhot help hota hai. Market ka trend yaha sy he start hota hai. Agr market 50 line ko cross kar jae to esk bullish ma jany k chances bhot barh jaty hain. Same ese tarha market jesy he 50 line sy nechy girti hai to ye zayada chances ban jaty hain k market ab bearish trend ko he follow kary gi. so es sy hamy pata chala ka agr ham RSI ko better tareeky sy use karyn to ye hamari har step par help karti hai. So hamary lae profit hasil karny ma RSI ka bhot kirdar hota hai.

Dosto overbough price aur oversold price market me edges sy zahir hoty hen lekin is ky leay jo Indicator use hota hy RSI momentum oscillator jo kisi b time frame ma price ki speed or velocity ko measure karta hai. RSI ka main maqsad ye hota hai k price momentum k change ko measure karta hai. Ye technical indicator k tor par b use hota hai. Jb rsi ki value 70 sy above move karti hai to es ka matlab hai k market overbought condition ma hai es sorat ma trader ko sell ki trade open karni chahe. Ese tarha rsi ki value jb 30 sy down ah jati hai to es ka ye matlab hai market oversold state ma ah chuki hai or hamy es sorat ma buy ki trade open karna chahe. RSI ki kuch special qualities b hoti hai jin ko ham discuss kar letyn hain.
Confirmation in Trendlines
RSI ka interesting fact hai ye closing chart k sath sath chalta hai. Kuch cases ma rsi or closing chart k darmeyan farak karna bhot mushkil ho jata hai. Tb ham closing chart par trend line apply karty hain. Ham rsi ki tarha closing trend line ko b same manner ma use kar sakty hain.
Expected Breakout / Breakdown.
RSI ki help sy hamy market ka breakout or breakdown ka advance ma pata chal jata hai ye RSI k bary ma bhot interesting fact hai. Ye basically advance signal dey deta k market ma kiya hony wala hai.
RSI Calculation Strength
50 value wali line direction ko show karny ma bhot help hota hai. Market ka trend yaha sy he start hota hai. Agr market 50 line ko cross kar jae to esk bullish ma jany k chances bhot barh jaty hain. Same ese tarha market jesy he 50 line sy nechy girti hai to ye zayada chances ban jaty hain k market ab bearish trend ko he follow kary gi. so es sy hamy pata chala ka agr ham RSI ko better tareeky sy use karyn to ye hamari har step par help karti hai. So hamary lae profit hasil karny ma RSI ka bhot kirdar hota hai.


تبصرہ
Расширенный режим Обычный режим