Importance of "Relative Index Indicator (RSI)"in Forex Trading :
X
  • وقت
  • دکھائیں
Clear All
new posts
  • #1 Collapse

    Importance of "Relative Index Indicator (RSI)"in Forex Trading :
    Importance of Relative Index Indicator (RSI) in Forex Trading:

    Dear forex members umeed krta hu k ap kheriyat sy hun gy.Or forex Trading sy ak acha profit earn kr rahy hu gy.

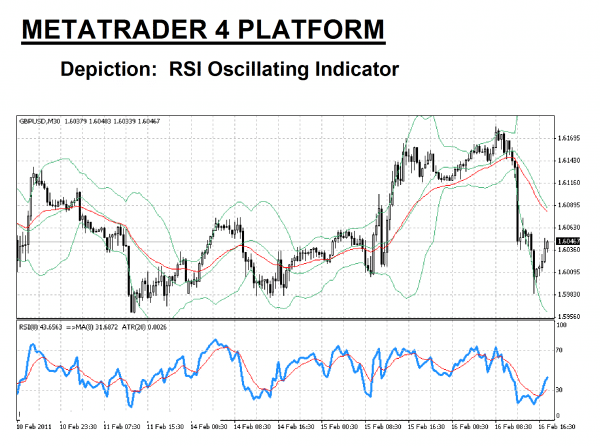
    Relative Strength Index Indicator (RSI)

    Dear forex members forex trading mai relative strength index RSI indicator sab say zayada use hony wala indicator hai.Ye bht useful or important indicator hai.Jis ko use kr k hum ak successful trading kr skty hain.Is lye short ma hum isy RSI kehty hain.
    Ye aik asa indicator hai jo hamen market mai ak successful trading krny k lye overbought or over sold situation ki detail sy identify krta hai.Trading mai overbought or oversold ki situation ko samjty hwy is indicator sy trading krni chahye.

    1). RSI Indicator trading mai buy or sell k signals generate krta hai.
    2). RSI indicator trading mai currency pairs ki prices k overbought or oversell ka batata hai.
    3). RSI indicator trading mai currency pairs ki prices k sath sath is ki movement ko kisi bi time frame k mutabik accurate batata hai.
    4). RSI indicator trading mai leading indicator k tor pr use hota hai. Or ye pehly sy he market price k trend reversal signal deta hai.


    Click image for larger version

Name:	images (41).png
Views:	9
Size:	13.4 کلوبائٹ
ID:	12480476


    RSI indicator ko hum different situation mai use kr sakty hen.


    1. Overbought Situation :


    Dear forex members forex trading mai RSI indicator ki is situation ko hum level 70 bi kehty hen. Or overbought situation ko hum level 70 sy bi indicate kr sakty hen. Trading mai ye ak aisi position hoti hai. Jis mai hum market prices ko uptrend mai dekhty hen. Is situation mai different type ki candlestick patterns ko dekhty huwy hum is mai buy or sell ki trade ki entry ly sakty hen. RSI indicator k overbought hoty he hum candlestick pattern ko dekh sakty hen. Or is k indication pr hum trade laga sakty hen.

    Click image for larger version

Name:	images (43).png
Views:	1
Size:	15.6 کلوبائٹ
ID:	12480480


    2. Oversold Situation :


    Dear forex members forex trading mai RSI indicator ki is situation ko hum level 30 bi kehty hen. Jb market ki prices down fall kr rahe hon. To hum market ko observe krty huwy is mai humen ak strong seller pressure mil raha hota hai. Or isi seller pressure ki waja sy market down fall krty huwy bottom tk aa jati hai. Market k us level pr aany k bad market mai uptrend expected ho jata hai. Is situation ko oversold situation kehty hen. Is indicator ki help sy hum trading chart mai apni buy ki trade ki entry ly sakty hen.


    Click image for larger version

Name:	images (42).png
Views:	13
Size:	15.5 کلوبائٹ
ID:	12480477


    Trading with RSI Indicator :


    Dear forex members agr hum forex trading mai RSI indicator k basis pr hum trading krna chahty hen. To hamen trade different time frame ki basis pr is ki classification krni ho ge. Q k choty time frame or bary time frame mai calculation different hoti hai. Or RSI indicator ki value mai changing bi hamen confuse kr sakti hai. Is time frame ki classification k bad hum trading kr sakty hen.


    RSI Indicator on Small Time Frame :


    Jb hum RSI indicator ko kisi bi Small time frame or apply krty hen. To hamen level 5 sy level level 90 ko draw krna chaheye. Small time frame py market ki calculation or RSI indicator ki value bohot tezi sy km or zyada hoti hai. Small time frame mai hamen trading krny k leye entry point level 15 sy lena chaheye. Trade ko down hony pr hum mazeed level 10 or level 5 pr bi hum apni trade ki enrty ly sakty hen. Or is tarha sy sell ki trade lagany k leye apna enrty point level 85 sy pehly lena ho ga. Or phr level 90 or 95 pr bi hum mazeed enrty ly sakty hen.


    Click image for larger version

Name:	images (29).jpeg
Views:	2
Size:	41.3 کلوبائٹ
ID:	12480478


    RSI Indicator on Big Time Frame :


    Jb bi hum RSI indicator ko kisi bi big time frame pr lety hen. To level 70 sy seller or level 30 sy buyer ki conformation milti hai. Kisi bi big time frame ko for example H4 ya daily time frame mai dekh rahy hoty hen. To is ki identification or situation pr level 70 pr sell or level 30 pr buy ki confirmation hoti hai. Isi waja,sy hum level 70 pr sell ki or level 30 buy ki trade ki entry ly sakty hen.


    Click image for larger version

Name:	images (30).jpeg
Views:	1
Size:	64.0 کلوبائٹ
ID:	12480479


    Benifits of RSI Indicator :


    Dear members RSI indicator ak bohot famous important or bohot strong indicator hai. Ye hamen ak positive guide line deta hai. RSI indicator sy market ko smjhna bohot asan hota hai.


    <font size="4"><font size="2">
  • <a href="https://www.instaforex.org/ru/?x=ruforum">InstaForex</a>
  • #2 Collapse

    Re: Importance of &quot;Relative Index Indicator (RSI)&quot;in Forex Trading :

    umeeed karti ho k kafi achi achi learning share kaare gy aaap agar forex trading main work karna haiin tu har traders ko best learning ki need hain relative strength index RSI indicator har traders kaam karta hain agar koi traders kaam karta hain tu apni learning ko strong kar k he kaam karta hain agar traders k pas koi best learning nhe hain tu kamyabi b nhe hain kamyabi k liy eforex trading ko samjhna parta hain agar hard work kia tu kamyabi b mil jygi jaab tak hard work nhe hain tu strong earning kabi b nhe mil skti hain relative strength index RSI indicator ko use karne k liye best learning kare agar best learning nhe hain tu benefit kabi b hasil nhe ho skti hain


    how to trade on relative strength index RSI indicator:


    RSI main kaam karne k liye market main RSI main work karne k liye pratice ki neeed hain agar rsi main kaam karna hain tu best learning ki need hain rsi main kaam karne k liye ek traders ko achi tara learning ka hona must hain forex trading main indicator ko use karne k liey sab say phly pratice ki need hain qk jaaab tak pratice nhe hoti hain tu relative strength index RSI indicator ki samjh nhe aa skti hain agar forex trading main koi b indicator ko use kia jata hain tu best earning karne k liye analysis karna must hain agar best learning hoti hain tu best earning hoti hain agar best earning nhe hain tu pratice k bina kuch b nhe hain relative strength index RSI indicator main kaam karna hain tu pratice karna hoga jaaab tak pratice nhe hain tu rsi main kamyabi b nhe mil skti hian forex main hard work karna hota hain jaaab tak hard work nhe hain tu earning nhe hain har trders achi earning karne k liye he pratice karte hain


    Click image for larger version

Name:	maxresdefault.jpg
Views:	9
Size:	110.1 کلوبائٹ
ID:	12351460
    • #3 Collapse

      Re: Importance of &quot;Relative Index Indicator (RSI)&quot;in Forex Trading :

      Assalam o alaikum dear members umeed hai k ap sab theek thaak hoon gy aur apna kaam achy treeky sy kar rahy hoon hy. Aaj ka hmara topic hai k RSI ki importance kia hai. To aj hum dekhain gy k RSI hota kia hai es ki importance kia hai aur RSI ko use karty huay hum kis trha sy tradin kar sakty hain


      RSI KIA HAI???

      RSI ka mtlb hai relative strength index. Ye aik indicator hai aur es ko market mai momentum ko measure karny k leay istimal kia jata hai. Ye technical analysis mai istimaal hota hai aur es ki madad sy market ka momentum measures kia jata hai ye current price ki magnitude ko measure karta hai aur market mai overbought aur over sold conditions k bary mai btata hai. RSI ko aik oscilator ki window mai display kia jata hain. Osilatir aik aisa indicator hota hai jo 2 extreme values k darmeyan mai move karta hai aur ye aik line ki shakal mai hota hai.aur es ki readin 0 aur 100 k darmeyan rehti hai.es ko 1978 mai develop kia gaya tha.

      RSI k bary mai eham baten:

      1.RSI aik mashoor momentum indicator hai.
      2.RSI traders ko technically bearish aur bullish trend k bary mai btata hai.
      3.kisi khe asset( share, currency pair, commodity) ko iver bought mana jata hai agr RSI ki price 70 sy ooper ho.
      Aur kisi bhe asset ko over sold mana jata hai jab RSI KI value 30 sy kam ho.

      RSI Ap KO KIA BTATA HAI?

      Jab RSI 30 k level sy neechy jata hai to ye es baat ki alamat hoti hai k market mai ab bullish trend aany wala hai RSI ka 30 sy neechy jana es bat ki alamat hota hai k market ab over sold hai mtlb ye k ab market apny demand zone mai enter ho chuki hai aur ab market mai bullish trend aany wala hai. Es k kuch der bad trader ko intizaar karna chaheay k jab RSI 30 k level ko cross kar k ooper aa jaye to buy ki trade open karni chaheay.

      Esi trha jab RSI Ki price 70 k level sy ooper jati hai to es ka mtlb ye hota hai k ab market over bought ho chuki hai mtlb ye k bullish trend khatam hony wala hai aur aur bearish trend aany wala hai. Mtlb ye k market mai ab demand zone almost khatam ho gaya hai aur suply zine shuru ho chuka hai.
      Lezaha jab RSI. 70 k level sy ooper jaye aur phir RSI ki line dubara sy 70 k level ko cross kar k neechy aaye to sell ki trade li ja sakti hai.


      RSI Bullish DIVERGENCE KIA HAI?

      Bullish divergence os saqt paida hoti hai jab RSI oversold condition zahir kar raha ho aur market hai aik higher low lag jaye.es ka mtlb ye hota hai k ab market mai down tred khatam hony wala hai aur ab uptrend start ho raha hai lehaza buy ki trade open ki ja sakti hai.

      RSI BEARISH DIVERGENCE:

      Rsi mai bearish divergence ka mtlb ye hota hai k RSI overbought show kar raha ho aur market mai lower high lag jaye. Es ka mtlb ye hai k demand zone khatam hony wala hai aur aik buy ki trade open ki ja sakti hai
       
      • #4 Collapse

        Re: Importance of &quot;Relative Index Indicator (RSI)&quot;in Forex Trading :

        Forex chart ma bhot sary indicators trader ki help k lae daye gaye hain. Trader enko apny assistant k tor par use kar sakty hain. Rsi bhot popular indicator hai or maximum trader es indicator ko use karty hain. Es topic ham rsi indicator ko detail k sath discuss karyn gy.

        Click image for larger version

Name:	Screenshot_20211201-194232_Opera Mini.jpg
Views:	1
Size:	121.7 کلوبائٹ
ID:	12351986

        What is relative strength index (RSI)?

        Rsi ik widely use momentum oscillator hai rsi both speed or rate of change of price ko measure karta hai. Rsi ki value 0 or 100 k darmeyan ma fluctuate hoti rehti hai. Jb ye value 30 sy below chali jati hai to es ka matlab hai market over sold ho gae hai or trader ko es time par buy ki trade ko open karna chahe. Secondly jb ye indicator 70 ki above ko show karta hai to es ka matlab hota hai market over bought state ma chali gae hai or trader ko es time par sell ki trade ko open karna chahe.

        Divergence of RSI

        Rsi ma divergence signal market k potential reversal ko show karta hai kiu k directional momentum price ko confirm ni karty. Jb market lower low banati hai to es ka matlab hai divergence bullish hai or asi sorat ma rsi higher low banati hai. Rsi momentum ki strength ko show karti or ye lower low ni form karti. Jb market higher high banati hai to es ka matlab ye hota k divergence bearish hai or rsi lower high value ko show karti hai.

        Positive Negative Reversal.

        Jb rsi lower low value ko show karti hai to es ka matlab ye hota hai k market ma positive reversal hai. Ye lower low over sold state ko show ni karta balky ye value 30 to 50 ko show karta hai. Es he tarha negative reversal positive reversal k opposite side par hota hai.

        Conclusion.

        Rsi trader ko bhot variety provide karta hai. Rsi ka success rate bhot kam hai or trader ko esko other pattern or indicators k sath conjuction ma use karna parta hai but ye sb b rsi ki importance ko kam ni kar saky hain. Es indicator ki help sy trader ko acha entery point mel jata hai or trader ko agr acha entry point mel jaye to profit hasil karna easy ho jata hai.
        • #5 Collapse

          Re: Importance of &quot;Relative Index Indicator (RSI)&quot;in Forex Trading :

          RSI INDICATOR EXPLAINED – WHAT IS THE RSI INDICATOR?

          The “Relative Strength Index”, or “RSI”, indicator is a popular member of the “Oscillator” family of technical indicators. J. Welles Wilder created the RSI in order to measure the relative changes that occur between higher and lower closing prices. Traders use the index to determine overbought and oversold conditions, valuable information when setting entry and exit levels in the forex market.
          The RSI is classified as an “oscillator” since the resulting curve fluctuates between values of zero and 100. The indicator typically has lines drawn at both the “30” and “70” values as warning signals. Values exceeding “85” are interpreted as a strong overbought condition, or “selling” signal, and if the curve dips below “15”, a strong oversold condition, or “buying” signal, is generated.
          RSI FORMULA

          The RSI indicator is common on Metatrader4 trading software, and the calculation formula sequence involves these straightforward steps:
          1. Choose a predetermined period “X” (Standard value is “14”, although a value of “8” or “9” tends to be more sensitive;
          2. Calculate “RS” = (Average of “X” periods up closes/Average of “X” periods down closes;
          3. RSI = 100 – [100/(1 + RS)]

          Software programs perform the necessary computational work and produce an RSI indicator as displayed in the bottom portion of the following chart:

          The RSI indicator is composed of a single fluctuating curve. Traders will occasionally add an exponential moving average, as above in red, to enhance the value of the trading signals. In the example above, the “blue” line is the RSI, while the “red” line represents an “EMA” for the same period variable of “8”. The RSI is viewed as a “leading” indicator, in that its signals foretell that a change in trend is imminent. The weakness in the indicator is that timing is not necessarily a product of the RSI, the reason for attaching a “lagging” moving average to confirm the RSI signal.
          Large surges in price changes can cause the RSI indicator to give false signals. It is prudent to complement the RSI with another indicator. Wilder also believed that the forte of the indicator was revealed when its values diverged from the prevailing prices in the market.
          The next article in this series on the RSI indicator will discuss how this oscillator is used in forex trading and how to read the various graphical signals that are generated.
          • #6 Collapse

            Re: Importance of &quot;Relative Index Indicator (RSI)&quot;in Forex Trading :

            Assalam o alaikum dear individuals umeed hai k ap sab theek thaak hoon gy aur apna kaam pain-filled treeky sy kar rahy hoon hy. Aaj ka hmara theme hai k RSI ki significance kia hai. To aj murmur dekhain gy k RSI hota kia hai es ki significance kia hai aur RSI ko use karty huay murmur kis trha sy tradin kar sakty hain

            RSI KIA HAI???

            RSI ka mtlb hai relative strength record. Ye aik marker hai aur es ko market mai force ko measure karny k leay istimal kia jata hai. Ye specialized examination mai istimaal hota hai aur es ki madad sy market ka energy measures kia jata hai ye current value ki size ko measure karta hai aur market mai overbought aur over sold conditions k bary mai btata hai. RSI ko aik oscilator ki window mai show kia jata hain. Osilatir aik aisa pointer hota hai jo 2 outrageous qualities k darmeyan mai move karta hai aur ye aik line ki shakal mai hota hai.aur es ki readin 0 aur 100 k darmeyan rehti hai.es ko 1978 mai create kia gaya tha.

            RSI k bary mai eham baten:

            1.RSI aik mashoor energy pointer hai.
            2.RSI brokers ko in fact negative aur bullish pattern k bary mai btata hai.
            3.kisi khe resource( share, money pair, product) ko iver purchased mana jata hai agr RSI ki cost 70 sy ooper ho.
            Aur kisi bhe resource ko over sold mana jata hai punch RSI KI esteem 30 sy kam ho.

            RSI Ap KO KIA BTATA HAI?

            Hit RSI 30 k level sy neechy jata hai to ye es baat ki alamat hoti hai k market mai abdominal muscle bullish pattern aany wala hai RSI ka 30 sy neechy jana es bat ki alamat hota hai k market abdominal muscle over sold hai mtlb ye k stomach muscle market apny request zone mai enter ho chuki hai aur stomach muscle market mai bullish pattern aany wala hai. Es k kuch der awful dealer ko intizaar karna chaheay k hit RSI 30 k level ko cross kar k ooper aa jaye to purchase ki exchange open karni chaheay.

            Esi trha hit RSI Ki cost 70 k level sy ooper jati hai to es ka mtlb ye hota hai k abdominal muscle market over purchased ho chuki hai mtlb ye k bullish pattern khatam hony wala hai aur negative pattern aany wala hai. Mtlb ye k market mai abdominal muscle request zone nearly khatam ho gaya hai aur suply zine shuru ho chuka hai.
            Lezaha hit RSI. 70 k level sy ooper jaye aur phir RSI ki line dubara sy 70 k level ko cross kar k neechy aaye to sell ki exchange li ja sakti hai.

            RSI Bullish DIVERGENCE KIA HAI?

            Bullish disparity os saqt paida hoti hai hit RSI oversold condition zahir kar raha ho aur market hai aik higher low slack jaye.es ka mtlb ye hota hai k abdominal muscle market mai down tred khatam hony wala hai aur stomach muscle upswing start ho raha hai lehaza purchase ki exchange open ki ja sakti hai.

            RSI BEARISH DIVERGENCE:

            Rsi mai negative disparity ka mtlb ye hota hai k RSI overbought show kar raha ho aur market mai lower high slack jaye. Es ka mtlb ye hai k interest zone khatam hony wala hai aur aik purchase ki exchange open ki ja sakti hai
            • #7 Collapse

              Re: Importance of &quot;Relative Index Indicator (RSI)&quot;in Forex Trading :

              Show:
              Assalamu alaikum everybody I wish k sub thek hun gy new exchange business focus mein kamyabi hasil karne ke liye hamen bahut jyada mehnat Karni Hoti hai tb hm kamyab hu skty hy es lye pehly apni getting to acknowledge ko complete karna hoga tab kakamyab hu sky gy..Aj ka hmahmara point tower peak candle plan okay bary me hy tto chalye theme pr bat krtkrty hy .

              Tower Top Candlestick Pattern:
              Ye candle plan jis OK nam hai tower peak candle test ye three four five 6 7 light sy mil okay bnta hai ye ek wahid candle test hai jo k kafi sari candle sy mil k bnta hai ye ek negative reversal style test hai ye test business focus OK pointless degree OK summit py bnta hai ais test major first or last fire ais ki nazr most huge hoti hai ais tahr aisy tower apex flame test kehty hsin ye style bullish model wajood key ata hai ais tahr esi circumstance head market ki costs k down any okay bht chances hoty hain..

              Usage of Tower zenith flame test:

              Market essential apex pinnacle candle plan okay liye market major phely sy bullish model OK hona bht huge hai ais tahr ye long certifiable edge ki natural bullish ki hoti hai ais OK ilawa ais plan k bd bati fire bullish OK bd 1 2 three and four 5 bhi ho skti hai ye flame test white bhi ho skti hai or fresh or red bhi ho skti hai ais fundamental dissect candle genuine body ki hoti hai or focus wali saru light fresh hoti hain..

              Trading with Tower pinnacle candle:
              Ye candle plan ek style reversal hai ye test ziyada tar exorbitant spot ki rate common bnta hai ais plan ki outrageous fire bnany okay bd mumble ais py advance ki substitute open kr skty hain ais tahr hr plan ki verification ki tahr ais ki bhi certificate okay humy stand by krna chahiye ais tahr last bad candle bnany okay bd ais k reserve krna chahiye ais tahr mumble ais boss substitute ly okay acha benefit get kr skty hain humy hinder hardship or take pay okay bhi lazmi use krna chahiye or forestall setback humy genuine level ki flame sy thora uper rkhna chahiye or take benefit k bhi japny hisab sy mumble set kr skty hain ais dy humhera account secure rehta

              Flame plan py trading krny okay liye phely test k complete hona bht zaruri hai us k bd he mumble ais huge exchange kr skty hain test ki affirmation OK bd he mumble ais major kamyab ho skty hain ais ilawa bhi humy chahiye OK mumble ais ko review kren tb he ja OK mumble ais head kamyab ho skty hain ais liye explore krna bht critical hai..
                 
              • #8 Collapse

                Re: Importance of &quot;Relative Index Indicator (RSI)&quot;in Forex Trading :

                bhot he very extraordinary sharing ki hain apne forex trading basic full kmayabi panna hain tu troublesome work k sath kaam karna must hain qk jaaab tak troublesome work k sath kaaam nhe hota hian tu Shooting Star Candlestick plan essential kamyabi b nhe mil skti hian kamyabi sheet k liye ek sellers ko Shooting Star Candlestick plan guideline learning ko strong karna hoga jaaab tak learning he strong nhe hoti hain tu getting b nhe ho skti hain achi obtaining karne k liye ek specialists ko standard troublesome work karna must hain achi gaining karne k liye ek vendors ko forex trading essential full kamyabi hasil karna must hain jis b shippers ne forex trading principal securing karna hain wahi vendors incredible procuring kar skte hain or achi kamyabi b hasil kar skte hain kamyabi sheet k iye Shooting Star Candlestick plan ko achi tara samjhna must hain forex ek full trusted and kamyab busniess hain achi kamyabi panna hain tu best learning ko strong karna hoga

                Falling star Candlestick plan in merket:

                forex trading essential extraordinary learning k sath achi tara kamyabi hasil ho skti hain achi tara troublesome work karna parta hain jis b dealers ne forex trading guideline strong learning k sath kaam kiya usi trades ne forex trading mian kamyabi hasil ki hain forex basic kamyabi panne k liye typical learning karna parta hain forex trading key kamyabi sheet k liye troublesome work karna parta hain agar troublesome work kia tu kamyabi hain jisne learning nhe ki usne gaining neh ki obtaining karne k liye ek kamyab vendors ko standard learning ki need hain qk forex essential kamyabi usi ko mil skti hian jo forex trading mai troublesome work and pratice k sath kaam krte hain
                 
                • #9 Collapse

                  Re: Importance of &quot;Relative Index Indicator (RSI)&quot;in Forex Trading :

                  Salam dear people g aj essential apke sath day and swing trading bahut best hai mumble us k uncovered rule share karne lgi hon jo k ek bht good tidings critical subject hain isko samjhna hamarae liye aham hai uncommonly trade k lehaz sy so basic apke sath apna full experience share krti hon jo mujy is sy hasil hua hai dusron ko pulsate se faida hoga so ta k jin people ko is k uncovered standard ni pta wo bhi is sy acha data increase kr len principal apke sath specialty share krti ho mumble iski detail dekhni hai.

                  What is Day trading:

                  G people to agr crucial apko day trading k revealed rule batao bahut zyada samjhni ki need hai to ye specific examination ka use included krti hai or charting structure sy day trading signal sy zaida trading krty hain hume isko time dena hoga isy day trading kaha jata hai.

                  Bit by bit directions to trade with day trading:

                  G people to jesy k zaida tar people ko is ka pta hi hota hai day trading ka acha fayda hai or iska naam hi day trading sy hai to iska ye matlab hai k is crucial ek day ki trade ki jati hai yahan kamyabi sirf mehnat mei hai baki ye kwo bhi bht hours rule hello complete ho jati hai or is sy humy kafi acha proft bhi ho jata hai mumble agr deeple dekhen gay But is essential humy bht soch samjh k trading krni hoti hai is tarah hame chaiye k mumble is essential safe trading kren punch safe karen gay fayda hai q k is sy account wash hone k bhi kafi chances ho sakte hain

                  The best strategy to trade with swing trading:

                  G agr swing trading ki baat ki jaye to us k liye humare pas data experience k sath market specific assessment hume inko time dena hai ye ka hona bhi bht critical hai . Then again is essential hmari trades week or mnth me chlti hain to us k liye humy stretch of time bhi H1 or Day1 ka set krna chaiye us k hisab examination krne chaiye swing trading ki apni aik regard hai is central humesha transient trading ki jati hai or agr market against move kr jati hume woh dekhna chahiye to is sy account unsafe ho jata hai is liye koshish karo aap dekh kar humesha khyl sy hi trading krni chahiye strong assessment sy trade karo
                   
                  • #10 Collapse

                    Meaning of ""Shooting Candle"" in forex trading... bhot he achi learning share ki hain apne forex exchanging key achi tara kamyabi b pana hain tu problematic work karna hoga agar forex exchanging rule agar best learning nhe hoti hain tu Square shape plan fundamental b tremendous misfortune ho jata hain agar middle people ne full kamyabi pana hain tu forex exchanging ko samjhna must hain qk agar exchanging rule best learning nhe hain pratice nhe hain tu kamyabi b nhe hain forex exchanging essential normal market pay b work kia jata hain agar forex rule pratice ki jay tu achi learning kare agar irksome work kia tu kamyabi b mil jygi agar pratice nhe ki tu kamyabi b nhe mil skti hain forex exchanging fundamental pratice karna must hain agar pratice nhe ki jati hain tu colossal accident b ho skta hain is liye pratice karna must hain Light Square shape plan in Forex Exchanging: Square shape plan key market ko agar achi tara assessment kia jata hain tu achi tara kamyabi full kamyabi b hasil ho skti hain Square shape plan rule market bullish and negative hoti hain agar market fundamental achi tara work karna hain tu market ko samjhna parta hain market serious areas of strength for key karna parta hain forex exchanging standard Square shape plan ko appraisal kia jata hain tu har rules ko b keep krna must hota hain agar rules ko Square shape plan focal consent to nhe kiiya jyga tu highlight fundamental ek colossal difficulty ho skta hain or enormous misfortune kar k market fundamental apne capital ko wash kiya jah skta hain is liye problematic work k sath kaam karne rib merchants forex exchanging fundamental ach tara kamyab ho skte hain or acha benefit hasil kar skte hain forex exchanging ko agar learning kia tu full kamyabi hian agar inconvenient work kia tu bundle fo earing b mil jygi and achi kamyabi b mil skti hain
                     
                    • <a href="https://www.instaforex.org/ru/?x=ruforum">InstaForex</a>
                    • #11 Collapse

                      1) Relative Index Indicator RSI – What is It and How Does It Work in Forex Trading? The Relative Index Indicator (RSI) is a momentum oscillator that measures the speed and change of price movements. The RSI oscillates between zero and 100. Readings below 30 suggest an oversold market condition, while readings above 70 suggest an overbought market condition. The Relative Index Indicator (RSI) can be used to help identify market tops and bottoms, as well as support and resistance levels. The RSI can also be used to identify divergences, which often occur before a significant market move. The RSI is a widely used indicator and many traders use it in conjunction with other technical indicators to form a complete trading system. 2) How to Use Relative Index Indicator RSI in Forex Trading? The Relative Index Indicator (RSI) is a momentum oscillator that measures the speed and change of price movements. The RSI oscillates between zero and 100. Generally, if the RSI is above 70 it is considered overbought and if it is below 30 it is considered oversold. The RSI can be used to identify potential reversals in the market. If the RSI is overbought, it means that the market is due for a correction. Conversely, if the RSI is oversold, it means that the market is due for a rally. The RSI can also be used to identify divergences. A bullish divergence occurs when the RSI forms higher lows even though price is forming lower lows. This is an indication that price is about to rally. A bearish divergence occurs when the RSI forms lower highs even though price is forming higher highs. This is an indication that price is about to correct. The RSI can also be used to identify bullish and bearish price patterns such as double tops and bottoms. The RSI is a versatile indicator that can be used in a number of different ways. It is important to experiment with the indicator to see what works best for you. 3) What are the Benefits of Using Relative Index Indicator RSI in Forex Trading? The Relative Strength Index (RSI) is a technical indicator used in the analysis of financial markets. It is intended to chart the current and historical strength or weakness of a stock or market based on the closing prices of a recent trading period. The RSI is classified as a momentum oscillator, measuring the velocity and magnitude of directional price movements. Momentum is the rate of the rise or fall in price. The RSI computes momentum as the ratio of higher closes to lower closes: stocks which have had more or stronger positive changes have a higher RSI than stocks which have had more or stronger negative changes. The RSI is most typically used on a 14-day timeframe, measured on a scale from 0 to 100, with high and low levels marked at 70 and 30, respectively. Signals can be generated by looking for divergences, failure swings and centerline crossovers. RSI can also be used to identify the general trend. The RSI is a popular technical indicator that is widely used by traders in a variety of markets, including forex. The indicator is helpful in identifying overbought and oversold conditions in the market, as well as potential reversals. The RSI can also be used to confirm price movements and trend directions. There are a number of benefits to using the RSI in forex trading. First, the indicator is relatively simple to use and understand. Second, the RSI can be used to identify potential reversals in the market. Third, the indicator can be used to confirm price movements and trend directions. Fourth, the RSI can be used to identify overbought and oversold conditions in the market. Fifth, the RSI can be used to generate buy and sell signals. The RSI is a valuable tool for any trader, and can be used in a variety of ways to help you make better trading decisions. 4) How to Interpret the Results of Relative Index Indicator RSI in Forex Trading? The Relative Index Indicator (RSI) is a momentum oscillator that is used to gauge the strength of a currency pair. The RSI is a technical indicator that is used by traders to identify potential reversals in the market. The RSI is calculated using a 14-period moving average. The RSI can be used to identify overbought and oversold conditions in the market. The RSI is considered to be overbought when the RSI is above 70 and oversold when the RSI is below 30. The RSI is a versatile indicator that can be used to trade a variety of market conditions. The RSI can be used to trade ranging markets, as well as trending markets. The RSI can be used to identify potential reversals in the market, as well as to confirm trends. When the RSI is below 30, it is considered to be oversold. This means that the currency pair is potentially undervalued and may be due for a reversal. When the RSI is above 70, it is considered to be overbought. This means that the currency pair is potentially overvalued and may be due for a reversal. The RSI can also be used to identify divergences. A bullish divergence occurs when the RSI forms higher lows while the price forms lower lows. This is a potential sign that the price may be ready to reverse higher. A bearish divergence occurs when the RSI forms lower highs while the price forms higher highs. This is a potential sign that the price may be ready to reverse lower. The RSI is a powerful tool that can be used to trade a variety of market conditions. The RSI should be used in conjunction with other technical indicators to form a complete trading system.

                      اب آن لائن

                      Working...
                      X