Bullish And Bearish Harami Candlesticks

No announcement yet.
`
X
  • وقت
  • دکھائیں
Clear All
new posts
  • #1 Collapse

    Bullish And Bearish Harami Candlesticks
    What is Harami Candlestick Pattern?
    Harami Candlestick pattern 1 Japanese candlestick pattern hai joo kaybmarket main bullish aur bearish short term signals produce karta hai. Harami Candlestick pattern price action kee directions ky hisaaab say bullish ya bearish consider hota hai. Harami candlestick pattern do candlesticks par mushtamil hottaa hai. 1 candlesticks bullish aur dosri bearish hoti hai aur es hisaab say market ke bullish ya bearish direction ka andaza lagaya jaata hai. Neechy dee gai tasveer main aap bullish aur bearish Harami patterns dekeh sakte hain.

    Bullish Harami Candlestick Important Points

    1. Yeh Downtrend Ka agahaz karta hai
    2. Pehli candlestick bari aur bearish hoti hai
    3. Bearish candlestick kay baad us sy qadry choti bullish candlestick banti hai

    Bearish Harami Important Points

    1. Uptrend ka aghaaz karti hai
    2. Pehli candlestick bari aur bullish hotii hay
    3. Dosri candlestick choti aur bearish hoti hai

    How To Trade On Harami Pattern

    Harami Candlestick patterns 2no bullish aur bearish signals muhaiyyah karta hain aur yeh signal candlestick pattern kay zariye pehchaany ja sakte hain kay bullish hain ya bearish. Neechy dono pattern ke tasaveer aur details main aap kay sath share karne jaa raha hun jis main ye pattern aap clearly dekh sakte hain.

    Example Of Bearish Harami

    Click image for larger version

Name:	harami-candlestick-patterns_body_bearish.png
Views:	10
Size:	11.2 کلوبائٹ
ID:	12475322

    Oper dee hui tasveer main apne dekha kay bullish Harami pattern bany kay baad kis tarha market ny move kiya to same ussi tarha market nay bearish pattern banny kay baad bhe matket ke movement dekhai hai. Lekin aik baat aur jo zehan nasheen karne ke zaroorat hai kay trading karte huy trading ka time frame, classic chart pattern aur price action ko dekh kar decision lain.

    Example Of Bullish Harami

    Click image for larger version

Name:	harami-candlestick-patterns_body_bullish.png
Views:	11
Size:	10.6 کلوبائٹ
ID:	12475323

    Oper dee gai tasvier main mulahiza kiya jaa sakta hai kay EURUSD pair par bullish harami pattern bnnay kay baad uptrend dobara sy jaari hua hai. Lekin ess baat ko bhee madenazar rakhna chahey kay tamaam Harami pattern reversal ke taraf ishaara nahi karte.
  • <a href="https://www.instaforex.org/ru/?x=ruforum">InstaForex</a>
  • #2 Collapse

    Re: Bullish And Bearish Harami Candlesticks

    Dear Forex members ummid hy ap sab kheriyat se honge aur apni trading se satisfy honge aur forex trading mein kam karte hue apni learning aur market ma focus kr ke working kr rahy ho gy dear Forex members jasy ke Ham sab janty hain ke forex ma ham jitna zada learn krty hain itna he ham is ma improve hoty jaty hain is liy hamen learning krty rahy chahie dear forex member ma aj ap ke sath jis topic ko discuss karna chahta us ma be ham market ma bullish aur bearish candlestick ke bary learning karen gy ummid ha tamam dost apni apni achi postshare krengy jis se ham sab ka faida hoga

    Bullish harami candlestick pattern
    Bullish Harami candlestick Pattern ak bearish trend reversal pattern ha ye currency pairs aur commodities k price chart man bearish trend k bottom per support level per commonly nazer any wala pattern hy

    Identification of ""Bullish Harami Candlestick Pattern"":
    Bullish Harami Candlestick Pattern two candles sa mil ker banta ha Is pattern man first candle long real body ki Black candle banti ha Jo market man sellers k strong hold ko batati ha Lakin second candle ""Gap-up"" k sath first candle ki real body man sa open hoti ha aur thora sa price change de ker first candle ki real body man he close deti ha Aur asa lagta ha k black candle phragnant hoSecond candle ki real body first candle ki real body k 25% sa zayada nahe honi chaheye werna pattern Bullish Harami nahe raha ga aur trade signal b valid nahe hoga
    Click image for larger version

Name:	images (18).png
Views:	19
Size:	5.6 کلوبائٹ
ID:	12347707

    Trading with "Bullish Harami Candlestick Pattern"":
    Bullish Harami Candlestick Pattern k banna k bad new candle k open k sath trader ko ""Buy ki Trade"" active kerni chaheye. Stoploss ko first black candle ki low sa nicha place karen aur Take Profit ko next resistance level per place karen
    Click image for larger version

Name:	images (19).png
Views:	1
Size:	5.2 کلوبائٹ
ID:	12347708

    Bullish Harami Candlestick Pattern k sath ager trader kisi technical indicator ko b use kara to trade ki mazeed confirmation ho jae gi. Ager trader ""Relative Strength Index (RSI) Indicator"" ko use ker raha ha to is pattern ki formation k doran RSI oversold (30 level sa nicha) area man honi chaheye aur trade entry k waqt RSI 30 level ko cross above ker rahe ho

    Bearish Harami candlestick”:
    Bearish Harami, two bar ka Japanese candlestick pattern hai, jo batata hai, k prices jald he downside move kar sakti hain ye pattern aik lambi white/bullish candle p mushtamil hota hai jis k bad aik choti c black candle hoti hai Second candle ki opening aur closing prices, pehli candle k under majud honi chaiye Bearish Harami ki tashkeel sy pehly aik uptrend hota hai

    Important point of Bearish Harami Candlestick pattern:
    1. Bearish haramicandlesticks ka aisa chart hai, jo bull price movement main reversal ko indicate karta hai

    2. Ye aam tor p price main thori kami ki taraf, yani black candle ki taraf ishara karta hai Jo k pichly aik ya do din sy di gyi activity ki uper ki qeemat ki movement main shamil ho sakti hai

    3. Traders technical indicators, jasa k Relative strength index aur stochastic oscillator, jis main bearish harami hai, kamyab trade k chances ko barha sakty hain
    Click image for larger version

Name:	download (24).png
Views:	11
Size:	4.2 کلوبائٹ
ID:	12347709

    Bearish Harami explaination:
    Dear members, Bearish harami main second candle ka size, pattern ki taqat ko zahir karta hai Jitni ye candle choti ho g, us ki reversal ka chance utna ziada ho ga Bearish harami ka opposite pattern bullish harami hai, jo k nechy ki taraf jata hai aur suggest karta hai k prices upside ki taraf reverse ho sakti hainTrading in “Bearish Harami Candlestick pattern”:
    Bearish Harami main trade karty waqt agar hum in chezo ka khayal rakhain, to acha result gain kar sakty hain Un ma sy kuch point nechy explained hain
    Click image for larger version

Name:	images (20).png
Views:	1
Size:	5.2 کلوبائٹ
ID:	12347710

    1. Price action:
    Dear members, jab prices Harami pattern main dosri candle sy nechy break hoti hain, to aik short position li ja sakti hai Ye Harami candlestick sy thora nechy stop-limit order dy kar kia ja sakta hai, ye un traders k lye ideal hai, jin k pass trade dekhny ka time nhi hai Traders k risk ki bhuk ko dekhty hue, stop-loss order Harami candlestick k uper, ya white candlestick k uper rakha ja sakta hai Profit ka target set krny k lye, support aur resistance k area ko use kia ja sakta hai
    Dear members, agar hum is pattern ko better understand kar lain aur is k sath dosry indicators bhi use kar lain, to achi trade kar sakty hain aur loss sy bach k acha profit earn kar sakty hain Taham, is pattern main better trade karny k lye dosry market indicators ka use lazmi karain Is tra is ki efficiency mazeed increase ho jaye ga
    • #3 Collapse

      Re: Bullish And Bearish Harami Candlesticks

      اصل پيغام ارسال کردہ از: NawazAwan پيغام ديکھيے
      What is Harami Candlestick Pattern?
      Harami Candlestick pattern 1 Japanese candlestick pattern hai joo kaybmarket main bullish aur bearish short term signals produce karta hai. Harami Candlestick pattern price action kee directions ky hisaaab say bullish ya bearish consider hota hai. Harami candlestick pattern do candlesticks par mushtamil hottaa hai. 1 candlesticks bullish aur dosri bearish hoti hai aur es hisaab say market ke bullish ya bearish direction ka andaza lagaya jaata hai. Neechy dee gai tasveer main aap bullish aur bearish Harami patterns dekeh sakte hain.

      Bullish Harami Candlestick Important Points

      1. Yeh Downtrend Ka agahaz karta hai
      2. Pehli candlestick bari aur bearish hoti hai
      3. Bearish candlestick kay baad us sy qadry choti bullish candlestick banti hai

      Bearish Harami Important Points

      1. Uptrend ka aghaaz karti hai
      2. Pehli candlestick bari aur bullish hotii hay
      3. Dosri candlestick choti aur bearish hoti hai

      How To Trade On Harami Pattern

      Harami Candlestick patterns 2no bullish aur bearish signals muhaiyyah karta hain aur yeh signal candlestick pattern kay zariye pehchaany ja sakte hain kay bullish hain ya bearish. Neechy dono pattern ke tasaveer aur details main aap kay sath share karne jaa raha hun jis main ye pattern aap clearly dekh sakte hain.

      Example Of Bearish Harami

      [ATTACH=CONFIG]39080[/ATTACH]

      Oper dee hui tasveer main apne dekha kay bullish Harami pattern bany kay baad kis tarha market ny move kiya to same ussi tarha market nay bearish pattern banny kay baad bhe matket ke movement dekhai hai. Lekin aik baat aur jo zehan nasheen karne ke zaroorat hai kay trading karte huy trading ka time frame, classic chart pattern aur price action ko dekh kar decision lain.

      Example Of Bullish Harami

      [ATTACH=CONFIG]39081[/ATTACH]

      Oper dee gai tasvier main mulahiza kiya jaa sakta hai kay EURUSD pair par bullish harami pattern bnnay kay baad uptrend dobara sy jaari hua hai. Lekin ess baat ko bhee madenazar rakhna chahey kay tamaam Harami pattern reversal ke taraf ishaara nahi karte.
      Introduction

      Assalamu alaikum dear member kesy hn tamam members umeed krti hn sb khariyat sy hun gye or apna Kam achy sy kr rhy hn gye dear member jesa ke ap janty hn forex trading me humy knowledge or experience hona bht zaruri hota hai apny hmary sth bht acha thread share kia hai or iske bare me information di hai main apke sath mazeed kuch information share karna chahti hun bullish or bearish harami candlestick pattern k bare me

      Harami candlestick pattern

      Harami candlestick pattern ek Japanese candlestick pattern hai yeh market me bullish or bearish short term signals produce krti hai yeh price action ki direction k hisab sy bullish or bearish consider krti hai is liye yeh bullish or bearish par mustamil hoti hai or in dono ki waja sy market ki direction ka andaza lgya jata hai main is k bare me mazeed nechy discuss krti hn

      Type's of harami candlestick pattern

      Harami candlestick pattern mazeed do type's py mustamil hota hai jo ke

      1 bullish harami candlestick pattern
      2 bearish harami candlestick pattern

      1 bullish harami candlestick pattern

      Harami candlestick pattern me bullish downtrend ka agahaz krti hai
      Phli candlestick bari or bearish hoti haiBearish candlestick k bad us sy thora nechy bullish candle bnati hai

      2 bearish harami candlestick pattern

      Bearish candlestick uptrend ka agahaz krti hai
      Phli candlestick bari or bullish hoti hai
      Bullish candlestick k bd us sy thora nechy bearish candle bnti hai


      Click image for larger version

Name:	images.png
Views:	8
Size:	14.5 کلوبائٹ
ID:	12347711
      How to trade on harami candlestick pattern

      Harami candlestick pattern dono bullish or bearish signals provide krtii hai aya signals bullish hain ya bearish yeh hum candlestick pattern k zariye pehchan skty hn ap mazeed iski information hasil kr skty hn or apni trading skills improve kr k trading me kamiyab ho skty hn bs apko knowledge hona bht zaruri hota hai


      Click image for larger version

Name:	images (2).png
Views:	3
Size:	3.0 کلوبائٹ
ID:	12347712
      منسلک شدہ فائلیں
      • #4 Collapse

        Re: Bullish And Bearish Harami Candlesticks

        Assalamu Alaikum
        dear member jab hum candlestick pattern ki study karte Hain, tu ismein
        Bullish Harami Candlestick Pattern or bearish Harami Candlestick Pattern bahut hi familiar pattern hoty Hain, enko aj briefly discuss krny ki kosish krty Hain

        What is meaning of Harami

        Japanese language main pregnant woman ko haramai kaha jata hai Jab aik bri body wali candlestick Kay sath aik choti candlestick banti hai, tu aap isko ya consider Kar sakhty Hain, jesy aik pregnant orat apni body main aik baby ko liye huye hai

        Bullish Harami Candlestick
        Dear members ya candlestick pattern 2 candlestick per include hota hai Jab market mein aik strong downtrend banta hai, or last bearish candlestick Kay bad aik choti body wali candlestick banti hai, Jo bullish indication da rahi hoti hai, tu ya bullish Harami Candlestick Pattern ki formation ki indications da rahi hoti hai
        Click image for larger version

Name:	images (5).png
Views:	4
Size:	7.3 کلوبائٹ
ID:	12347719

        How to Recognize
        Is candlestick pattern ko completely understand karna chahte hain, tu aapko hamesha aik strong downtrend Kay bad aik acchi support level ko find out krna hota hai, jab support level per ya 2 specific candlestick banti Hain, tu ya aapko bullish Harami Candlestick ki information da rahi hoti hain

        Stop-loss Calculation
        Jab aap market mein enter ho jaty Hain, tu stop-loss ki value ko set krny Kay liye aapko last bearish candlestick ki closing values ko stop-loss ki limit select karna hota hai. Agr market is level ko break Kar jati hai, tu mazeed down ja sakhti hai

        Bearish Harami Candlestick
        Dear members Jab resistance level per last bullish candlestick Kay bad aik choti body wali bearish candlestick close hoti hai, tu isko aap bearish Harami Candlestick Pattern khety Hain Ya hamesha aik strong uptrend Kay bad resistance level per mil sakta hai
        Click image for larger version

Name:	download (6).png
Views:	10
Size:	4.4 کلوبائٹ
ID:	12347720

        Trading interpretation
        Is candlestick pattern ki trading interpretation ko effective banane Kay liye aapko is candlestick pattern ki proper identification krny Kay sath sath entry or exit sa related valuable information available honi cheye. Stop-loss ki value last bullish candlestick ki closing values hoti hai
        • #5 Collapse

          Re: Bullish And Bearish Harami Candlesticks

          Bearish candlestick jab be Banti hay tu ya market ko downfalls krti hay is lyia hum jab be Dekhay jay bearish candlestick ban rahi hay tu humari treading loss mein ja skti hay or jab be bullish candlestick dekha bnta huya tu market upfalls krti hay is lyia humay chyia jay bullish candlestick bnnay pr buy ki tread open kr dein forex treading mein bearish or bullish candlestick ka bhoat rolls hay in ko analysis kr jay hum ek achi treading Kr skta hein
          • #6 Collapse

            Re: Bullish And Bearish Harami Candlesticks

            Dear friend forex trading mein kam karte hue apni learning aur market ma focus kr ke working kr rahy ho gy dear Forex members jasy ke Ham sab janty hain ke forex ma ham jitna zada learn krty hain itna he ham is ma improve hoty jaty hain is liy hamen learning krty rahy chahie dear forex member main aj ap ke sath jis topic ko shear karna chahta us main be ham market ma bullish aur bearish harami candlestick ke bary learning karen gy ummid ha tamam dost apni apni achi post share krengy jis se ham sab ka faida hoga aur woh achay say samghen gay
            Bulish and beresh Candal stick ki pehchan


            Bearish candlestick jab be Banti hay tu yeh market ko downfalls krti hay is lyia hum jab be Dekhay jay bearish candlestick ban rahi hay tu humari treading loss mein ja skti hay or jab be bullish candlestick dekhen banty howy to market upfalls krti hay is lyia humaen chahye bullish candlestick bnnay pr buy ki tread open kr dein forex treading mein bearish or bullish candlestick ka bhoat rolls hay in ko analysis kar k hum ek achi tread ly sakty hain

            Click image for larger version

Name:	images (10).png
Views:	12
Size:	6.3 کلوبائٹ
ID:	12350808


            Bulish harami candlestick


            Dear friend yeh candlestick pattern 2 candlestick per banta hota hai Jab market mein aik strong downtrend banta hai, or last bearish candlestick Kay bad aik choti body wali candlestick banti hai, Jo bullish indication da rahi hoti hai, tu ya bullish Harami Candlestick Pattern ki formation ki indications bana rahi hoti hy

            Click image for larger version

Name:	images (11).png
Views:	11
Size:	34.9 کلوبائٹ
ID:	12350809

            Bearesh harami candlestick


            Dear friend Jab resistance level per last bullish candlestick Kay bad aik choti body wali bearish candlestick close hoti hai, tu isko aap bearish Harami Candlestick Pattern khety Hain Ya hamesha aik strong uptrend Kay bad resistance level per mil sakty hy

            Click image for larger version

Name:	images (12).png
Views:	3
Size:	31.7 کلوبائٹ
ID:	12350810
            Harami candlestick pattern per order place karna


            Is candlestick pattern ki trading interpretation ko effective banane Kay liye aapko is candlestick pattern ki proper identification krny Kay sath sath entry or exit sa related valuable information available honi cheye. Stop-loss ki value last bullish candlestick ki closing values hoti hy as per hum apna order place kar sakty hain
            • #7 Collapse

              Re: Bullish And Bearish Harami Candlesticks

              Assalamualaikum dear friends forex me hamen different Tarah ke pattrans diye Gaye hote Hain jinhen Ham follow karte hue Apne trading karte hain friends har pattern ka apna ek alag roll hai jo keh Forex trading mein play karta hai ISI Tarah friends bullish harami and bearish harami do Aisi candlestick pattern hai jinhen hamen apni trading ke liye samajhna bahut jaruri hota hai yah Bhi ek bahut aham pattern hai jisse Ham market ko jaan sakte hain vah kis direction mein move karegi isliye is post mein Main bullish harami aur bearish harami ke bare mein explain karungi to chale Ham apni post ko start karte Hain.

              ⚡Bullish harami candlestick in forex:
              Dear Forex members bullish harami candlestick generally do candles par consist karta hai ismein hota hai ki pahle candle bahut down jaati hai aur uske bad next candle jo hai vah up direction mein banti hai aise hi hota hai ki hamari market hamen reverse direction ka clue deti hai to hamen next apni trading karne ke liye aasani Ho jaati hai friends harami ek tarah ka Japanese word hai is ka mtlb Hy pregnant chat main Yaha candle ek pregnant women Ki Tarah show ki Gai hoti hai yani ke iski candle Jo down Hoti hai vah lambi Hoti hai pregnant women Ki Tarah aur jab ke uski dusri banne wali candle use women ke inner side baby Ki Tarah chhoti hoti hai yahi chij hamen bullish harami mein dikhai jaati hai Ki Kis Tarah se Ham isko Analyse karenge aap apne mind mein ek pregnant women ka sketch banaen to yah chij aapko yad rakhne mein help Dy gi ke Kis Tarah se chart mein Ham bullish harami candlestick ko identify kar sakte hain.

              Click image for larger version

Name:	IMG_20211122_123249.jpg
Views:	1
Size:	78.3 کلوبائٹ
ID:	12350822

              ⚡ Bearish harami candlestick:
              Dear Forex members sometimes aapane trading karte hue yeh dekha Hoga Ki market ka trend continues aap direction mein move kar raha hai aur ek situation aisi ati hai ki Jab Market full up Chali jaati hai to uske bad next candle chhoti si down direction mein banti hai to iska matlab yah ek bearish harami candlestick hai ismein hamen yah pata chalta hai ki market ki resistance level kya hai kahan tak market up direction mein move karti hai isliye friends Jab Bhi Aisa trend Ho jismein market pahle full up direction mein move Karti jaaye aur uske bad thoda sa Down mein move karegi tu yah trend apka bearish harami candlestick hoga.

              Click image for larger version

Name:	IMG_20211122_123146.jpg
Views:	1
Size:	62.6 کلوبائٹ
ID:	12350824

              ⚡Trade with bullish and bearish harami:
              Dear Forex members hmari forex market me yah to bearish harami candlestick banegi ya bullish harami candlestick banegi isliye hamen Gor karna hoga ki Kis Tarah se yah pattern banta hai aur is pattern ke banne per hamen kaun si trade market mein open Karni chahie yah dekhne ke liye main niche ek graph show Karti hun jismein bearish harami candlestick Ki movement ko alag show karungi aur bullish harami candlestick pattern ko alag picture mein show karungi Taki aapko samajhny mein help mil sake ke chart main Yaha donon pattern Kis Tarah se hote hain aur jab yah pattern banta hai to hamen kaun se time par kaun si trade open Karni chahie kyunki aap jante Hain Ki hamari trade ke liye trade ki direction bahut jyada valuable hoti hai ki kis direction mein hamen trade open Karni chahie Jab aap bearish aur bullish harami ko samajh jaenge to aapke liye trade key direction ko analyse karna bahut aasan ho jaega.

              Click image for larger version

Name:	IMG_20211122_124618.jpg
Views:	1
Size:	69.5 کلوبائٹ
ID:	12350825

              Click image for larger version

Name:	IMG_20211122_124601.jpg
Views:	1
Size:	89.2 کلوبائٹ
ID:	12350826
              • #8 Collapse

                Re: Bullish And Bearish Harami Candlesticks

                Dear members koi bhi pattern chor nahi sakte har pattern ki value hai samelike candle sticks ki hume samajh honi chahiye ye harami candlestick pattern aik Japanese candlestick pattern hai jo kay market main bullish both aur bearish short term signals produce karta hai hum iske mutabik trade karte hain Harami Candlestick pattern price action ke directions ky hisab say bullish ya bearish par hi mushtamil hota hai. Friend hum jante hai Harami candlestick pattern do candlesticks par mushtamil hota hai iski value char mein kafi zyada hai ye aik candlesticks bullish aur dosri bearish hoti hai ye hume maloom hai aur es hisaab say market ke bullish ya bearish direction ka andaza lagaya jata hai is candle ka kafi use hota hai.


                Bullish harami candlestick pattern:


                Ye candle pattern bhi behtareen hai bullish harami candlestick Pattern hum jante hain kak bearish trend reversal pattern hai acha work karti hai ye currency pairs aur commodities k price chart man jab bhi dekhte hain ye bearish trend k bottom per support level per commonly nazar aane wala pattern hai hum is pattern k mutabik trade karte hain.


                Identification of Bullish Harami Candlestick Pattern:


                Hume iski samajh honi chahiye ta ke chart mein dekhna chahiye bullish harami candlestick pattern hamesha 2 kisam ki candles se milkar banta hai es pattern mein dekha jata hai k first candle long real body ki black candle banti hai jo market mein yahan sellers k strong hold ko batati hai hum is tarah trade lete hain lakin second candle dekhne mein aik gap k sath first candle ki real body man se open hoti hai aur thora sa price change de ker first candle ki real body mein hum dekhte hain wahan he close deti hai aur aisa lagta hai k hamesha wahan pe hi black candle phragnant ho second candle ki real body first candle ki real body k k tarikan ak hi hissa se zyada nahi honi chahiye warna kaha jata hai k wahan pe ye pattern Bullish Harami nahi rahega aur trade signal b confirm nahi hoga.


                How to trade on harami candlestick pattern:


                Achi trade hum kar sakte hain is pe harami candlestick pattern dono bullish or bearish signals provide karti hai ye hame mind mein rakhna chahaiye yahan pe aya signals bullish hain ya bearish yeh hum candlestick pattern ko dekh kar asani se zariye pehchan sakte hain aur yahan trader mazeed iski information hasil akr sakty hain or apni tamam kisam ki trading skills improve kr k trading me kamiyab ho saktay hain ye faida hai. bs apko knowledge hona bohat zaroori hota hai.


                Harami candlestick pattern per order place karna:


                Is mein hum acha trading pattern dekh kar trade order place kar sakte hain es candlestick pattern ki trading interpretation ko effective banane kay liye zaroori hai k aapko is candlestick pattern ki proper achi si pehchan krny kay sath sath entry or exit sa related valuable information available honi chahiye aur trade karte trader ko chahiye k Stop-loss ki value last bullish candlestick ki closing values hoti hai aisa karna chahiye aur es per hum apna order place kar sakty hain.


                Click image for larger version

Name:	bullish and hrami.jpg
Views:	2
Size:	34.6 کلوبائٹ
ID:	12350851
                • #9 Collapse

                  Re: Bullish And Bearish Harami Candlesticks

                  Tamam members jante hain har candle ki apni value hai dear Forex members jasy ke hum sab janty hain ke forex ma ham jitna zada learn karty hain humara hi faida hota hai aur itna he ham is ma improve hoty jatay hain is liye behad zaroori hai hamen learning karty rahy chahie dear forex member aap se sab se mai aj ap ke sath jis topic to discuss karna chahta us ma be ham market ma bullish aur bearish candlestick ke bary learning karen gay isko proper se dekhte hain ummid ha tamam dost apni apni achi post share krengy jis se ham sab ka faida hoga.

                  Bullish harami candlestick pattern:


                  Bullish candle stick pattern important hai Bullish Harami candlestick Pattern 1 bearish trend reversal pattern hai ye market back ka batata hai ye currency pairs aur commodities k price chart meinn dono mein hi behtreen trades deta hai aur dono mein bearish trend k bottom per support level per commonly nazar any wala pattern hai hum dekh sakte hain.

                  Identification of Bullish Harami Candlestick Pattern:


                  Iski pehchan asan hai mushkil nahi hai Forex members bullish harami candlestick generally do candles par consist karta hai isi mein hota hai iski samajh honi aham hai is ki pahle candle bahut down jaati hai aur uske bad next candle jo hai woh yahan hamesha up direction mein banti hai aise hi hota hai ki hamari market hamen reverse direction ka prove asani se hi deti hai to hamen next apni trading karne ke liye aasan ho jaati hai kyun k indication mil jata hai friends harami ek tarah ka Japanese word hai is ka matlb hai pregnant chat main blkul proper aise hai candle ek pregnant women ki tarah show ki gai hoti hai hum ye maloom hona chahiye yani ke iski candle jo down Hoti hai woh lambi hoti hai.


                  Trade with bullish and bearish harami:


                  Forex members hamari forex market me ye to bearish harami candlestick banegi ya bullish harami candlestick banegi isliye hamen dekhna hota ha chart mein care se or karna hoga ki kis tarah se yah pattern banta hai ye shanahat honi chahiye sab ko aur is pattern ke banne per hamen kaun si trade market mein open karni chahie tabhi hum acha faida hasil karen gay yah dekhne ke liye main niche ek graph show karti hon jismein bearish harami candlestick ki movement ko alag show karunga takay samajh ajay aur bullish harami candlestick pattern ko alag picture mein show karungi thek se aap ko samajh ajay.

                  1. Price action:

                  Dear members hum achi tarah jante hain price action ka use hai jab prices Harami pattern main dosri candle sey nechay break hoti hain to aik short position li ja sakti hai ye candle trader ko acha faida deti hai ye Harami candlestick sy thora nechy stop-limit order dey kar kia ja sakta hai analysis mein inko use karna chahiye ye un traders k lye ideal hai jin k pass trade dekhny ka time nahi hai istarah kafi traders k risk ki bahut zyada ko dekhty hue stop-loss order Harami candlestick k uper rakh diya jata hai.


                  Click image for larger version

Name:	Bullish-Harami-Candlestick-Pattern-with-Stochastic-Oscillator.png
Views:	7
Size:	55.7 کلوبائٹ
ID:	12350876
                  • #10 Collapse

                    Re: Bullish And Bearish Harami Candlesticks

                    Candles ko samjhna bohut hi important kam hay dear forex members jesy kay ap jant hain agar ap candles ko samjhty hain to ap k liay foex me market ko analyse karna and profit gain karna asan hojata hay yahan sab say important kam market ko analyse karna hota hay aor best success bhi best knowledge say ati hay agar ap market ko analyse kar lain to jesy kay ap janty hain forex me successful hony kay liay candles ko samjhna bohut hi zarori hota hy jo members candles ko analyse karna jaty hian wo log market me successful hona bhi janty hian yani kay jald say jald khud ko strong bana lety hain jis say unhen loss nahi hota agar ho bhi jata hay loss to asani kay sath cover hojata hay jis say apka account save rehta hay.

                    Bullish Harami candlestick pattern
                    Reversal candles yani kay market ki direction ko change kar deny wali candles ko bullish candles ka name diya jata hay jis say apko market ky next move ka pata chal jata hay dear forex members apko chahiay kay hamesha market ko samjhen and best tariky say work kren is trah hi ap ki success hoskti hay bullish candles ko samjhna asan hay jab two candles banti jin me first candle red me hoti hay and uski shape and shadow bara hota hay and second candle red banti hay jiski shape and shadow small hota hy is say hamen easily pata chal jata hay kay down trend say market up trend me reverse krny lagi hay is say apko yeh faida hota hay kay ap usi time entry lay kar best profit hasil kar sakty hian us kay liay market ko analyse karna bohut hi important hy.
                    Click image for larger version

Name:	bullish-harami-on-the-japanese-price-chart.jpg
Views:	4
Size:	77.3 کلوبائٹ
ID:	12351168

                    Bearish Harami candlestick
                    Jesy kay ap candles ko analyse karna janty hain and reverse candles say waqif hain lakin yahan par kuch candles esi hoti hain jo bohut jald market ki movement ko change kar deti hay dear Forex members hamen bhi chahiy kay sab say strong kam kren and daily base ka kam kren and candles ko samjhen kew kay ap bearish candles jesi candles say waqif nahi hay jo pori market ki direction ko change kar deti hay agar apka account capital hay and ap risky trade kar chuky hain to apka account wash bhi hoskta hay isi liay bearish harami candles ko samjhna asan hay agar ap bearish candles ko samjhengy ko to ap jald say jald best and profitable trade kar payngy.
                    Click image for larger version

Name:	bearish-harami-pattern_body_BearishHaramipatternhighlightedbox.png.full.png
Views:	6
Size:	1.6 کلوبائٹ
ID:	12351169

                    Analyse And Use Of Bullish And Bearish Harami
                    Analyse karna bhi agar asan hojay ap k liay to market me entry mushkil jojati isi liay dear members sab say main point hay entry ka keh hamen entry kab and kha say leni hay and kesy leni hay is k liay hamen sab say pehly focus karna hoga pending orders par kew kay aksar hamen candles bhi dhoka day deti hian jiski wajah say hamen loss hojata hay isi liay candles ko watch karny kay bad hameen chhaiy kay wait kren best entry ka.
                    Click image for larger version

Name:	bearish-harami-stocks.jpg
Views:	2
Size:	10.5 کلوبائٹ
ID:	12351170
                    Last edited by ; 25-11-2021, 05:19 PM.
                    • #11 Collapse

                      Re: Bullish And Bearish Harami Candlesticks

                      bhot he amaizng sharing ki hain apne forex trading main ye sab jante hain k har traders ko kaam karna hai tu market main storng learning karna parta hain qk jaaab tak ek traders k pas strong learning nhe hoti hain tu market k trend ko kabi b follow nhe kar skte hain agar market k trend ko follow karna hain tu market main analysis karna hoga agar market main best learning k sath kaam kia jy tu kafi best earning ho skti hain trend ko follow karna must hain agar trend ko follow kar k kaam kia jata hain tu feature main kagi best benefit hasil ho skta hain forex trading main up trend and down trend hota hain jo b traders agar forex trading main kaam karta hain tu trend ko must follow karte hain qk bina trend follow kiye kamyabi nhe mil skti hain


                      How to Know Uptrend and Down trend In forex trading market:


                      forex trading main ek kamyab trader tab tak entry nhe karta hain jaab tak trend ko find neh kar lete hian qk agar market main trend up ka hota tu market main buy trade ko find kia jata hain forex trading kafi risk wala busniess hain jis b traders ne forex trading ko join kia hain wahi traders kafi strong learning k sath he kaam karte hain bullish trend and bearish trend ko analysis karna parta hain qk jaaab tak market main trend ko follow nhe kia jata hain tu kabi b benefit hasil nhe ho skta hain bullish trend main market up ki taraf move karti hain or hamrai candle ko find krna parta hain jaaab tak ek traders ko strong entry nhe milti hain tu kabi b entry nhe karni chahiye forex trading main down trend ko b follow karna parta hain agar market main trend down ka hota hain tu traders ko market main sell ki entry find karna parti hain forex trading main jaaab tak ek traders k pas candlestick ki knowladge nhe hoti hain worng entry le lete hain jis say loss ho jata hain


                      Click image for larger version

Name:	Bullish-Trend-Impulses-vs-Corrections.png
Views:	9
Size:	51.5 کلوبائٹ
ID:	12351185
                      • #12 Collapse

                        Re: Bullish And Bearish Harami Candlesticks

                        bhot he amaizng sharing ki hain apne forex exchanging principle ye sab jante hain k har dealers ko kaam karna hai tu market fundamental storng learning karna parta hain qk jaaab tak ek brokers k pas solid learning nhe hoti hain tu market k pattern ko kabi b follow nhe kar skte hain agar market k pattern ko follow karna hain tu market primary examination karna hoga agar market primary best learning k sath kaam kia jy tu kafi best procuring ho skti hain pattern ko pursue karna must hain agar direction ko follow kar k kaam kia jata hain tu highlight primary kagi best advantage hasil ho skta hain forex exchanging fundamental up pattern and down pattern hota hain jo b merchants agar forex exchanging fundamental kaam karta hain tu pattern ko should pursue karte hain qk bina direction follow kiye kamyabi nhe mil skti hain

                        Instructions to Know Uptrend and Down pattern In forex exchanging market:

                        forex exchanging principle ek kamyab dealer tab tak passage nhe karta hain jaab tak pattern ko find neh kar lete hian qk agar market primary pattern up ka hota tu market fundamental purchase exchange ko find kia jata hain forex exchanging kafi hazard wala busniess hain jis b merchants ne forex exchanging ko join kia hain wahi brokers kafi solid learning k sath he kaam karte hain bullish pattern and negative pattern ko examination karna parta hain qk jaaab tak market primary pattern ko follow nhe kia jata hain tu kabi b benefit hasil nhe ho skta hain bullish pattern fundamental market up ki taraf move karti hain or hamrai candle ko find krna parta hain jaaab tak ek merchants ko solid section nhe milti hain tu kabi b section nhe karni chahiye forex exchanging primary down pattern ko b pursue karna parta hain agar market primary direction down ka hota hain tu merchants ko market principle sell ki section find karna parti hain forex exchanging primary jaaab tak ek dealers k pas candle ki knowladge nhe hoti hain worng passage le lete hain jis say misfortune ho jata hain
                         
                        • #13 Collapse

                          Re: Bullish And Bearish Harami Candlesticks

                          Click image for larger version

Name:	bullish-harami-pattern_body_GBPUSDforexexample.png.full.png
Views:	29
Size:	6.7 کلوبائٹ
ID:	12365984Click image for larger version

Name:	Bearish-Harami-Example-Chart.png
Views:	15
Size:	16.7 کلوبائٹ
ID:	12366060Meaning of harami candle""

                          Harami Candlestick design ik Japanese candle design hai jo Kay market fundamental bullish aur negative transient signs produce karta hai. Harami Candlestick design value activity ke headings kay mutabiq bullish ya negative consider hota hai. Harami candle design two candles standard depend kerta hai. aik candles bullish aur dosri negative hoti hai aur es strategy say market ke bullish ya negative course ka surmise kiya jaata hai. es picture mei aap bullish aur negative Harami designs dekeh sakty ha.

                          Bearis/Negative Harami explaination:

                          Negative harami mein second flame ka size, design ki power ko anticipate karta hai Jitni ye light little ho gi us ki inversion ka chance utna ziada ho ga.Bearish harami ka inverse example bullish harami hai, jo k nechy ki taraf jata hai aur recommend karta hai k costs potential gain ki taraf turn around ho sakti hai.

                          Trading with "Bullish/Negative Harami Candlestick design":

                          Negative Harami fundamental exchange karty waqt agar murmur in chezo ka khayal rakhain, to acha result gain kar sakty hain Un mama sy kuch point nechy clarified hain

                          Price action activity in Harami candlestick....

                          Harami design fundamental dosri flame sy nechy break hoti hain, to aik short position li ja sakti hai Ye Harami candle sy thora nechy stop-limit request dy kar kia ja sakta hai, ye un dealers k lye ideal hai, jin k sit back nhi hai Traders k danger ki bhuk ko dekhty shade, stop-misfortune request Harami candle k uper, ya white candle k uper rakha ja sakta hai Profit ka target set krny k lye, support aur obstruction k region ko use kia ja sakta hai
                          dear traders, agar is design ko better comprehend kar lain aur es k sath dosry pointers bhi use kar lain, to achi exchange kar sakty hain aur misfortune sy bach k acha benefit acquire kar sakty hain Taham, is design principle better exchange karny k lye dosry market markers ka use lazmi karain..

                          Bullish harami candlestick....

                          dear friends, ye candle design two candle pe depend hota hai Jab market mein aik solid downtrend banta hai, or last negative candle Kay baad aik little body wali candle banti hai, Jo bullish sign de rahi hoti hai, tu ye bullish Harami Candlestick Pattern ki development ki signs de rahi hoti hai..
                          • #14 Collapse

                            Re: Bullish And Bearish Harami Candlesticks

                            bhot he amaizng sharing ki hain apne forex trading rule ye sab jante hain k har sellers ko kaam karna hai tu market central storng learning karna parta hain qk jaaab tak ek intermediaries k pas strong learning nhe hoti hain tu market k example ko kabi b follow nhe kar skte hain agar market k example ko follow karna hain tu market essential assessment karna hoga agar market essential best learning k sath kaam kia jy tu kafi best getting ho skti hain design ko seek after karna must hain agar bearing ko follow kar k kaam kia jata hain tu feature essential kagi greatest benefit hasil ho skta hain forex trading principal up design and down design hota hain jo b dealers agar forex trading major kaam karta hain tu design ko should seek after karte hain qk bina course follow kiye kamyabi nhe mil skti hain

                            Guidelines to Know Uptrend and Down design In forex trading market:

                            forex trading rule ek kamyab seller tab tak entry nhe karta hain jaab tak design ko find neh kar lete hian qk agar market essential example up ka hota tu market major buy trade ko find kia jata hain forex trading kafi risk wala busniess hain jis b vendors ne forex trading ko join kia hain wahi agents kafi strong learning k sath he kaam karte hain bullish example and negative example ko assessment karna parta hain qk jaaab tak market essential example ko follow nhe kia jata hain tu kabi b benefit hasil nhe ho skta hain bullish example central market up ki taraf move karti hain or hamrai flame ko find krna parta hain jaaab tak ek shippers ko strong segment nhe milti hain tu kabi b area nhe karni chahiye forex trading essential down design ko b seek after karna parta hain agar market essential course down ka hota hain tu traders ko market guideline sell ki segment find karna parti hain forex trading essential jaaab tak ek sellers k pas light ki knowladge nhe hoti hain worng section le lete hain jis say adversity ho jata hain
                             
                            • <a href="https://www.instaforex.org/ru/?x=ruforum">InstaForex</a>
                            • #15 Collapse

                              Re: Bullish And Bearish Harami Candlesticks

                              Gann Line

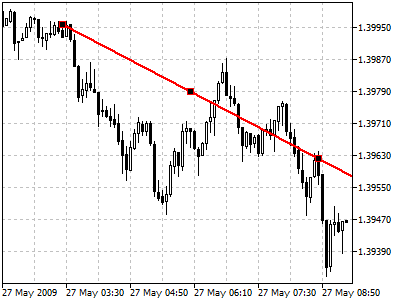
                              Gann Line represents a line drawn at the angle of 45 degrees. This line is also called "one to one" (1x1) what means one change of the price within one unit of time.
                              According to Gann’s concept, the line having the slope of forty-five degrees represents a long-term trendline (ascending or descending). While prices are above the ascending line, the market holds bull directions. If prices hold below the descending line, the market is characterized as a bear one. Intersection of the Gann Line usually signals of breaking the basic trend. When prices go down to this line during an ascending trend, time and price become fully balanced. The further intersection of Gann Line is the evidence of breaking of this balance and possible changing the trend.
                              Drawing

                              To draw the Gann line, one should select this object and then select an initial point in the chart. After that holding the mouse button one should draw a line in the necessary direction. Additional parameters will be shown near the cursor: distance from the initial point along the time axis, distance from the initial point along the price axis. Besides, during line construction additional vertical lines are shown for the accurate positioning of the initial and end point of the line.
                              Controls

                              On the line there are three points that can be moved by a mouse. By moving the first and the last points one can change the slope of a line, as well as its length (if "Ray Right" and "Ray Left" parameters are disabled in the object parameters). The central point (moving point) is used for moving the line in the chart without changing its length or slope.
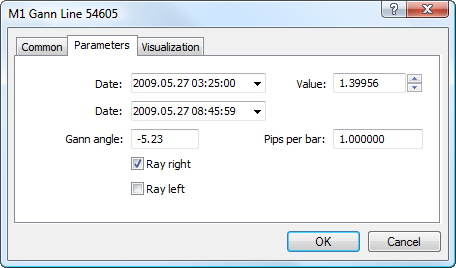
                              Parameters

                              There are the following parameters of the Gann Line:
                              • Date/Value — coordinates of the initial point (date/value of the price scale);
                              • Date — coordinates of the last point along the time axis;
                              • Gann Angle — slope angle of the Gann line relative to a horizontal line drawn through the initial point at the scale 1:1 (one price change to one time unit);
                              • Pips Per Bar — scale for plotting the Gann Line in a chart. Ratio of pips number to one bar;
                              • Ray Right — infinite duration of a trendline to the right;
                              • Ray Left — infinite duration of a trendline to the left.

                              اب آن لائن

                              Working...
                              X