Double bottom chart pattern ek bullish reversal pattern hai jo ek downtrend ke baad form hota hai. Yeh pattern indicate karta hai ke market ne apna bottom find kar liya hai aur ab price upar ki taraf move karne ki tayyari mein hai. Trading mein, double bottom pattern ka samajhna aur analyze karna ek valuable skill hai jo traders ko significant profits kamaane mein madad kar sakti hai.
Pattern Ki Basic Structure
Double bottom pattern do distinct lows se milkar banta hai jo almost equal hoti hain aur ek neckline se judti hain. Yeh structure W shape banati hai jo market ke do baar neeche jaane aur phir wapas upar bounce karne ko represent karti hai.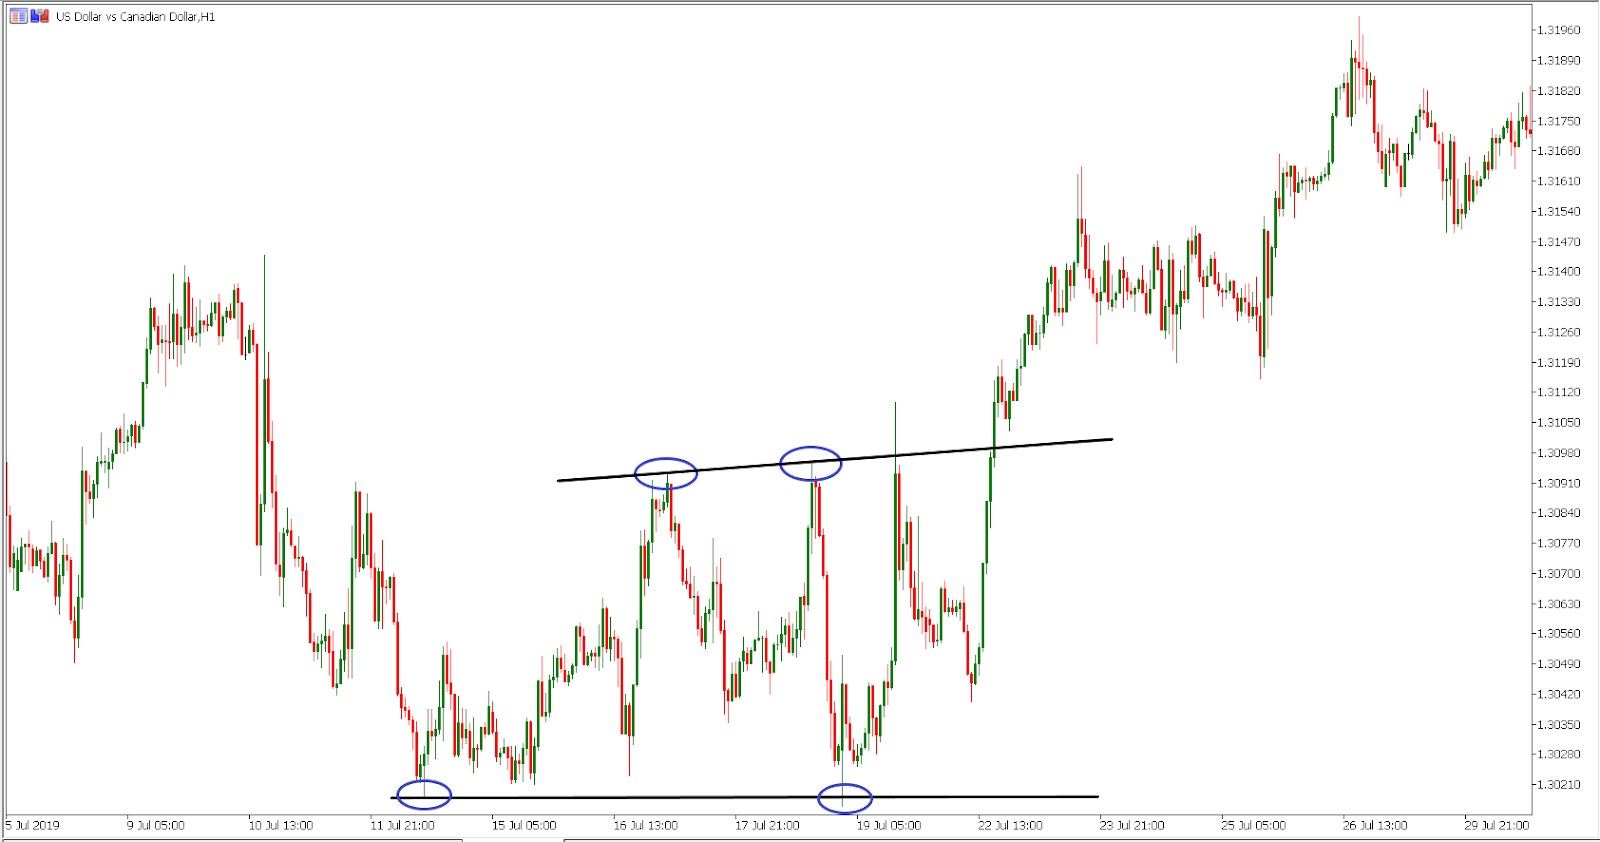
Pattern Identification
Double bottom pattern ko identify karne ke liye kuch important points hain jo traders ko yaad rakhne chahiye:
Double bottom pattern ko analyze karna trading decisions ko behtareen bana sakta hai. Yahaan kuch important steps diye gaye hain jo pattern analysis mein madad karte hain:
Double bottom pattern ko trade karna ek effective strategy ho sakta hai agar sahi tariqe se kiya jaye. Yahaan kuch steps diye gaye hain jo traders ko follow karne chahiye:
Volume analysis double bottom pattern mein ek significant role play karta hai. First bottom ke formation ke waqt high volume hona market mein selling climax ko indicate karta hai. Second bottom ke formation ke waqt low volume hona selling pressure ke khatam hone ko indicate karta hai. Breakout ke waqt high volume hona confirmation deta hai ke buyers ne control le liya hai aur price upar move karegi.
Market Sentiment
Double bottom pattern market sentiment ko effectively capture karta hai. First bottom ke time market mein extreme bearish sentiment hota hai jo significant selling pressure ko represent karta hai. Second bottom ke time sentiment thoda stabilize hota hai aur buying interest barh jaata hai. Breakout ke waqt bullish sentiment prevail kar jaata hai jo price ko upar push karta hai.
Example
Suppose ek stock ABC Corporation ka price downtrend mein hai aur $50 par ek low form karta hai. Price phir $60 tak bounce karti hai aur ek high form karti hai. Market phir neeche aati hai aur $50 ke aas-paas phir se low form karti hai. Yeh double bottom pattern ka formation hai. Price $60 ke neckline ko breakout karti hai aur upar move karti hai. Trader is point par buy entry le sakta hai aur stop loss $50 ke neeche set kar sakta hai. Target price ko $60 se $50 tak ke distance ko calculate karke set kiya ja sakta hai.
Limitations
Jitna bhi effective double bottom pattern ho, uske kuch limitations bhi hain jo traders ko yaad rakhni chahiye:
Double bottom pattern ko doosre technical indicators ke sath combine karna ek effective strategy hai. For example, moving averages ko use karke trend direction ko identify karna, volume indicators se pattern ko confirm karna, aur Fibonacci retracement levels se target prices ko set karna trading ko zyada reliable aur profitable bana sakta hai. Suppose ek forex pair, EUR/USD, ek downtrend mein trade kar raha hai aur ek point par $1.1000 par low form karta hai. Price $1.1200 tak bounce karti hai aur phir neeche aakar phir se $1.1000 ke aas-paas low form karti hai. Yeh double bottom pattern ka formation hai. Price $1.1200 ke neckline ko breakout karti hai aur upar move karti hai. Trader is point par buy entry le sakta hai aur stop loss $1.1000 ke neeche set kar sakta hai. Target price ko $1.1200 se $1.1000 tak ke distance ko calculate karke set kiya ja sakta hai.
Risk Management
Risk management ka double bottom pattern ko trade karte waqt significant role hota hai. Proper risk management techniques jaise ke position sizing, stop loss placement, aur risk/reward ratio ko follow karna zaroori hai taake potential losses ko minimize kiya ja sake aur trading capital ko preserve kiya ja sake. Double bottom chart pattern trading mein ek powerful tool hai jo market ke bullish reversal ko indicate karta hai. Is pattern ka sahi istemaal karne ke liye traders ko uska structure, identification points, aur trading strategy ko acche se samajhna chahiye. Saath hi, risk management techniques aur confirmation indicators ka istimaal karke successful trades ki probability increase ki ja sakti hai. Double bottom pattern ki limitations ko bhi yaad rakhna chahiye taake informed decisions liye ja sake aur trading mein consistently profitable ban sake.
Pattern Ki Basic Structure
Double bottom pattern do distinct lows se milkar banta hai jo almost equal hoti hain aur ek neckline se judti hain. Yeh structure W shape banati hai jo market ke do baar neeche jaane aur phir wapas upar bounce karne ko represent karti hai.
- First Bottom: Market downtrend mein hota hai aur ek low form karta hai.
- High between the Bottoms: Price pehle bottom se bounce karke upar move karti hai aur ek high form karti hai.
- Second Bottom: Market phir neeche aati hai aur doosra bottom form karti hai jo pehle bottom ke aas-paas hota hai.
- Neckline: High between the bottoms ko horizontal line ke through connect kiya jata hai jo neckline banati hai.
- Breakout: Jab price doosre bottom ke baad neckline ko cross karti hai, to ek bullish breakout hota hai jo trend reversal ko confirm karta hai.
Pattern Identification
Double bottom pattern ko identify karne ke liye kuch important points hain jo traders ko yaad rakhne chahiye:
- Downtrend: Pattern hamesha ek downtrend ke baad form hota hai. Yeh pattern tab significant hota hai jab market already neeche ja rahi ho.
- Equal Bottoms: Dono bottoms ka almost equal hona zaroori hai. Agar bottoms significantly different hain, to pattern weak ho sakta hai.
- Volume: Volume bhi ek important factor hai. First bottom ke time volume zyada hona chahiye, jabke second bottom ke time volume kam hota hai. Breakout ke waqt volume phir se increase hona chahiye.
Double bottom pattern ko analyze karna trading decisions ko behtareen bana sakta hai. Yahaan kuch important steps diye gaye hain jo pattern analysis mein madad karte hain:
- Identify the Downtrend: Sabse pehle market ka downtrend identify karna zaroori hai. Yeh pattern sirf tab meaningful hota hai jab market downtrend mein ho aur lows form kar rahi ho.
- Locate the Bottoms: Dono bottoms ko locate karna aur inki symmetry check karna zaroori hai. Dono bottoms ka equal ya aas-paas hona pattern ki reliability ko badhata hai.
- Draw the Neckline: High between the bottoms ko connect karke neckline draw karna. Yeh neckline breakout ke waqt ek important resistance level ban jaati hai.
- Volume Confirmation: Volume ka analysis karna zaroori hai. First bottom ke time high volume hona aur second bottom ke time low volume hona bullish reversal ko indicate karta hai. Breakout ke waqt high volume hona bhi confirmation deta hai.
- Breakout Confirmation: Neckline ke breakout ko wait karna aur confirmation lene ke baad trade entry lena. Breakout ke baad price ka upar move hona zaroori hai taake pattern validate ho sake.
Double bottom pattern ko trade karna ek effective strategy ho sakta hai agar sahi tariqe se kiya jaye. Yahaan kuch steps diye gaye hain jo traders ko follow karne chahiye:
- Entry Point: Entry point wohi hona chahiye jab price neckline ko breakout kare aur uske upar close ho. Yeh confirmation deta hai ke bullish reversal start ho gaya hai.
- Stop Loss: Stop loss set karna zaroori hai taake agar trade galat direction mein jaye to aapki losses limited rahein. Typically, stop loss second bottom ke neeche lagana chahiye.
- Target Price: Target price ko neckline se le kar bottom tak ke distance ko calculate karke set karna chahiye. Yeh profit target realistic hota hai aur pattern ki height ko represent karta hai.
Volume analysis double bottom pattern mein ek significant role play karta hai. First bottom ke formation ke waqt high volume hona market mein selling climax ko indicate karta hai. Second bottom ke formation ke waqt low volume hona selling pressure ke khatam hone ko indicate karta hai. Breakout ke waqt high volume hona confirmation deta hai ke buyers ne control le liya hai aur price upar move karegi.
Market Sentiment
Double bottom pattern market sentiment ko effectively capture karta hai. First bottom ke time market mein extreme bearish sentiment hota hai jo significant selling pressure ko represent karta hai. Second bottom ke time sentiment thoda stabilize hota hai aur buying interest barh jaata hai. Breakout ke waqt bullish sentiment prevail kar jaata hai jo price ko upar push karta hai.
Example
Suppose ek stock ABC Corporation ka price downtrend mein hai aur $50 par ek low form karta hai. Price phir $60 tak bounce karti hai aur ek high form karti hai. Market phir neeche aati hai aur $50 ke aas-paas phir se low form karti hai. Yeh double bottom pattern ka formation hai. Price $60 ke neckline ko breakout karti hai aur upar move karti hai. Trader is point par buy entry le sakta hai aur stop loss $50 ke neeche set kar sakta hai. Target price ko $60 se $50 tak ke distance ko calculate karke set kiya ja sakta hai.
Limitations
Jitna bhi effective double bottom pattern ho, uske kuch limitations bhi hain jo traders ko yaad rakhni chahiye:
- False Signals: Kabhi kabhi double bottom pattern false signals bhi de sakta hai. Yeh tab hota hai jab neckline ka breakout confirm nahi hota aur price wapas neeche aati hai.
- Market Conditions: Yeh pattern trending markets mein zyada reliable hota hai. Sideways ya choppy markets mein inka reliability kam ho sakti hai.
- Timeframe: Different timeframes par double bottom pattern ki effectiveness vary kar sakti hai. Higher timeframes par patterns zyada reliable ho sakte hain banisbat lower timeframes ke.
Double bottom pattern ko doosre technical indicators ke sath combine karna ek effective strategy hai. For example, moving averages ko use karke trend direction ko identify karna, volume indicators se pattern ko confirm karna, aur Fibonacci retracement levels se target prices ko set karna trading ko zyada reliable aur profitable bana sakta hai. Suppose ek forex pair, EUR/USD, ek downtrend mein trade kar raha hai aur ek point par $1.1000 par low form karta hai. Price $1.1200 tak bounce karti hai aur phir neeche aakar phir se $1.1000 ke aas-paas low form karti hai. Yeh double bottom pattern ka formation hai. Price $1.1200 ke neckline ko breakout karti hai aur upar move karti hai. Trader is point par buy entry le sakta hai aur stop loss $1.1000 ke neeche set kar sakta hai. Target price ko $1.1200 se $1.1000 tak ke distance ko calculate karke set kiya ja sakta hai.
Risk Management
Risk management ka double bottom pattern ko trade karte waqt significant role hota hai. Proper risk management techniques jaise ke position sizing, stop loss placement, aur risk/reward ratio ko follow karna zaroori hai taake potential losses ko minimize kiya ja sake aur trading capital ko preserve kiya ja sake. Double bottom chart pattern trading mein ek powerful tool hai jo market ke bullish reversal ko indicate karta hai. Is pattern ka sahi istemaal karne ke liye traders ko uska structure, identification points, aur trading strategy ko acche se samajhna chahiye. Saath hi, risk management techniques aur confirmation indicators ka istimaal karke successful trades ki probability increase ki ja sakti hai. Double bottom pattern ki limitations ko bhi yaad rakhna chahiye taake informed decisions liye ja sake aur trading mein consistently profitable ban sake.

تبصرہ
Расширенный режим Обычный режим