Parabolic SAR (Stop and Reverse) ek technical analysis ka indicator hai jo traders ko market ke trend ki direction aur potential reversal points ko identify karne mein madad karta hai. Is indicator ko J. Welles Wilder Jr. ne develop kiya tha, aur ye khas tor par trending markets mein kaam karta hai. Iski khasiyat ye hai ke ye price movement ke saath saath adjust hota hai aur traders ko entry aur exit points dikhata hai.
Parabolic SAR Ka Kaam
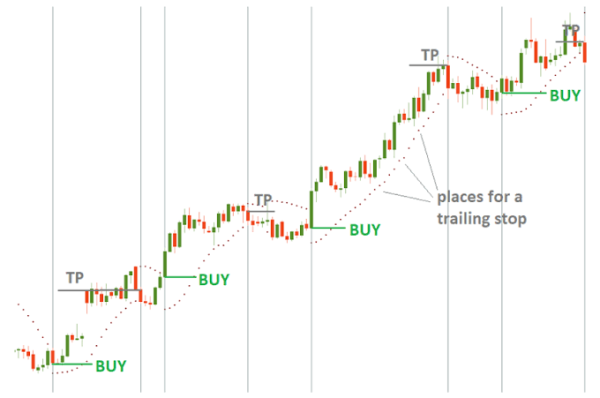
Parabolic SAR ko price chart par ek series of dots ki shakal mein dikhaya jata hai. Ye dots price ke upar ya neeche hote hain, jo market ki current trend ki direction ko darshate hain. Agar dots price ke neeche hain, to ye bullish trend ko darshata hai, jabke agar ye price ke upar hain, to ye bearish trend ko darshata hai. Is tarah se, ye indicator traders ko ye samajhne mein madad karta hai ke kab market mein trend reverse ho sakta hai.
SAR Ka Calculation
Parabolic SAR ka calculation thoda complex hai lekin basic concept ye hai ke ye price ke high aur low ko track karta hai aur ek acceleration factor ke sath combine karta hai. Jab market bullish hota hai, to SAR price ke neeche hota hai aur jab market bearish hota hai, to SAR price ke upar hota hai. SAR ki value ko calculate karne ke liye, traders ko kuch parameters set karne padte hain, jaise ki:
Parabolic SAR ka istemaal karne ke liye, traders ko kuch important points ka khayal rakhna chahiye:
Jis tarah kisi bhi technical indicator ke apne limitations hote hain, waise hi Parabolic SAR bhi kuch challenges ka samna karta hai:
Parabolic SAR ek powerful tool hai jo traders ko market ke trend ko samajhne aur potential reversal points ko identify karne mein madad karta hai. Iska istemaal karte waqt traders ko market ki overall condition aur dusre technical indicators ke sath mil kar kaam karna chahiye. Isse unhe better decisions lene mein madad milegi aur unki trading strategies ko enhance karne ka mauka milega.
Parabolic SAR Ka Kaam
Parabolic SAR ko price chart par ek series of dots ki shakal mein dikhaya jata hai. Ye dots price ke upar ya neeche hote hain, jo market ki current trend ki direction ko darshate hain. Agar dots price ke neeche hain, to ye bullish trend ko darshata hai, jabke agar ye price ke upar hain, to ye bearish trend ko darshata hai. Is tarah se, ye indicator traders ko ye samajhne mein madad karta hai ke kab market mein trend reverse ho sakta hai.
SAR Ka Calculation
Parabolic SAR ka calculation thoda complex hai lekin basic concept ye hai ke ye price ke high aur low ko track karta hai aur ek acceleration factor ke sath combine karta hai. Jab market bullish hota hai, to SAR price ke neeche hota hai aur jab market bearish hota hai, to SAR price ke upar hota hai. SAR ki value ko calculate karne ke liye, traders ko kuch parameters set karne padte hain, jaise ki:
- Acceleration Factor (AF): Ye parameter market ke momentum ko track karne mein madad karta hai. Ye aam tor par 0.02 se shuru hota hai aur maximum 0.2 tak ja sakta hai.
- Extreme Point (EP): Ye highest high ya lowest low ko darshata hai jo trend ke doran achieve kiya gaya ho.
Parabolic SAR ka istemaal karne ke liye, traders ko kuch important points ka khayal rakhna chahiye:
- Trend Identification: Jab SAR dots price ke neeche hote hain, to ye bullish trend ko darshata hai. Is waqt traders ko long positions lene ki salah di jati hai. Jab SAR dots price ke upar hote hain, to ye bearish trend ko darshata hai, aur traders ko short positions lene ki salah di jati hai.
- Exit Points: Parabolic SAR ko exit points ke liye bhi istemaal kiya ja sakta hai. Jab SAR dots price ko cross karte hain, to ye ek potential reversal signal hota hai. Traders ko is waqt apni positions close karne par vichar karna chahiye.
- Risk Management: Parabolic SAR ko stop-loss orders set karne ke liye bhi use kiya ja sakta hai. Jab market aapki position ke khilaf chalta hai, to aap SAR ki value ko apne stop-loss ke liye reference point ki tarah istemaal kar sakte hain.
Jis tarah kisi bhi technical indicator ke apne limitations hote hain, waise hi Parabolic SAR bhi kuch challenges ka samna karta hai:
- Choppy Markets: Parabolic SAR choppy ya sideways markets mein effective nahi hota, kyunki is waqt price ke movements unpredictable hote hain aur ye inaccurate signals de sakta hai.
- Lagging Indicator: Ye ek lagging indicator hai, matlab ye price action ke baad react karta hai. Is wajah se kabhi kabhi late signals milte hain, jiski wajah se traders ko potential profits miss ho sakte hain.
Parabolic SAR ek powerful tool hai jo traders ko market ke trend ko samajhne aur potential reversal points ko identify karne mein madad karta hai. Iska istemaal karte waqt traders ko market ki overall condition aur dusre technical indicators ke sath mil kar kaam karna chahiye. Isse unhe better decisions lene mein madad milegi aur unki trading strategies ko enhance karne ka mauka milega.
:max_bytes(150000):strip_icc():format(webp)/dotdash_Final_Introduction_to_the_Parabolic_SAR_Nov_2020-01-c85bdb2490ad46949ddf4523b017ecdf.jpg)
:max_bytes(150000):strip_icc():format(webp)/dotdash_Final_Introduction_to_the_Parabolic_SAR_Nov_2020-02-adb6388405a44229a45a755673b9301e.jpg)


تبصرہ
Расширенный режим Обычный режим