On Neck Chart Pattern.

No announcement yet.
`
X
  • وقت
  • دکھائیں
Clear All
new posts
  • #1 Collapse

    On Neck Chart Pattern.
    Brief Description.

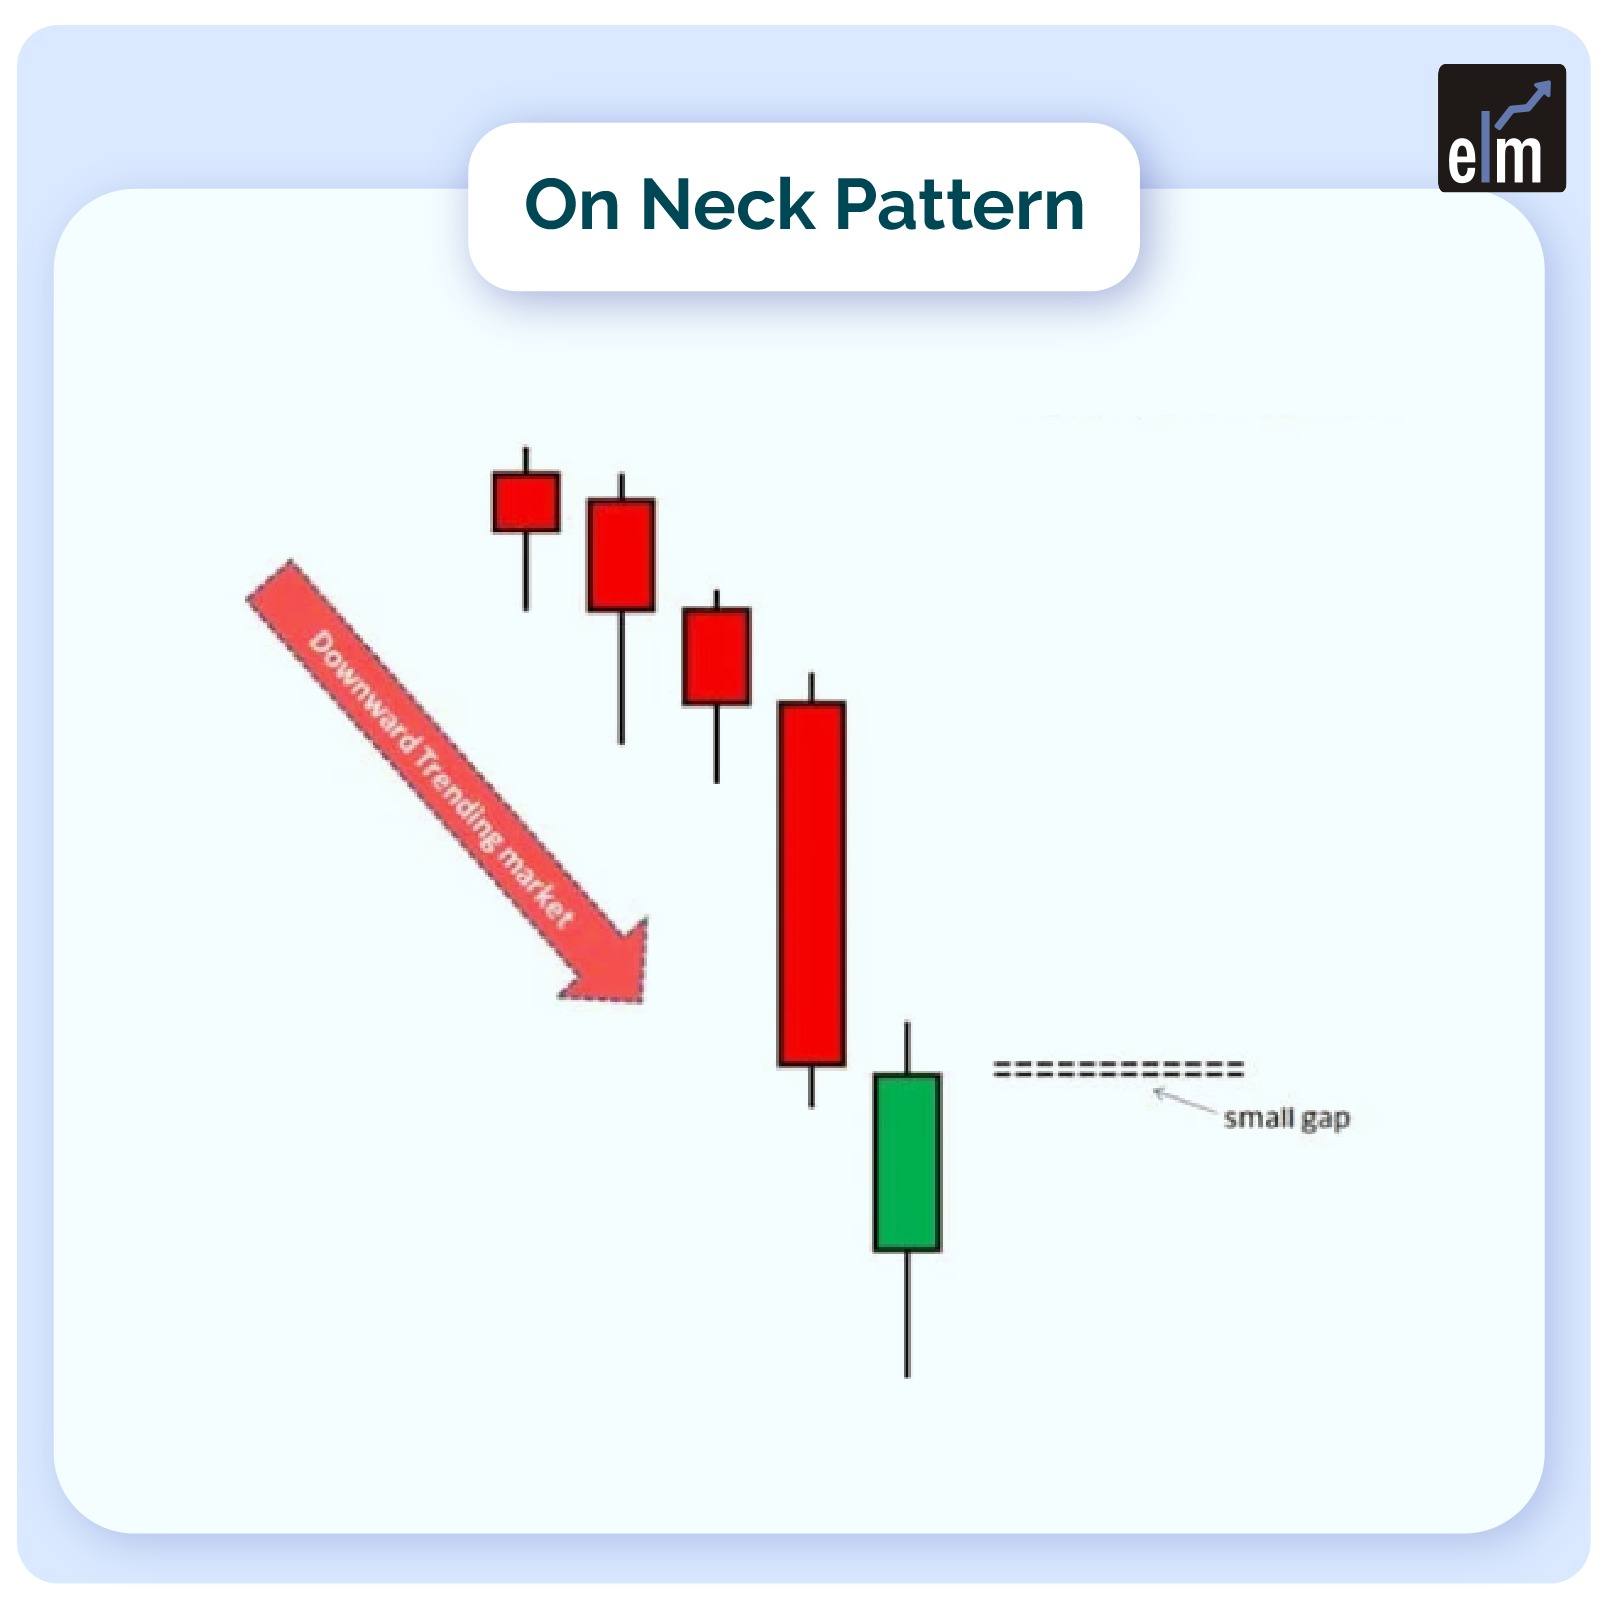
    On Neck candlesticks chart pattern ka taluq 2 candlesticks se hota hai. Pehli candlestick lambi bearish hoti hai jo market mein girawat ko show karti hai aur doosri candlestick chhoti bullish ya neutral hoti hai jo pehli candlestick ke niche close hoti hai. Yeh pattern aksar bearish trend ke continuation ka ishara deta ha Basically yea short-term continuation pattern hota hai jo financial markets mein zyada tar downtrend ke dauran dekha jata hai. Is Traders is pattern ka use karte hain taake short-term opportunities ko samajh sakein aur apne trades plan karein.


    Structure of Trading Partner.

    On the Neck pattern main 2nd candlestick pehli candlestick ke body ke bilkul near close hoti hai, toh isay "On Neck" kehte hain. Yeh pattern aksar market mein uncertainty ko show karta hai jahan buyers aur sellers mein tug-of-war hoti hai. Pehli candlestick ka lamba bearish body price mein girawat ko zahir karta hai, lekin doosri candlestick ka chhota bullish body ye signal deta hai ke price temporarily ruk gaya hai. Yeh pattern tab banta hai jab market ke sentiments abhi bearish hote hain, magar kuch bullish interest bhi hota hai.


    Trading Strategy.

    Traders aksar Neck candlesticks chart agar price ooper break kare, toh yeh sign hota hai ke downtrend khatam ho sakta hai. Is pattern ke analysis ke liye, volume ka observation bhi zaroori hota hai. Agar volume high ho pehli candlestick ke dauran aur low ho doosri candlestick mein toh yeh bearish continuation ke liye zyada reliable hota hai.
    pattern ko price action ke sath mila ke dekhte hain. Jab yeh pattern appear hota hai, to aksar iska matlab hota hai ke price girne wala hai. Is pattern ke baad agar price neeche break kare, toh yeh short-selling ka mauqa de sakta hai.
  • <a href="https://www.instaforex.org/ru/?x=ruforum">InstaForex</a>
  • #2 Collapse

    On Neck Chart Pattern

    Introduction

    On Neck Chart Pattern ek bearish continuation pattern hai jo aksar downtrend me nazar aata hai. Ye pattern price action ke continuation ka ishara deta hai aur traders ko market ke next move ko samajhne me madad karta hai.

    Pattern ka Structure

    Is pattern ka structure 2 candles par mabni hota hai:
    1. Pehli candle ek bari bearish candle hoti hai jo price girne ka pata deti hai.
    2. Dusri candle choti bullish ya neutral hoti hai jo pehli candle ke close ke kareeb end hoti hai. Iska low pehli candle ke low se upar hota hai, lekin close pehli candle ke close ke barabar hota hai.
    Identification Of On Neck patterns

    Is pattern ko identify karne ke liye:
    • Yeh aksar ek downtrend ke dauran banta hai.
    • Pehli candle strong bearish honi chahiye.
    • Dusri candle choti bullish ya neutral honi chahiye aur close pehli candle ke barabar ya thoda upar ho.
    • Volume pehli candle par ziada hota hai aur dusri candle par kam.


    Trading Strategies
    1. Confirmation ka Intizar: Pattern complete hone ke baad agle din ke price action ka intizar karein. Agar price neeche girta hai, to sell trade enter karein.
    2. Stop Loss: Stop loss ko dusri candle ke high ke upar lagayen.
    3. Target Setting: Target previous support ya Fibonacci extension levels par set karein.
    4. Risk Management: Hamesha apne risk-to-reward ratio ka khayal rakhein aur position size ko manage karein.

    Conclusion

    On Neck Chart Pattern ek simple aur asaan bearish continuation pattern hai jo traders ko price ke girne ke signals deta hai. Lekin, is pattern ko trade karte waqt confirmation ka intizar aur strong risk management zaroori hai.
    • #3 Collapse

      Neck Chart Pattern Kya Hai?

      Neck chart pattern trading ke andar ek price action pattern hai jo ziada tar continuation ya reversal signals dene ke liye use hota hai. Ye pattern aksar price charts me tab samne aata hai jab market kisi specific trend ke andar move kar raha ho. Neck chart pattern ke do main types hain: bullish neck pattern aur bearish neck pattern. Dono patterns ka analysis karte waqt traders market ke trend aur price levels ka dhyan rakhte hain taake sahi decision le sakein.


      Bullish Neck Pattern

      Bullish neck pattern aksar downtrend ke baad samne aata hai aur ye is baat ki nishani hoti hai ke price ab upar jaane wala hai. Is pattern ke andar pehle ek bearish candle banti hai jo price ke girne ka signal deti hai, magar uske baad ek chhoti bullish candle banti hai jo is baat ka indication hota hai ke market me demand barh rahi hai. Bullish neck pattern dekh kar traders aksar buying position lete hain kyun ke ye future price increase ka signal hota hai.


      Bearish Neck Pattern

      Bearish neck pattern ka zikar tab hota hai jab market ek uptrend me ho lekin us trend ka reversal expected ho. Is pattern ke andar pehle ek bullish candle banti hai jo price ke barhne ka signal deti hai, magar uske baad ek chhoti bearish candle banti hai jo selling pressure ka signal deti hai. Bearish neck pattern aksar un traders ke liye useful hota hai jo short-selling ya apne profits ko lock karna chahte hain.

      Neck Chart Pattern Ki Ahmiyat

      Neck chart pattern technical analysis ke tools me se ek aham hissa hai, jo traders ko price movement ke bare me valuable insights deta hai. Ye pattern un situations me madad karta hai jahan market me uncertainty ho aur trend ka pata lagana mushkil ho. Neck pattern ka sahi use karne ke liye traders ko candlestick analysis, support aur resistance levels, aur volume analysis ka dhyan rakhna zaroori hota hai. Ye pattern short-term aur long-term trading strategies dono ke liye kaam karta hai, is wajah se ye professional aur beginner traders dono ke liye popular hai.
      • #4 Collapse

        On Neck Chart Pattern

        Dear Friends and Fellows, Neckline chart pattern aik technical analysis ka concept hey jo trading me use hota hey, khas tor par Head & Shoulders aur Double Top/Bottom patterns me. Yeh traders ko trend reversal aur breakout points pehchan’nay me madad deta hey. Forex trading man trader currency pairs aur commodities ki price movements ko smajhny k liye price chart ko read kerta ha, q price chart patterns man changes, momentum aur price k trend man change ko accuracy k sath identify kerta ha. Candlestick Patterns currency pairs aur commodities k price chart man price ki movement ko track kerna k liye use hona wala most important technical tool ha. Forex trading man trader kisi b currency pair ya commodity ko buy/sell kerna k liye candlestick patterns per depend kerta ha. Aj man apka sath ak important trend continuation pattern per trading k related apna knowledge share karta hun.

        Neckline Ke Different Types
        Head & Shoulders (H&S) Neckline

        Formation: Pehlay aik chhoti peak (shoulder), phir aik badi peak (head), aur phir phir se chhoti peak (shoulder).
        Neckline: Do lowest troughs (neechy ke points) ko milanay wali line.
        Breakout Direction: Neechy (Bearish).

        Inverse Head & Shoulders Neckline
        Formation: Pehlay aik halka dip (shoulder), phir sab se neechy dip (head), aur phir phir se halka dip (shoulder).
        Neckline: Do highest points ko milanay wali resistance line.
        Breakout Direction: Upar (Bullish).

        Double Top Neckline
        Formation: Do peaks jo almost ek level pe hoti hein.
        Neckline: In peaks ke neechy aik support line hoti hey.
        Breakout Direction: Neechy (Bearish).

        Double Bottom Neckline
        Formation: Do troughs jo almost ek level pe hoti hein.
        Neckline: In troughs ke upar aik resistance line hoti hey.
        Breakout Direction: Upar (Bullish).

        Neckline Trading Me Kaisy Use Hoti Hey?
        Entry Point: Jab price neckline tod kar strong volume ke saath breakout kare.
        Stop Loss: Neckline ke thora upar ya neechy set kare taake risk manage ho.
        Target Price: Head (ya peak/trough) aur neckline ke darmiyan ka distance measure kare aur usko breakout ke agay project kare.

           
        • #5 Collapse

          On Neck Chart Pattern ek candlestick chart pattern hai jo primarily bearish reversal signal dene ke liye jaana jaata hai. Yeh pattern aksar uptrend ke baad banta hai aur yeh indicate karta hai ke market me reversal ho sakta hai, matlab price neeche jaane ki taraf move kar sakta hai.


          On Neck Pattern ki Details:

          Formation:

          First Candle: Ek long bullish candle hoti hai jo uptrend ko show karti hai.

          Second Candle: Ek small bearish candle hoti hai jo first candle ke close ke aas paas (ya uske thoda neeche) close hoti hai. Is candle ki closing price pehla candle ki closing price ke bilkul neeche hoti hai.


          Significance:

          Yeh pattern tab banta hai jab market ne pehle uptrend dekha ho aur uske baad ek small bearish candle close hoti hai jo bullish momentum ko weak karti hai.

          Is pattern ka main focus yeh hai ke second candle pehli candle ke close price ke bilkul neeche close karti hai, jo bearish reversal ka signal hai.


          Confirmation:

          On Neck pattern tabhi valid mana jata hai jab agle trading session me market neeche ki taraf move kare, yani price continue kare downtrend ki taraf.

          Agar price second candle ke baad upar jata hai, to yeh pattern fail ho sakta hai aur reversal ka signal nahi milta.


          Trading Strategy:

          Agar aap On Neck pattern dekhte hain, to aap bearish trade enter kar sakte hain, lekin confirm hone ke liye aapko next candle ka wait karna chahiye.

          Risk ko minimize karne ke liye, aap stop loss ko recent high ke upar rakh sakte hain.


          Example:

          Agar market kisi stock ka price 1000 se badhkar 1200 tak gaya ho, aur phir next day ek small bearish candle 1190 ke aas paas close ho jaye, to yeh On Neck pattern ban sakta hai.

          Yeh pattern market mein short-term bearish reversal ko signal karta hai, lekin isse pehle aur baad ki market conditions ko bhi dekhna zaroori hota hai.
          • #6 Collapse


            On Neck Chart Pattern

            Introduction

            On Neck Chart Pattern ek bearish continuation pattern hai jo financial markets mein aksar nazar aata hai. Ye pattern tab banta hai jab price ek downward trend mein ho aur is baat ki nishani de raha ho ke price mazeed neeche gir sakta hai. Iska analysis aksar short-term aur intraday traders ke liye faydemand hota hai.


            Identification

            On Neck Pattern ko identify karne ke liye ye points dekhna zaroori hai:
            1. Pehli Candle
              • Lambi aur bearish hoti hai (red candle).
              • Price neeche close karta hai jo strong selling pressure ko show karta hai.
            2. Doosri Candle
              • Choti aur bullish hoti hai (green candle).
              • Iska close pehli candle ke low ke level par hota hai ya uske bilkul kareeb.
              • Price temporarily stabilize hoti hai magar trend neeche ka hi rehta hai.
            3. Trend:
              • Ye pattern hamesha ek downward trend ke doran hi banta hai.

            Trading Strategies
            1. Entry Point:
              • Jab pattern ke baad price neeche breakout kare, tab short-selling (sell position) initiate karein.
              • Confirmation ke liye agle candle ka bearish hona zaroori hai.
            2. Stop Loss:
              • Stop loss pattern ke high point ke thoda upar set karein taake unnecessary losses se bacha ja sake.
            3. Profit Target:
              • Apni target price downward trend ke support levels ko dekh kar set karein.
              • Fibonacci extension ya previous support levels ka use karna madadgar ho sakta hai.
            4. Volume Analysis:
              • Pehli candle mein zyada volume aur doosri candle mein kam volume hona confirmation ko aur mazboot banata hai.

            Conclusion


            On Neck Chart Pattern ek reliable tool hai jo bearish continuation ko signal karta hai. Is pattern ka sahi analysis aur breakout ka intezar karna zaroori hai taake profitable trades kiya ja sake. Is pattern ka istemal technical analysis ke saath milakar kiya jaye toh trading decisions zyada accurate ho sakte hain.
            • <a href="https://www.instaforex.org/ru/?x=ruforum">InstaForex</a>
            • #7 Collapse

              On Neck Chart Pattern ek candlestick pattern hota hai jisme pehli candlestick bearish (down) aur doosri candlestick bullish ya neutral hoti hai, jo pehli candlestick ke niche close hoti hai. Yeh pattern aksar bearish trend ke continuation ko dikhata hai aur short-term downtrend mein dekha jata hai. Traders is pattern ko short-term opportunities ko samajhne aur apne trades plan karne ke liye use kren.

              اب آن لائن

              Working...
              X