Bullish aur Bearish Candlestick Patterns
Agar aap stock market ya forex trading me dilchaspi rakhte hain, to aapko candlestick patterns ka samajh hona zaroori hai. Yeh patterns market ke trends aur price action ko samajhne ka ek ahem zariya hain. Inme do important categories hain: Bullish aur Bearish candlestick patterns. Aayiye inka tafseel se farq samajhte hain.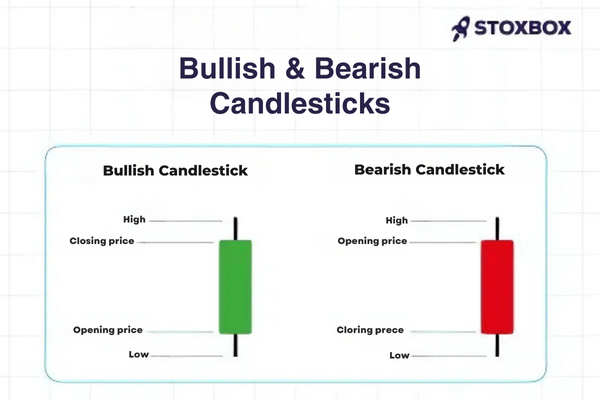
Bullish Candlestick Pattern
Bullish candlestick pattern ka matlab hai ke market ka trend upar ki taraf ja raha hai, ya price barhne wali hai. Yeh pattern tab banta hai jab buyers (kharidne wale) market me zyada dominate karte hain. Iska matlab hai ke demand zyada hai aur price upar jane ka chance hai.
Key Features of Bullish Patterns
1. Opening Price: Kam hoti hai.
2. Closing Price: Zyada hoti hai.
3. Candlestick Color: Aksar hara (green) ya safed (white) hota hai.
Famous bulish patterns
Bullish Engulfing: Jab ek bara bullish candle chhoti bearish candle ko cover kar leti hai.
Hammer: Chhoti body aur lambi neeche wali shadow, jo dikhata hai ke market neeche se recover kar raha hai.
Morning Star: Teen candles ka combination jo signal deta hai ke price barhne wali hai.
Bearish Candlestick Pattern
Bearish candlestick pattern ka matlab hai ke market ka trend neeche ki taraf ja raha hai, ya price girne wali hai. Yeh pattern tab banta hai jab sellers (bechne wale) market me zyada dominate karte hain. Iska matlab hai ke supply zyada hai aur price neeche jane ka chance hai.
Key Features of Bearish Patterns
1. Opening Price: Zyada hoti hai.
2. Closing Price: Kam hoti hai.
3. Candlestick Color: Aksar laal (red) ya kala (black) hota hai.
Famous bea
Bearish Engulfing: Jab ek bari bearish candle chhoti bullish candle ko cover kar leti hai.
Shooting Star: Chhoti body aur lambi upar wali shadow, jo signal deta hai ke price neeche jayegi.
Evening Star: Teen candles ka combination jo signal deta hai ke price girne wali hai.
Bullish aur Bearish ka Farq
Kaise Istemaal Karein?
Agar aap market me trading karte hain, to candlestick patterns ka analysis karna bohot zaroori hai. Bullish patterns me buying ka signal hota hai, jabke bearish patterns selling ka signal dete hain. Yeh patterns aapko market ke future trend ka andaza lagane me madad dete hain.
Candlestick patterns ke sath aur bhi technical tools ka istemal zaroor karein, jaise ke moving averages aur RSI, taake zyada accurate decisions liye ja saken.
Conclusion
Bullish aur bearish candlestick patterns trading me ek qeemati zariya hain. Inka sahi samajh aur analysis aapki trading strategy ko behtareen bana sakta hai aur aapko munafa kamaane me madad de sakta hai.

تبصرہ
Расширенный режим Обычный режим