Heikin Ashi Candlestick Patterns: Ek Mukhtasar Jaiza
Heikin Ashi ek special tarah ka candlestick chart hai jo traditional candlestick charts se thoda different hota hai. Yeh technique price trends ko smooth banata hai, jo ke traders ko market ka trend achi tarah samajhne mein madad deti hai. Heikin Ashi ka istemal zyada tar trend-following strategies mein hota hai, aur yeh market ke reversal points ko pehchan ne mein bhi madad karta hai.
Heikin Ashi Kaise Kaam Karta Hai?
Heikin Ashi candles traditional candlesticks se thodi different hoti hain. Inhe calculate karte waqt, previous candles ka data bhi consider kiya jata hai, jis se candles smooth aur clearly trends ko dikhati hain. Heikin Ashi candles ka calculation kuch is tarah hota hai:
Open: (Open of previous bar + Close of previous bar) / 2
Close: (Open + High + Low + Close) / 4
High: Maximum of High, Open, or Close
Low: Minimum of Low, Open, or Close
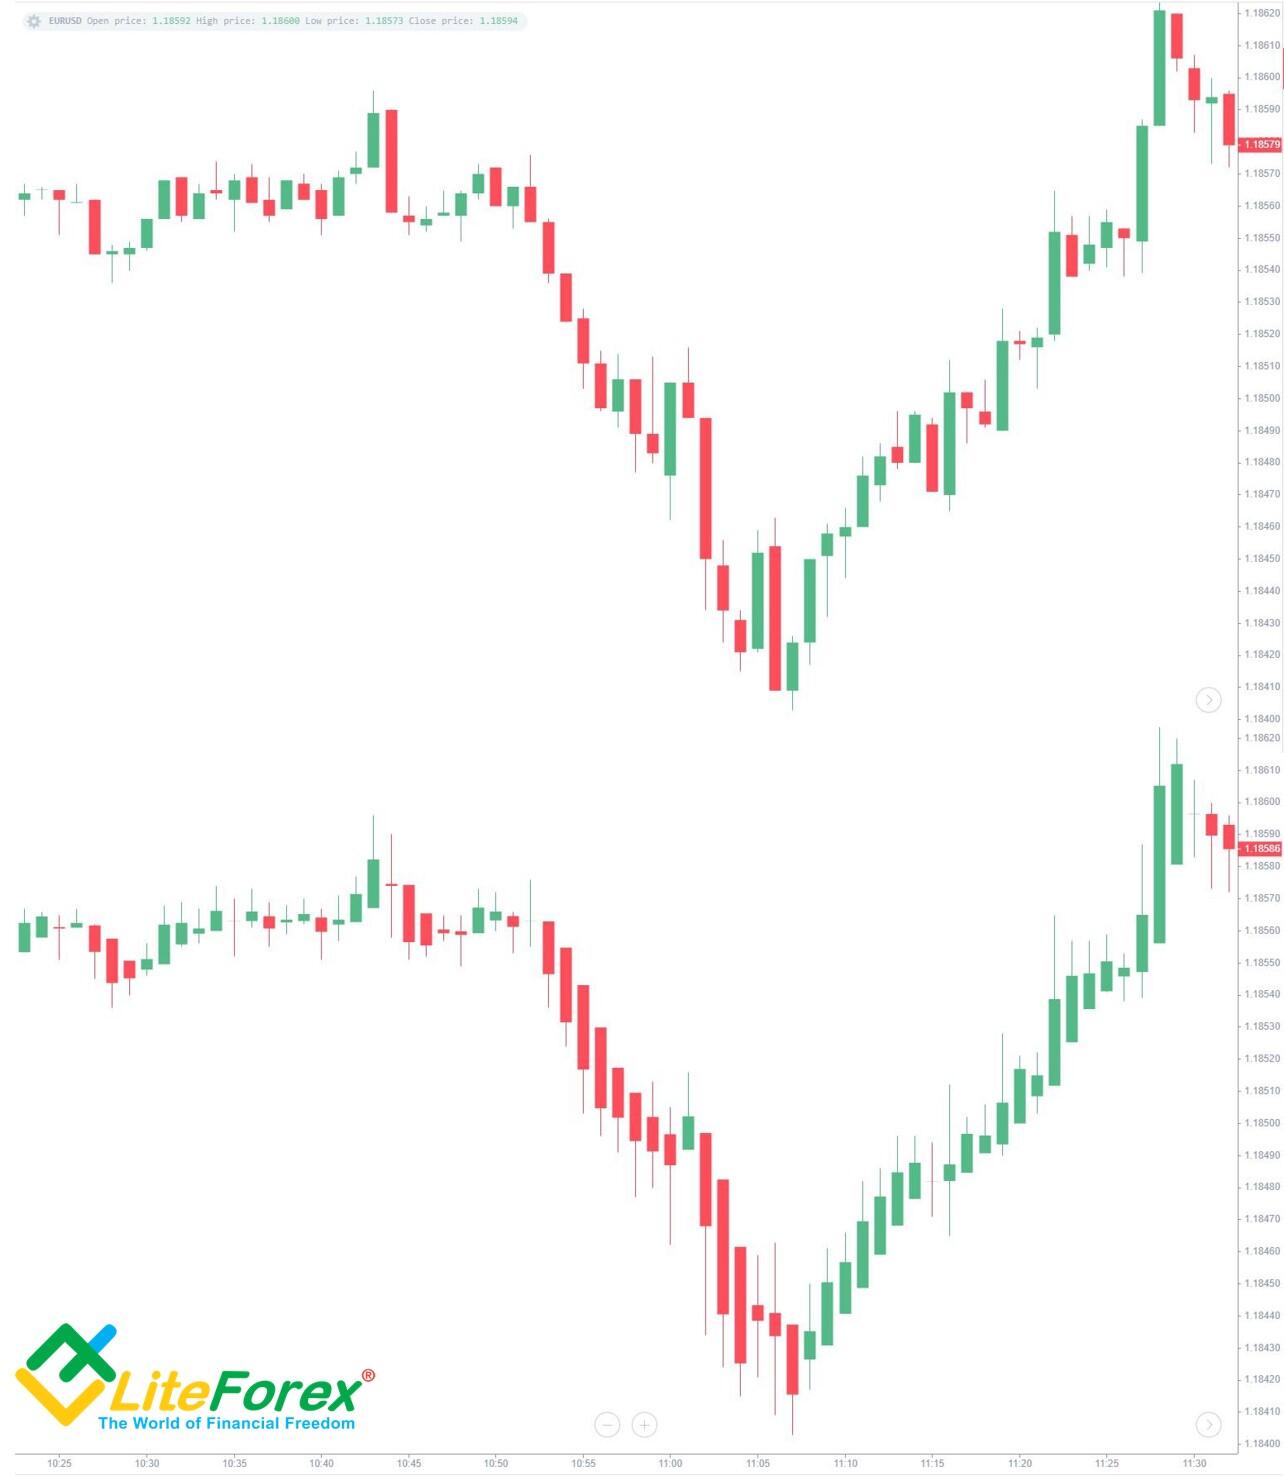
Is calculation ki wajah se, Heikin Ashi candles trend ko smooth karte hain aur sudden price movements ko thoda adjust karte hain, jis se market ki asli direction zyada clearly samajh aati hai.average.
Heikin Ashi Patterns
Heikin Ashi patterns ka analysis karte waqt, aap market ke trends ko samajh sakte hain aur unke hisaab se trading decisions le sakte hain. Kuch common Heikin Ashi candlestick patterns yeh hain:
Bullish Heikin Ashi Pattern
Jab Heikin Ashi candles green hoti hain aur market ek consistent uptrend mein hoti hai, toh yeh bullish trend ko indicate karta hai. Agar aik red candle ke baad green candle aati hai, toh yeh trend reversal ka indication ho sakta hai, jo ke uptrend ka shuruat ho sakta hai.
Bearish Heikin Ashi Pattern
Jab Heikin Ashi candles red hoti hain aur market downtrend mein hoti hai, toh yeh bearish trend ko indicate karta hai. Agar aik green candle ke baad red candle aati hai, toh yeh trend reversal ka indication ho sakta hai, jo ke downtrend ka shuruat ho sakta hai.
Heikin Ashi doji tab banta hai jab candle ki body bohot chhoti hoti hai aur uski upper aur lower shadows kaafi lambi hoti hain. Yeh pattern market mein indecision ko dikhata hai, jahan traders ko clear trend ka pata nahi hota. Yeh pattern aksar trend reversal ke signals ke tor par bhi dekha jata hai.
Bullish Engulfing Heikin Ashi
Jab aik red candle ke baad aik lambi green candle aati hai, toh yeh bullish engulfing pattern banata hai. Yeh pattern market mein bullish reversal ka indication hai. Jab yeh pattern downtrend ke baad dikhe, toh yeh bullish trend ka shuruat ho sakta hai.
Bearish Engulfing Heikin Ashi
Jab aik green candle ke baad aik lambi red candle aati hai, toh yeh bearish engulfing pattern banata hai. Yeh pattern market mein bearish reversal ka indication hai. Jab yeh pattern uptrend ke baad dikhe, toh yeh downtrend ka shuruat ho sakta hai.
Heikin Ashi Ka Faidah
Heikin Ashi ka sabse bada faidah yeh hai ke yeh market ki trends ko zyada clearly aur smoothly dikhata hai. Iski madad se aap apne trading decisions ko behtar bana sakte hain. Agar aap market ke trends ko samajhne mein mushkil mehsoos kar rahe hain, toh Heikin Ashi ka istemal aapko clearer picture de sakta hai. Yeh trend-following traders ke liye ek bohot ahem tool hai.
Conclusion
Heikin Ashi candlestick patterns market ko samajhne ka ek behtareen tareeqa hai. Yeh traditional candlesticks se kaafi different hota hai aur trend reversal aur market directions ko clearly indicate karta hai. Agar aap trading mein naye hain, toh Heikin Ashi aapko market ki true picture samajhne mein madad de sakta hai. Lekin, iske sath-sath aapko other technical indicators ka bhi istemal karna chahiye taake aap apni trading strategies ko aur behtar bana sakein.
Heikin Ashi ek special tarah ka candlestick chart hai jo traditional candlestick charts se thoda different hota hai. Yeh technique price trends ko smooth banata hai, jo ke traders ko market ka trend achi tarah samajhne mein madad deti hai. Heikin Ashi ka istemal zyada tar trend-following strategies mein hota hai, aur yeh market ke reversal points ko pehchan ne mein bhi madad karta hai.
Heikin Ashi Kaise Kaam Karta Hai?
Heikin Ashi candles traditional candlesticks se thodi different hoti hain. Inhe calculate karte waqt, previous candles ka data bhi consider kiya jata hai, jis se candles smooth aur clearly trends ko dikhati hain. Heikin Ashi candles ka calculation kuch is tarah hota hai:
Open: (Open of previous bar + Close of previous bar) / 2
Close: (Open + High + Low + Close) / 4
High: Maximum of High, Open, or Close
Low: Minimum of Low, Open, or Close
Is calculation ki wajah se, Heikin Ashi candles trend ko smooth karte hain aur sudden price movements ko thoda adjust karte hain, jis se market ki asli direction zyada clearly samajh aati hai.average.
Heikin Ashi Patterns
Heikin Ashi patterns ka analysis karte waqt, aap market ke trends ko samajh sakte hain aur unke hisaab se trading decisions le sakte hain. Kuch common Heikin Ashi candlestick patterns yeh hain:
Bullish Heikin Ashi Pattern
Jab Heikin Ashi candles green hoti hain aur market ek consistent uptrend mein hoti hai, toh yeh bullish trend ko indicate karta hai. Agar aik red candle ke baad green candle aati hai, toh yeh trend reversal ka indication ho sakta hai, jo ke uptrend ka shuruat ho sakta hai.
Bearish Heikin Ashi Pattern
Jab Heikin Ashi candles red hoti hain aur market downtrend mein hoti hai, toh yeh bearish trend ko indicate karta hai. Agar aik green candle ke baad red candle aati hai, toh yeh trend reversal ka indication ho sakta hai, jo ke downtrend ka shuruat ho sakta hai.
Heikin Ashi doji tab banta hai jab candle ki body bohot chhoti hoti hai aur uski upper aur lower shadows kaafi lambi hoti hain. Yeh pattern market mein indecision ko dikhata hai, jahan traders ko clear trend ka pata nahi hota. Yeh pattern aksar trend reversal ke signals ke tor par bhi dekha jata hai.
Bullish Engulfing Heikin Ashi
Jab aik red candle ke baad aik lambi green candle aati hai, toh yeh bullish engulfing pattern banata hai. Yeh pattern market mein bullish reversal ka indication hai. Jab yeh pattern downtrend ke baad dikhe, toh yeh bullish trend ka shuruat ho sakta hai.
Bearish Engulfing Heikin Ashi
Jab aik green candle ke baad aik lambi red candle aati hai, toh yeh bearish engulfing pattern banata hai. Yeh pattern market mein bearish reversal ka indication hai. Jab yeh pattern uptrend ke baad dikhe, toh yeh downtrend ka shuruat ho sakta hai.
Heikin Ashi Ka Faidah
Heikin Ashi ka sabse bada faidah yeh hai ke yeh market ki trends ko zyada clearly aur smoothly dikhata hai. Iski madad se aap apne trading decisions ko behtar bana sakte hain. Agar aap market ke trends ko samajhne mein mushkil mehsoos kar rahe hain, toh Heikin Ashi ka istemal aapko clearer picture de sakta hai. Yeh trend-following traders ke liye ek bohot ahem tool hai.
Conclusion
Heikin Ashi candlestick patterns market ko samajhne ka ek behtareen tareeqa hai. Yeh traditional candlesticks se kaafi different hota hai aur trend reversal aur market directions ko clearly indicate karta hai. Agar aap trading mein naye hain, toh Heikin Ashi aapko market ki true picture samajhne mein madad de sakta hai. Lekin, iske sath-sath aapko other technical indicators ka bhi istemal karna chahiye taake aap apni trading strategies ko aur behtar bana sakein.
تبصرہ
Расширенный режим Обычный режим