Dubble bottom pattern in trading

No announcement yet.
`
X
  • وقت
  • دکھائیں
Clear All
new posts
  • #1 Collapse

    Dubble bottom pattern in trading
    What is Dubble Bottom Pattern in trading?

    Double bottom pattern forex trading mein ek bullish reversal pattern hai jo market ke neeche se upar jaane ka ishara deta hai. Yeh pattern tab banta hai jab price do baar neeche girta hai, lekin dono dafa ek hi level par support leta hai aur wapas upar jata hai. Is pattern ka shape "W" ki tarah hota hai, aur yeh signal deta hai ke price ab neeche se upar ki taraf move karega.


    Pattern introduction and formation

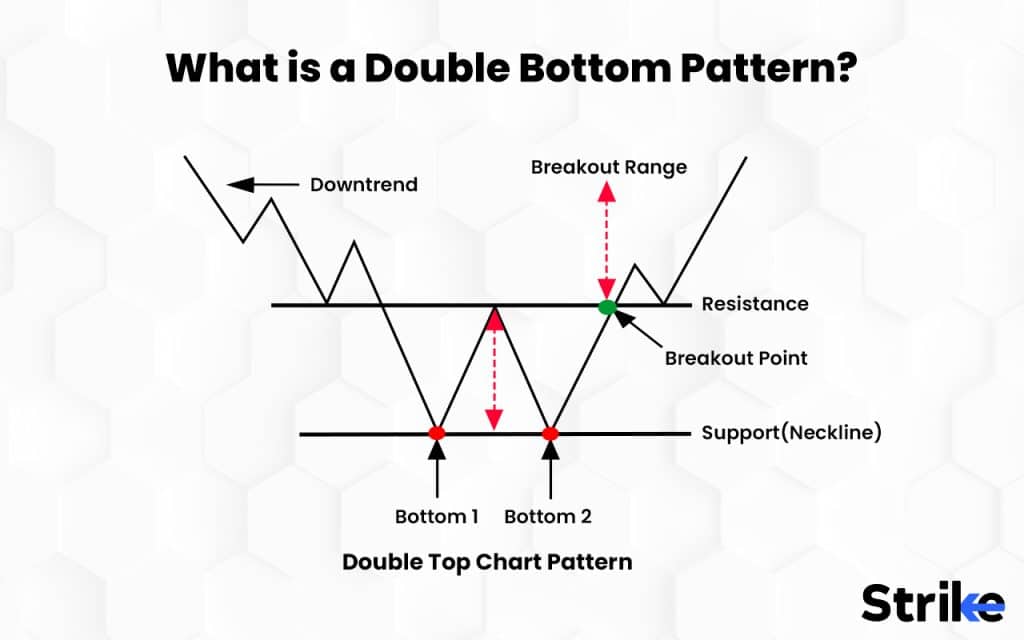
    Double bottom pattern ki pehchaan karne ke liye, pehle dekhna hota hai ke market mein downtrend chal raha ho. Phir price neeche gir kar ek support level touch kare aur wapas thoda upar jaye (pehla bottom). Iske baad price phir se neeche aaye aur pehle wale support level ko dobara touch kare (dusra bottom). Agar price dobara support level se upar jata hai, to yeh pattern complete hota hai.


    Entry And Exit Points

    Double bottom pattern ke baad trade mein entry ka best point tab hota hai jab price resistance line ko todta hai, jo dono bottoms ke beech banti hai. Isse "neckline breakout" kehte hain. Jab price is neckline ke upar close kare, tab buy order lagana safe hota hai. Stop-loss order hamesha second bottom ke neeche lagana chahiye, taake risk control ho. Target price ke liye neckline aur bottom ke beech ka distance use karte hain aur usi distance ko neckline ke upar add karte hain.

    Advantage And Risk Management

    Double bottom pattern ke faide mein yeh aata hai ke yeh ek reliable reversal signal hai, jo aapko downtrend ke baad potential uptrend ka idea deta hai. Lekin har pattern successful nahi hota, isliye risk management bohot zaroori hai. Hamesha apne trades par stop-loss lagayein aur position size ko manage karein. Over-leverage aur bina planning ke trading se bachein, warna nuksaan ho sakta hai.
    ​​​​
    Double bottom pattern beginners aur experienced traders ke liye ek powerful tool hai agar isse sahi samjha aur use kiya jaye.
  • <a href="https://www.instaforex.org/ru/?x=ruforum">InstaForex</a>
  • #2 Collapse

    Double Bottom Pattern in Trading
    Double Bottom Pattern ek famous technical analysis pattern hai jo market mein potential reversal ka indication deta hai. Ye pattern aksar bearish trend ke baad aata hai aur bullish reversal ki nishani hota hai. Trading mein is pattern ka sahih tareeqe se samajhna aur istemal karna bohot zaroori hai.

    Double Bottom Pattern Kya Hai?

    Double Bottom Pattern do "lows" ya neeche ke points banata hai jo almost barabar hote hain. Iske darmiyan ek "neckline" hoti hai jo dono lows ke beech wali resistance line hoti hai. Jab price neckline ko todta hai (breakout), toh bullish trend shuru hone ke chances barh jate hain.

    Key Features of Double Bottom Pattern

    1. Formation
    Do lows jo lagbhag ek hi level par hotay hain.

    Pehla low bearish trend ka continuation dikhata hai.

    Dusra low price ke stabilize hone aur reversal ke liye signal deta hai.

    2. Neckline

    Dono lows ke beech ka highest point neckline kehlata hai.

    Jab price neckline ke upar break kare, toh trade karna safe hota hai.

    3. Volume

    Breakout ke waqt volume ka barhna zaroori hota hai.

    Ye confirmation deta hai ke trend reversal real hai.


    4. Timeframe

    Double bottom ka formation hone mein time lagta hai. Short-term ya long-term charts dono par ye pattern dekhne ko milta hai.


    Kaise Identify Karein Double Bottom Pattern?

    1. Price neeche gir raha ho aur pehla low banaye.

    2. Price wapas upar jaye aur neckline tak pohonche.

    3. Phir price dobara neeche aaye aur pehla low ke aas-paas ka level touch kare.

    4. Price dobara neckline break kare toh bullish trend confirm hota hai.

    Double Bottom Pattern Kaise Trade Karein?

    1. Entry Point

    Neckline ke upar price breakout karne par entry karein.

    2. Stop Loss

    Dusre low ke neeche stop-loss lagayein taake risk minimize ho.

    3. Target Price

    Neckline se low ki distance ko measure karein aur usi distance ko upar target price set karein.

    Double Bottom Pattern Ke Fayde

    Reversal trend ko pehchan kar profit kama sakte hain.
    Risk management ke liye acha signal deta hai.

    Har market (forex, stocks, crypto) mein kaam karta hai.

    Cautions

    Ye pattern hamesha successful nahi hota, isliye volume aur breakout ka confirmation zaroor check karein.

    Fake breakouts se bacha jaye.

    Double Bottom Pattern ek powerful tool hai jo trading strategy mein help karta hai. Agar isse sahi tarah samjha jaye aur use kiya jaye, toh ye profitable trades karne mein madadgar ho sakta hai.


    • #3 Collapse

      Double Bottom Pattern


      Aaj hum baat karenge ek bohot popular chart pattern ke baare mein jo traders ke liye ek important signal hota hai, aur wo hai Double Bottom Pattern. Ye pattern stock market aur forex market mein price trends ko predict karne ke liye use hota hai. Agar aap beginner hain ya intermediate trader hain, to yeh pattern aapko trading decisions lene mein madad de sakta hai.

      Is article mein hum Double Bottom Pattern ke baare mein detail se samjhenge, iske confirmation kaise hoti hai, aur is pattern ke sath successful trading strategies kya ho sakti hain.


      Double Bottom Pattern Kya Hota Hai?


      Double Bottom pattern ek technical chart pattern hai jo price chart par do consecutive bottoms bana kar emerge hota hai. Is pattern ko aksar ek "W" shape mein dekha jaata hai, jisme market do different points par girta hai aur phir upar ki taraf move karna shuru karta hai. Is pattern ka main objective yeh hota hai ke price pehle neeche jaane ke baad, ek strong reversal dikhaata hai.


      Key Features:
      1. Pehla Bottom: Jab price ek significant low banaata hai, to yeh first bottom hota hai.
      2. Rise After First Bottom: Pehle bottom ke baad, price kuch upar jaata hai, jo ek minor recovery ko show karta hai.
      3. Second Bottom: Price phir se neeche jaata hai aur dusra bottom banaata hai, jo pehle se thoda higher ya same level pe ho sakta hai.
      4. Breakout: Dusre bottom ke baad, price agar is level ko break karke upar ki taraf move karna start kare, to yeh confirmation hota hai ke pattern complete ho gaya hai aur bullish trend start ho sakta hai.

      Double Bottom pattern aksar bearish market mein dekha jaata hai jab ek downtrend ke baad reversal ka signal milta hai.
      Confirmation of Double Bottom Pattern


      Jab bhi aap Double Bottom pattern dekhte hain, to uska confirmation milna bohot zaroori hota hai. Is pattern ka confirmation tab hota hai jab price doosre bottom ke baad breakout karta hai aur iske baad price upward direction mein move karta hai.


      Key Confirmation Indicators:
      1. Price Break Above Neckline: Double Bottom pattern ka sabse important confirmation tab hota hai jab price second bottom ke baad "neckline" ya resistance level ko break karta hai. Neckline woh level hota hai jo pehle bottom ke baad price ne banaya hota hai. Jab price is level ko cross karta hai, to reversal ka signal strong hota hai.
      2. Volume Increase: Jab price breakout karta hai, to volume ka increase hona bohot zaroori hai. Agar breakout low volume par ho, to wo breakout weak ho sakta hai aur pattern invalid ho sakta hai.
      3. Momentum Indicators: Aap momentum indicators jese RSI (Relative Strength Index) ya MACD (Moving Average Convergence Divergence) bhi use kar sakte hain. Agar in indicators mein bullish crossover ho raha ho aur price breakout kar raha ho, to pattern ka confirmation aur zyada strong hota hai.
      4. Timeframe Confirmation: Higher timeframes jaise daily ya weekly charts par pattern ka confirmation zyada reliable hota hai. Agar aap intraday charts par dekh rahe hain, to aapko breakout ke baad confirmation thoda time lagne ki wajah se zyada risk ho sakta hai.

      Double Bottom Pattern Ki Importance Trading Mein


      Double Bottom pattern ko traders market mein price reversal ka indicator samajhte hain. Jab market ne ek bottom bana liya hota hai aur phir doosra bottom banta hai, to yeh ek strong indication hota hai ke market ne apna downtrend khatam kar diya hai aur ab bullish trend start ho sakta hai.


      Benefits:
      1. Reliable Trend Reversal Signal: Double Bottom pattern ek reliable reversal signal hai, jo aapko market ke direction mein change hone ke baad entry lene ka mauka deta hai.
      2. Better Risk-to-Reward Ratio: Is pattern ke through aap better risk-to-reward ratio achieve kar sakte hain kyunki aap entry lene ke baad stop loss ko recent low ke niche rakh sakte hain aur target ko breakout ke baad ke expected move par set kar sakte hain.

      Double Bottom Pattern Trading Strategy


      Agar aap Double Bottom pattern ko trading mein apply karte hain, to kuch important steps aur strategies hain jo aapko follow karni chahiye:


      1. Identify the Pattern on the Chart:


      Sabse pehle, aapko price chart par Double Bottom pattern ko identify karna hoga. Iske liye aapko do consecutive bottoms ko dekhna hoga, jo ek "W" shape banate hain. Yeh pattern aap daily, weekly, ya 4-hour charts par dekh sakte hain.


      2. Wait for the Breakout:


      Jab aap pattern identify kar lete hain, to next step yeh hai ke aap breakout ke liye wait karein. Doosra bottom complete hone ke baad, price jab neckline (jo ke first bottom ke baad ka resistance level hota hai) ko break kare, tab aapko buying opportunity milti hai. Yeh ek confirmation hota hai ke reversal ho gaya hai.


      3. Confirm with Volume:


      Jab breakout ho, to volume ka increase hona zaroori hai. Agar volume low ho, to breakout ke false hone ka chance ho sakta hai. High volume breakout signal karta hai ke trend change ho raha hai aur strong move aane wala hai.


      4. Use Stop Loss for Protection:


      Aapko stop loss set karne ka method bhi samajhna hoga. Jab aap entry lete hain, to stop loss ko aap first bottom ke neeche set kar sakte hain. Isse agar price reverse hota hai, to aapko loss se bachaya jaa sakta hai.


      5. Target Price Setting:


      Target price ko set karte waqt aap initial range of the pattern ko measure kar sakte hain. Agar distance pehla bottom se neckline tak hai, to aap is distance ko breakout point ke baad price ke move tak add kar sakte hain.


      6. Risk Management:


      Risk management trading mein bohot zaroori hota hai. Double Bottom pattern ka use karte waqt, aapko risk-to-reward ratio ko balance karte hue trade karna chahiye. Aksar traders risk-to-reward ratio ko 1:2 ya 1:3 rakhte hain, jiska matlab hai ke aap apni risk ko 2 ya 3 times ke profit se compare kar rahe hote hain.


      Example of Double Bottom Pattern Trade


      Step 1: Aapne ek stock ko analyze kiya aur aapko usmein Double Bottom pattern mil gaya. Pehla bottom $100 par bana, phir stock ne thoda rise kiya aur $105 tak gaya. Phir dusra bottom $102 par bana.

      Step 2: Aapne wait kiya aur jab stock $105 ko break kar gaya, to aapne buy order place kiya.

      Step 3: Aapne stop loss ko $98 par set kiya (pehle bottom ke neeche), aur target price ko $110 set kiya (pattern ke size ke hisaab se).

      Step 4: Aapne trade ko monitor kiya aur stock ne bullish trend continue kiya, jisse aapka target price hit ho gaya aur aapne profitable trade kiya.


      Conclusion


      Double Bottom pattern ek powerful tool hai jo market me price reversal ko identify karne mein madad karta hai. Is pattern ka use karke aap better trading decisions le sakte hain aur market trends ko samajhkar profitable trades kar sakte hain.

      Agar aap is pattern ko properly understand karte hain aur iske confirmation signals par dhyan dete hain, to aap apne trading success ko improve kar sakte hain. Lekin, hamesha yaad rakhein ke trading mein risk hota hai, aur aapko apni risk management strategy ko bhi sahi tareeke se apply karna chahiye.

      Double Bottom pattern ek simple aur effective strategy hai, lekin iske saath aapko patience, risk management, aur confirmation indicators ka bhi istemal karna hoga taake aapke trades successful ho sakein.


      • #4 Collapse

        Double Bottom Pattern: Stock Market Mein Iska Asar aur Pehchan

        Double Bottom pattern ek important chart pattern hai jo technical analysis mein use hota hai. Ye pattern aksar trend reversal ko indicate karta hai, yani ke market ki current trend ko badal kar naye trend ki shuruat hoti hai. Ye pattern aksar downtrend ke baad banta hai aur ye bullish reversal ka signal deta hai. Iska matlab hai ke market ne niche ki taraf jaane ke baad ab upar ki taraf jaana shuru kiya hai.

        Double Bottom Pattern Ki Pehchan

        Double Bottom pattern do distinct "bottom" points dikhata hai jo ek doosre ke kaafi kareeb hote hain. In dono bottoms ke beech ek upward movement hoti hai. Jab price pehli baar neeche jaata hai aur phir thoda upar jata hai, to ye pehla bottom hota hai. Phir jab price dobara neeche jaata hai aur fir se upar jata hai, to doosra bottom banata hai.

        Agar ye pattern clear ho jata hai, to iske baad price ki movement upar ki taraf ho sakti hai. Isliye, is pattern ko traders apne trading decisions mein use karte hain, khas tor par buy signal ke liye.

        Double Bottom Pattern Ka Formation

        Double Bottom pattern ka formation kuch aise hota hai:

        1. Pehla Bottom:

        Jab price ne downtrend ke baad niche jaana shuru kiya aur ek low banaya.

        2. Rally Up:

        Pehla bottom hone ke baad price thoda upar jata hai, lekin yeh rally weak hoti hai aur resistance ke baad price wapis niche jaata hai.

        3. Doosra Bottom:

        Jab price phir se neeche jata hai aur pehla bottom jaisa level banaata hai. Agar price is level ko todta nahi hai, to yeh doosra bottom kehlata hai.

        4. Breakout:

        Jab price doosre bottom ke baad wapis upar jata hai aur resistance level ko break karta hai, to is point ko "breakout" kaha jata hai. Yeh bullish signal hota hai.

        Double Bottom Pattern Ka Significance

        Double Bottom pattern ko samajhna zaroori hai, kyun ke yeh ek strong indication hota hai ke market ab reverse ho sakta hai. Ye pattern traders ko yeh signal deta hai ke sell-off ya downtrend ka phase khatam ho gaya hai aur ab market upward movement ki taraf jaane ki tayari kar raha hai.

        Trading Mein Double Bottom Ka Use

        Jab traders Double Bottom pattern dekhte hain, to wo isse buy signal samajhte hain. Yeh buy signal tab hota hai jab price breakout hota hai, yani ke doosra bottom banane ke baad price resistance ko todta hai. Is signal ke baad traders apne positions open karte hain aur price ke upward movement ka faida uthate hain.

        Conclusion

        Double Bottom pattern ek effective aur reliable chart pattern hai jo market mein reversal ko indicate karta hai. Agar aap technical analysis karte hain to is pattern ko samajhna aur identify karna bohot zaroori hai. Is pattern ka sahi time par use karne se aap apni trading decisions ko behtar bana sakte hain aur potential profits kama sakte hain.

        • #5 Collapse

          **Double Bottom Pattern in Trading**
          Forex aur stock market mein technical analysis ka ek bohot important role hota hai, jisme traders market trends aur price movements ko samajhne ke liye different chart patterns ka use karte hain. Unmein se ek popular pattern hai "Double Bottom Pattern". Yeh pattern aksar trend reversal ko indicate karta hai aur traders ko ek significant price movement ka signal deta hai. Is post mein hum double bottom pattern ko detail mein samjhenge, iski identification kaise hoti hai, aur yeh kaise trading decisions mein madad karta hai.

          ### **Double Bottom Pattern Kya Hai?**

          Double bottom pattern ek bullish reversal pattern hai jo aksar downtrend ke baad banta hai. Is pattern mein price do baar neeche girti hai, lekin har bar previous low ke aas-paas support level ko touch karte hue wapas upar chali jaati hai. Is pattern ki formation mein do distinct troughs (bottoms) hote hain, jisme do similar lows banti hain, aur unke beech ek peak ya small rise hota hai.

          Jab market pehle neeche jata hai, phir ek temporary rebound hota hai, aur phir market dubara neeche jaata hai, lekin pehle wale low ke aas-paas support milta hai, to yeh Double Bottom pattern ka formation hota hai. Yeh pattern aksar ek strong bullish reversal ka signal hota hai, jisme price ek naye upward trend ki taraf move kar sakti hai.

          ### **Double Bottom Pattern Key Identification**

          1. **First Trough (Bottom)**
          Pehla bottom ek downtrend ke baad banta hai, jahan price ek significant low reach karti hai. Yeh level market mein support banata hai, jahan se price thoda rebound kar sakti hai.

          2. **Rebound (Peak)**
          Pehle bottom ke baad price thoda upar jati hai, lekin yeh rebound sirf temporary hota hai. Price kuch time ke liye consolidation phase mein rehti hai, aur phir doosra downward move start hota hai.

          3. **Second Trough (Bottom)**
          Dusra bottom pehla bottom ke aas-paas ya thoda upar banta hai, jahan market ne dobara support dikhaya. Agar second bottom pe price bounce karti hai, to yeh pattern ka confirmation hota hai.

          4. **Neckline Break**
          Jab second bottom ke baad price ek strong upward move karti hai aur previous peak (neckline) ko break karti hai, to yeh Double Bottom pattern ka complete confirmation hota hai. Yeh breakout ek strong bullish signal hota hai, jo market ke upward trend mein shift hone ka indication deta hai.

          ### **Double Bottom Pattern Ki Significance**

          1. **Bullish Reversal Signal**
          Double Bottom pattern ka main significance yeh hai ke yeh ek strong bullish reversal signal hota hai. Jab market ek downtrend mein hota hai aur yeh pattern banta hai, to yeh indicate karta hai ke market ne apne previous low ko touch kar liya hai aur ab upward movement shuru ho sakti hai.

          2. **Trend Reversal**
          Yeh pattern long-term trend reversal ka indicator hota hai. Agar downtrend ke baad Double Bottom pattern banta hai, to yeh market ke direction ko upside ki taraf shift karne ka signal ho sakta hai. Traders is pattern ko identify karke apne buying positions open kar sakte hain.

          3. **Support and Resistance Levels**
          Double Bottom pattern ko support and resistance levels ke aas-paas identify kiya jata hai. Jab price pehle bottom ke level ko break karke neeche jati hai, to yeh level market mein strong support ban jata hai. Dusra bottom us level ko test karta hai aur agar yeh level intact rehta hai, to price upward movement ki taraf move kar sakti hai.

          ### **Double Bottom Pattern Ko Forex Trading Mein Kaise Use Karein?**

          1. **Entry Point**
          Jab aapko Double Bottom pattern complete hota hua dikhayi de, to aap price ke neckline breakout ka wait karte hain. Jab price neckline ko break karti hai, to yeh entry ka point hota hai. Aap buy position open kar sakte hain, jisme aapka target upward trend mein hona chahiye.

          2. **Stop Loss**
          Risk management ke liye, stop loss ko second bottom ke thoda neeche set karna chahiye. Iska matlab hai ke agar price wapas neeche girti hai aur aapka prediction galat ho jata hai, to aapka loss limited rahega.

          3. **Take Profit**
          Take profit level ko pattern ke completion point se calculate kiya ja sakta hai. Aap neckline break ke baad ek target set kar sakte hain jo pattern ke completion level ke aas-paas ho. Yeh aapko accurate profit-taking ka opportunity deta hai.

          ### **Double Bottom Pattern Ke Liye Tips**

          1. **Volume Confirmation**
          Double Bottom pattern ke saath volume ka confirmation zaroori hota hai. Jab price second bottom banane ke baad upward move karti hai, to ideally volume bhi badhna chahiye. High volume breakout ek strong signal hota hai ke trend reversal solid hai.

          2. **Time Frame Selection**
          Double Bottom pattern ko identify karte waqt time frame ka bhi dhyan rakhna zaroori hai. Yeh pattern longer time frames par zyada reliable hota hai, jese daily ya weekly charts. Short time frames par yeh pattern less reliable ho sakta hai.

          3. **Combine with Other Indicators**
          Double bottom pattern ko dusre technical indicators ke saath combine karna beneficial ho sakta hai. Moving averages, RSI, ya MACD se confirmation lene se aapke trade ka accuracy increase ho sakti hai.

          ### **Conclusion**

          Double bottom pattern forex trading mein ek powerful tool hai jo market ke trend reversal ko identify karne mein madad karta hai. Jab yeh pattern downtrend ke baad banta hai, to yeh market ke upward movement ka indication de sakta hai. Is pattern ko correctly identify karke, traders apne trades ko plan kar sakte hain aur potential profits kama sakte hain. Risk management, volume confirmation, aur dusre technical indicators ka use karke, Double Bottom pattern ko apni trading strategy mein integrate karna aapko zyada successful bana sakta hai.
          • #6 Collapse

            Double Bottom Pattern in Trading

            1. Double Bottom Pattern Kya Hai?
            Double bottom pattern ek technical analysis ka popular tool hai jo trading mein price reversal ka indication deta hai. Yeh pattern aksar tab banta hai jab market downward trend mein hoti hai aur phir do bar ek hi level par low hit karti hai, jis ke baad price upar ki taraf move karti hai. Is pattern ko "W shape" ki wajah se asani se pehchana ja sakta hai, jo price ke reversal ka strong signal hota hai.

            Double bottom ka matlab yeh hai ke price ne apne lowest point ko do dafa test kiya aur support level strong raha. Yeh pattern aksar bullish trend ke aaghaz ka signal deta hai aur traders ke liye entry points identify karne ka best tool ban sakta hai. Double bottom pattern sirf tab kaam karta hai jab dono bottoms ke beech mein ek clear price recovery ho aur phir price ne neckline ko tod kar upar ki taraf breakout diya ho.

            2. Double Bottom Pattern Ke Key Features
            Double bottom pattern ke kuch khas features hain jo is pattern ko aur asaan aur reliable banate hain. Pehla feature yeh hai ke ismein do lows ka hona zaroori hai jo almost same price level par hon. Yeh lows aksar support level ko dikhate hain. Agar price is support level se neeche na jaye, toh yeh signal hota hai ke market mein buying pressure barh raha hai.

            Doosra important feature neckline hoti hai. Neckline ek horizontal line hoti hai jo dono bottoms ke high points ko connect karti hai. Jab price neckline todta hai, toh yeh confirmation hoti hai ke pattern complete ho gaya hai aur bullish trend shuru hone wala hai. Teesra feature volume ka role hai. Jab price neckline todta hai, toh volume mein izafa hona chahiye, jo breakout ki reliability ko barhata hai.

            3. Pattern Ko Kaise Pehchana Jaye?
            Double bottom pattern ko pehchanana mushkil nahi hai, lekin kuch technical analysis tools ka istemal zaroori hai. Pehle, price chart par focus karein aur "W" shape ka pattern talash karein. Dono bottoms ka almost same level par hona zaroori hai, warna yeh pattern incomplete ho sakta hai.

            Neckline ki position ko identify karna bhi zaroori hai. Dono bottoms ke beech ka high point neckline banata hai. Jab price is neckline ko todta hai, toh yeh confirmation hoti hai ke pattern kaam kar raha hai. Indicators jaise ke RSI (Relative Strength Index) aur MACD (Moving Average Convergence Divergence) bhi use kiye ja sakte hain taake overbought aur oversold levels ka pata chal sake.

            4. Double Bottom Pattern Mein Entry Aur Exit Points
            Double bottom pattern trading mein sahi entry aur exit points dhoondhne ka ek behterin tareeqa hai. Jab price neckline ke paas aati hai, toh yeh ek alert hota hai ke pattern complete hone wala hai. Lekin neckline ke todne ka intezar karna zaroori hai, warna yeh false breakout ho sakta hai.

            Entry ka ideal point neckline todne ke baad hota hai. Yeh woh moment hota hai jab price bullish trend shuru karti hai. Stop loss lagana bhi zaroori hai aur aksar yeh second bottom ke neeche lagaya jata hai. Exit points ka tayeun karte waqt aap target price ka calculation kar sakte hain, jo neckline aur bottoms ke darmiyan distance ke barabar hota hai.

            5. Double Bottom Aur Triple Bottom Ka Farq
            Double bottom aur triple bottom patterns mein basic farq bottoms ki tadaad ka hai. Double bottom mein sirf do lows hoti hain, jab ke triple bottom mein teen lows hoti hain. Triple bottom aksar zyada reliable hota hai kyun ke ismein market ke support level ka teen dafa test hota hai.

            Lekin double bottom zyada common hai aur trading mein asani se use kiya jata hai. Dono patterns ka kaam ek jaisa hai, lekin triple bottom ka formation zyada waqt leta hai aur iska breakout zyada powerful ho sakta hai. Is liye, double bottom beginners ke liye zyada asaan aur faidemand hai.

            6. Double Bottom Pattern Ka Psychological Impact
            Double bottom pattern ka psychological impact trading ke decisions par gehra hota hai. Jab price pehli dafa low hit karti hai, toh traders ko lagta hai ke yeh ek temporary dip hai. Lekin jab price doosri dafa low par aati hai aur wahan se rebound karti hai, toh traders ke andar confidence barhta hai ke market reversal hone wala hai.

            Yeh confidence buying pressure mein izafa karta hai, jo eventually price ko upar le jata hai. Is pattern ki psychological importance yeh hai ke yeh traders ko market ke mood ke bare mein ek clear signal deta hai, jo unki decision-making process ko improve karta hai.

            7. Double Bottom Pattern Ki Limitations
            Jahan double bottom pattern ek powerful tool hai, wahan iski kuch limitations bhi hain. Sabse pehli limitation yeh hai ke yeh pattern aksar false breakouts ka shikar hota hai. Iska matlab hai ke price neckline tod kar wapis neeche aa sakti hai.

            Doosri limitation yeh hai ke yeh pattern sirf tab kaam karta hai jab market mein sufficient volume ho. Low volume ke sath pattern ki reliability kam ho jati hai. Teesri limitation yeh hai ke yeh pattern sirf longer timeframes par zyada accurate hota hai. Short timeframes par iska analysis mushkil ho sakta hai.

            8. Indicators Ka Role Double Bottom Pattern Mein
            Double bottom pattern ke analysis mein technical indicators kaafi helpful hote hain. RSI ka istemal karke aap overbought aur oversold levels ka pata laga sakte hain. Jab RSI oversold zone se upar aata hai, toh yeh buying ka signal ho sakta hai.

            MACD divergence bhi double bottom pattern ke confirmation mein madad karta hai. Agar MACD bullish crossover dikhaye, toh yeh signal deta hai ke price upar jaane wali hai. Volume indicator bhi breakout ke waqt kaafi madadgar hota hai. Jab neckline todte waqt volume barhta hai, toh yeh breakout ki reliability ko barhata hai.

            9. Real-Life Examples Aur Case Studies
            Double bottom pattern ko samajhne ke liye real-life examples ka analysis zaroori hai. Aksar forex, stocks, aur commodities markets mein yeh pattern dikhai deta hai. Jaise ke Apple Inc. ke stock chart mein 2021 mein double bottom pattern bana tha, jis ke baad stock ki price mein significant izafa dekhne ko mila.

            Forex market mein EUR/USD pair aksar double bottom patterns dikhata hai, jo reversal trends ka signal dete hain. Case studies ka analysis karke aap yeh samajh sakte hain ke is pattern ka kaise effectively use kiya jaye.

            10. Conclusion: Double Bottom Pattern Ek Reliable Strategy
            Double bottom pattern ek reliable aur powerful trading strategy hai jo market ke reversal trends ko identify karne mein madad karta hai. Yeh pattern na sirf price action ka analysis improve karta hai, balki traders ke liye profitable opportunities bhi create karta hai. Lekin is pattern ka sahi istemal karne ke liye proper technical analysis aur risk management ka hona zaroori hai.

            Traders ko chahiye ke is pattern ko other tools aur indicators ke sath use karein taake zyada accurate results mil sakein. Double bottom pattern ke sath trading karte waqt patience aur discipline ka hona zaroori hai, kyun ke yeh cheezein hi trading mein kamyabi ki kunji hain.
             
            • <a href="https://www.instaforex.org/ru/?x=ruforum">InstaForex</a>
            • #7 Collapse

              1. Double Bottom Pattern Kya Hai?


              Double bottom pattern ek technical analysis ka ahem hissa hai jo traders ko market ke reversal signals samajhne mein madad deta hai. Yeh pattern aksar bullish reversal ka indicator hota hai, yaani jab market neeche girne ke baad wapis upar uthne lagti hai. Is pattern mein price do martaba ek specific support level ko touch karta hai aur wahan se rebound karta hai. Yeh dono bottoms almost barabar hotay hain, jo confirm karta hai ke market ek naye bullish trend mein daakhil ho sakti hai.

              Yeh pattern aksar un situations mein banta hai jab market over-sold hoti hai aur buyers ka interest wapis aata hai. Is ka design ‘W’ shape ka hota hai, jo support aur resistance levels ke darmiyan price ka bounce dikhata hai. Jab second bottom ke baad price resistance level todta hai, toh yeh pattern ka breakout hota hai jo buy signal kehlata hai.

              Is pattern ki importance tab zyada hoti hai jab market me ziada volume ke sath breakout hota hai. Yeh pattern short-term aur long-term dono trading ke liye relevant ho sakta hai, is liye technical analysis ke shaukeen traders ke liye yeh ek ahem tool hai.
              2. Double Bottom Pattern Banane Ki Shartain


              Double bottom pattern ki pehchaan ke liye kuch khas shartain hain jo is pattern ko validate karti hain. Sabse pehle, price ko ek support level tak girna chahiye aur wahan se bounce karna chahiye. Phir price wapas neeche gir kar usi support level ko dubara test karega.

              Is pattern ka second bottom pehle bottom ke kareeb ya barabar hona chahiye. Agar doosra bottom first bottom ke bohot neeche ya upar ho, toh pattern apni validity khota hai. Yeh zaroori hai ke dono bottoms ke darmiyan price upar ki taraf ek bounce kare, jo market ke buyers ka signal deta hai.

              Breakout kaafi significant hona chahiye jo pattern ko confirm kare. Breakout ke dauran high volume hona bhi zaroori hai, jo batata hai ke market mein bullish momentum shuru ho gaya hai. Agar yeh shartain puri na hon, toh double bottom pattern ka analysis galat ho sakta hai.
              3. Double Bottom Pattern Ka Technical Structure


              Is pattern ka technical structure ‘W’ shape mein hota hai. Pehla bottom tab banta hai jab price support level tak girti hai aur buyers wahan intervene karte hain. Uske baad, price temporarily upar ki taraf move karti hai, jo ek resistance level banata hai.

              Doosra bottom tab banta hai jab price wapas neeche girti hai aur pehle support level ko test karti hai. Agar price dubara rebound kare aur resistance level ko tod de, toh yeh confirm karta hai ke double bottom pattern complete ho chuka hai. Breakout ke baad, market aksar bullish trend mein daakhil hoti hai.

              Yeh pattern samajhne ke liye price action aur support-resistance levels ka analysis karna bohot zaroori hai. Aksar traders moving averages ya oscillators ka istemal karte hain taake pattern ko validate kar sakein.
              4. Double Bottom Pattern Aur Volume Ka Taluq


              Volume ka role double bottom pattern mein bohot ahm hai. Jab price pehla bottom banata hai, toh volume mein girawat hoti hai. Lekin jab price second bottom banata hai, tab volume aksar barhna shuru ho jata hai. Yeh signal hota hai ke buyers market mein wapas aa rahe hain.

              Breakout ke waqt high volume hona pattern ki credibility ko barhata hai. Agar breakout ke dauran volume low ho, toh yeh signal deta hai ke breakout fake ho sakta hai. Isi liye, volume analysis double bottom pattern ke liye zaroori hota hai.

              Volume ke zariye traders yeh bhi samajh sakte hain ke market mein kitni strength hai aur bullish trend kitni der tak chal sakta hai. Yeh insight trading decisions ko zyada effective banata hai.
              5. Double Bottom Pattern Ka Forex Trading Mein Istemaal


              Forex trading mein double bottom pattern kaafi effective hota hai, khas kar un pairs ke liye jo high volatility dikhate hain. Jab koi currency pair support level ko test karta hai aur rebound karta hai, toh yeh pattern traders ko buy signal deta hai.

              Forex market mein yeh pattern aksar economic news aur events ke baad banta hai. Traders is pattern ko identify kar ke apne entry aur exit points better define kar sakte hain. Stop-loss levels aksar second bottom ke neeche lagaye jaate hain taake risk minimize ho.

              Forex market mein leverage ke wajah se yeh pattern high returns provide kar sakta hai, lekin saath hi high risk bhi involve hota hai. Is liye proper risk management zaroori hai.
              6. Stock Market Mein Double Bottom Pattern


              Stock market mein double bottom pattern aksar tab banta hai jab koi stock over-sold hota hai. Yeh pattern investors ko batata hai ke stock ka price stabilize ho raha hai aur wapis barhne ka chance hai.

              Stock market mein yeh pattern long-term aur short-term dono investors ke liye faidemand ho sakta hai. Long-term investors is pattern ke zariye apne portfolio ke liye achi entry points dhoond sakte hain. Short-term traders ise breakout trading ke liye use karte hain.

              Is pattern ka analysis karte waqt company ke fundamentals aur market sentiment ko bhi dekhna zaroori hota hai. Technical aur fundamental analysis ka combination is pattern ke effectiveness ko barhata hai.
              7. Risk Management Double Bottom Pattern Mein


              Double bottom pattern ka use karte waqt risk management bohot zaroori hai. Agar pattern fail ho jaye ya breakout fake ho, toh trader ko bara loss ho sakta hai. Is liye stop-loss orders lagana bohot important hai.

              Stop-loss order aksar second bottom ke thoda neeche lagaya jata hai. Agar price us level tak gir jaye, toh trade automatically close ho jata hai aur loss limit mein rehta hai. Risk-reward ratio ka khayal rakhna bhi zaroori hai.

              Risk management ke bina double bottom pattern ka use karna gambling ke barabar ho sakta hai. Is liye har trade ke liye ek clear plan aur exit strategy honi chahiye.
              8. Double Bottom Pattern Ki Limitations


              Har technical pattern ki tarah double bottom pattern ki bhi kuch limitations hain. Sabse bari limitation yeh hai ke yeh pattern hamesha successful nahi hota. Kabhi kabhi market fake breakout dikhata hai jo traders ke liye misleading ho sakta hai.

              Doosri limitation yeh hai ke yeh pattern zyada time le sakta hai form hone mein. Agar trader impatient ho, toh woh galat decision le sakta hai. Is liye is pattern ke liye sabr aur analysis bohot zaroori hai.

              Volume aur market sentiment ko ignore karna bhi is pattern ke effectiveness ko kam kar deta hai. Isi liye har aspect ka detailed analysis karna zaroori hai.
              9. Advanced Indicators Aur Double Bottom Pattern


              Double bottom pattern ka accuracy barhane ke liye advanced indicators ka use kiya jata hai. Moving averages, RSI, aur MACD aksar is pattern ke sath use kiye jate hain. Yeh indicators pattern ko validate karte hain aur zyada reliable signals dete hain.

              For example, agar RSI oversold zone mein ho aur double bottom pattern banta ho, toh yeh signal deta hai ke market bullish hone wali hai. MACD crossover bhi bullish momentum ko confirm karta hai.

              Advanced indicators ka use karke traders apne decisions zyada confident aur accurate bana sakte hain. Yeh tools pattern ke fake breakouts ko avoid karne mein bhi madadgar hain.
              10. Double Bottom Pattern Ki Practical Application


              Double bottom pattern ko practice mein use karna ek skill hai jo time aur experience ke sath develop hoti hai. Is pattern ko identify karna aur uske mutabiq trading karna market ki dynamics ko samajhne par depend karta hai.

              Practical application ke liye sabse pehle chart patterns aur price action ko samajhna zaroori hai. Backtesting karna aur historical data par is pattern ko test karna bhi useful hota hai.

              Double bottom pattern ko use karte waqt apne trading goals aur risk tolerance ko samajhna bohot zaroori hai. Har market aur asset ke liye yeh pattern kaam nahi karta, is liye hamesha analysis par focus karein aur impulsive decisions se bachein.
              Yeh pattern trading ki duniya mein ek powerful tool hai jo aapki strategies ko better banata hai. Lekin iska sahi istemal karna aur apne risk ko manage karna aapki trading success ka raaz hai.
               

              اب آن لائن

              Working...
              X