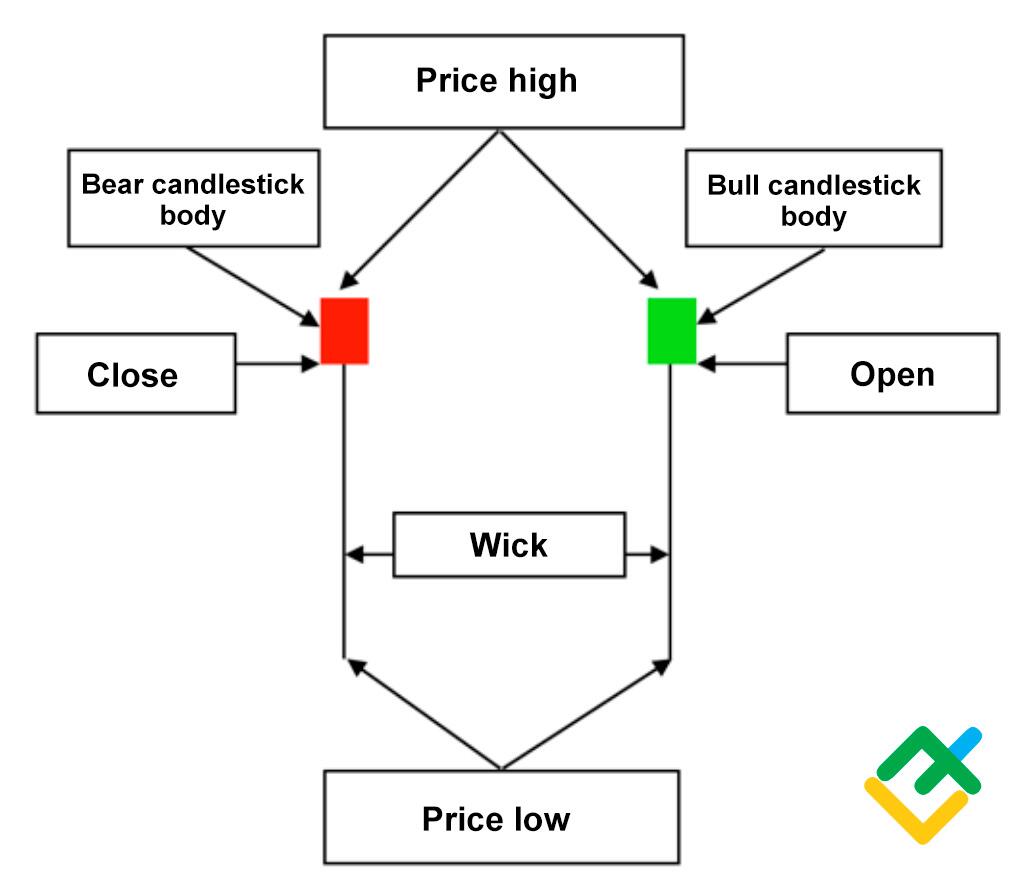
Bullish Hammer Candlestick Pattern
Bullish Hammer ek candlestick pattern hai jo is baat ko predict karta hai ke market ka trend bullish hone wala hai ya downtrend ka end ho sakta hai. Ye pattern aksar market ke bottoms ya downtrends ke doraan nazar aata hai aur indicate karta hai ke sellers' strength khatam ho rahi hai aur buyers control me aa rahe hain.
Is pattern me, candlestick ka body chhota hota hai aur upper shadow chhota ya nahi hota, jab ke lower shadow bara hota hai. Ye lower shadow is baat ka ishara hai ke market ne kaafi neechay se recover kar ke apnay din ka closing price tak aa gai.

Identification of Bullish Hammer
Bullish Hammer pattern ko identify karne ke liye, aap yeh cheezain note kar sakte hain:
- Small body: Candle ka body chhota hota hai, jo green (bullish) ya red (bearish) ho sakta hai.
- Long lower shadow: Candle ka lower shadow body se kam az kam do ya teen guna hota hai.
- Little to no upper shadow: Candle ka upper shadow ya to hota nahi ya bahut chhota hota hai.
Yeh pattern usually downtrend ke doraan form hota hai. Market jab bearish phase me hoti hai, tab yeh candle formation sellers ke weak hone ka saboot hoti hai. Bullish Hammer candle jab ban jati hai, toh yeh market trend ke reversal ka signal hota hai aur upward move shuru hoti hai.
- Formation process:
- Market bounce back karti hai aur high point tak recover hoti hai.
- Market ne neechay low banaya hota hai, magar buyers ki strength ki wajah se wapas aakar candle ko high closure pe la deti hai.
Significance of Bullish Hammer
Bullish Hammer pattern ko trading setup aur market analysis me regularly use kiya jata hai. Jab yeh candlestick pattern market me dekha jata hai, to yeh is baat ka signal hota hai ke sellers exhausted ho chukay hain, aur buyers ab market ko control me le rahe hain. Yeh pattern aksar ek bullish trend ya recovery ko predict karta hai.
- Indicators:
- True buyers' comeback: Pattern form hone k baad buyers ki comeback hoti hai, isko analyse karna zaroori hai.
- Market sentiment: Yeh pattern market sentiment me change ka signal de sakta hai.
Example:
Agar market downtrend me hoti hai aur suddenly Bullish Hammer pattern appear ho jaye, to yeh indicate karta hai ke downtrend over ho sakti hai aur market bullish trend me shift hone ka chance hota hai. Traders yeh opportunity ko identify karke profit gain kar sakte hain.
Conclusion
Bullish Hammer pattern ek significant candlestick pattern hai jo ke potential market reversal ko predict karta hai. Yeh pattern indicate karta hai ke sellers ki strength decline ho rahi hai aur buyers market ko control kar rahe hain. Trading decisions aur strategies me Bullish Hammer pattern ko include karne se profitable results mil sakte hain. Is pattern ko dekh ke trading decisions ko assess karna traders ke liye beneficial ho sakta hai

تبصرہ
Расширенный режим Обычный режим