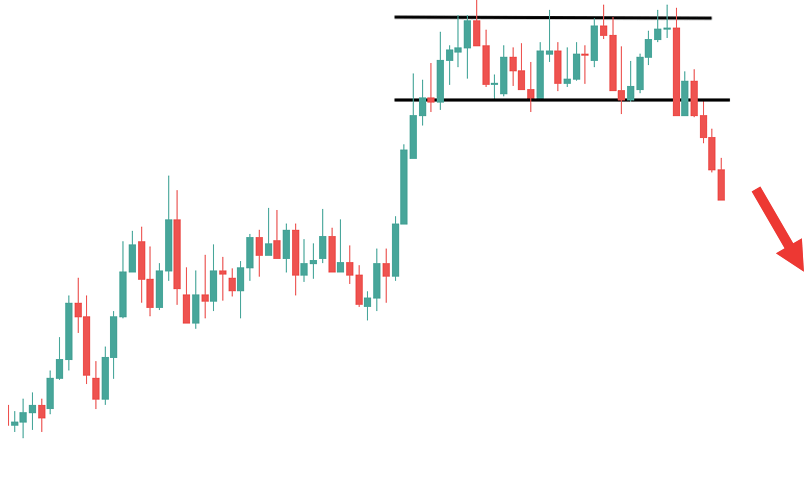
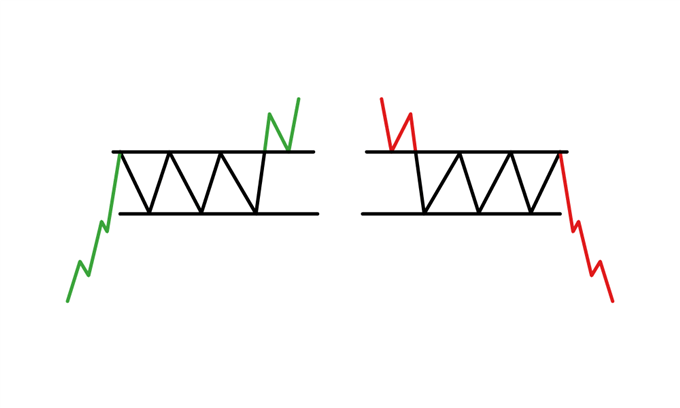
Rectangle pattern trading.

No announcement yet.
`
X
  • وقت
  • دکھائیں
Clear All
new posts
  • #1 Collapse

    Rectangle pattern trading.
    Brief Description.

    Dear traders aap ko batana chahta hun ki rectangle chart pattern for trading karne ke liye Tiger ko bahut hi experience hona chahie trading Mein Kyun ki yah pattern aik Khas consolidation of market ke bad candlesticks per apply kiya jata hai aur Is ke break through per trading Strategy ko develop Kiya jata hai Rectangle chart pattern, jo ke ek popular technical analysis pattern hai, ek range-bound market ko represent karta hai. Is pattern mein price do horizontal levels ke beech move karta hai: ek support level (neeche ka line) aur ek resistance level (upar ka line). Jab market kisi specific range mein trade kar raha hota hai, to price is range ke andar fluctuate karta hai. Ye pattern sideways market conditions ko signal karta hai, jahan buyers aur sellers ka balance hota hai, aur price na to upar jaata hai aur na neeche. Is pattern ka duration thoda long ho sakta hai, aur yeh typically short-term traders ke liye beneficial hota hai. Rectangle pattern ko "box pattern" bhi kaha jaata hai, kyun ke yeh price action ko ek rectangular shape mein form karta hai.


    How to trade Rectangle Pattern.

    Dear traders Rectangle pattern ko trade karte waqt, sabse pehle yeh zaroori hai ke aap support aur resistance levels ko accurately identify karein. Jab price resistance level ko touch karta hai aur neeche aata hai, to traders ko sell signal milta hai, aur jab price support level ko touch kar ke upar jaata hai, to buy signal milta hai. Rectangle pattern mein breakout ke baad price move karta hai jo ek clear direction dikhata hai, aur yeh breakout trend ke shuru hone ka signal hota hai. Agar price resistance ko break kar ke upar jaata hai, to yeh buying opportunity hoti hai, aur agar support level break ho jaata hai, to selling opportunity milti hai. Traders ko chahiye ke wo breakout hone par volume ko bhi monitor karein, kyun ke high volume breakout ka confirmation deta hai.


    How to Stop Loss.

    Dear traders Agar price breakout ke baad trend mein jaata hai, to traders apni profits ko maximize karne ke liye trailing stop loss ka use karte hain. Rectangle pattern ko trade karte waqt patience zaroori hai, kyun ke yeh pattern kabhi kabhi lamba time le sakta hai, lekin sahi strategy aur discipline ke saath traders achi returns hasil kar sakte hain.Rectangle pattern ke saath trading karte waqt risk management bohot zaroori hota hai. Jab traders rectangle pattern mein enter karte hain, to unko apni entry aur exit points ko define karna chahiye. Stop loss ko support ya resistance level ke thoda bahar set karna chahiye, taake agar price pattern ke andar se break ho kar reverse hota hai, to unka risk limited ho. Risk-to-reward ratio ko dhyaan mein rakhte hue, traders apne potential profits aur losses ko manage karte hain.
  • <a href="https://www.instaforex.org/ru/?x=ruforum">InstaForex</a>
  • #2 Collapse

    Rectangle chart pattern

    rectangle chart pattern os time banta hey jab forex market mein security ke price rectangle or horizontal trend line banate hein resistance line kay darmean mein aik baray period kay ley trend line hote hey forex maket mein har aik rectangle chart pattern support or resistance ko he ochalta hey kunkeh price support or resistance kay darmean mein he hote hy rectangle chart pattern buyer or selle kay darmean mein tawazon ko he identify kar sakta hey jo keh os time tak assert ke value par he depend karta hey rectangle chart pattern final breakout ko he identify kar sakta hey
    resistance say oper ka ga es bat ko he identify karta hey trader long period tak he ja saktay hein rectangle stable or mumkana breakout ko he identify kar sakta hey trader ko breakout kay time par he entry karnay ka he time melta hey overall rectangle chart pattern hawala frahm kartay hein market kay trend ko stop karnay or entry ka he chance he mell sakta hey

    Understanding Rectangle chart Pattern

    rectangle chart pattern forex market mein mumkana price mein tabdele ke taraf eshara hota hey jes say price kay chart mein rectangle noa ce shape heban sakte hey es period kay sath he price na to oper ke taraf barahay ge balkeh aik khas price ke limit mein agay ke taraf he barah sakay ge

    yeh pattern forex market mein sahi samjha jata hey jab forex market ke price zyada volume ko he cross kar sakte hey reversal wala gap bullish jazbaat ko he identify kar sakta hey negative pehlo bearish kay he jazbaat ko he identify kar saktay hein trader mumkana selling kay signal he paida kar sakta hey or rectangle chart pattern ka he estamal kar sakta hey
    buy signal os time paida hota hey jab price rectangle pattern say oper ke taraf break ho jate hey jo keh mumkana ezaffay ko he identify kar saktay hein selling ka signal tab paida hota hey jab price pattern say nehay ke taraf turning ho jate hey jo keh mumkana kame ke taraf he trend ko identify kar sakta hey

    Identify Bullish Rectangle Pattern

    Aik bullish rectangle pattern es time banta hey jab kese assert ke price wazah tor par he tayon kar sakte hey or support or resistance kay darmean mein yakja ho jate hey es pattern ke phchan karnay kay ley ap support pattern kay upper hesay ke he pehchan kar saktay hein or forex market kay upper trend ko he talash kar saktay hein

    es say zahair ho raha hey keh forex market mein buyer control mein he hota hey or consolidation ka period buyer say he control mein hota hey kunkeh price rectangle support or resistance kay darmean mein hote hey support or resistance line double trend ko he idetify kar sakta hey yeh forex market mein yeh pechlay trend say he kam say kam double ho jate hey consolidation jetna long hota hey final breakout otna he long ho jata hey or oper ka trend phir say he start ho jata hey rectangle prices mein jare ezafay ko he identify kar sakte hein or long postion mein enter honay kay ley kabel e aitmad hota hey jabkeh stable price khatam ho rehe hote hey

    Bearish Rectangle Chart Pattern

    bearish rectangle chart pattern aik kesam ka technical chart pattern he hota hey jo keh aam tor par pehlay nechay ka he trend hota hy or forex market kay trend jare ko he identify kar sakta hey yeh aik rectangle or box ke shape ka he pattern hota hey jab price support level or resistance level kay darmean mein aik he side par jate hey


    Trading Example of rectangle chart pattern

    kai month tak upper trend kay bad company ABC ka aik strong stock hota hey jo keh aik strong trend mein enter bhe ho sakta hey or company ABC kay stabl step ke taraf enter ho sakte hey jes kay sath he price horizontal line kay sath he cross kar jate hein or upper lines kay highs ko he jor sakte hein jabkeh lower trend line nasheeb ko he jor sakte hey support level or upper ke resistance level ko he break kar sakte hey or rectangle pattern ban sakta hey

    low trading activity stable kay step kay darmean mein hote hey market kay shorka stock mein rectangle ke sorat ko yaqene he bana saktay hein buyer support level kay sath he hasas ko he jama kar saktay hein pattern ke trade sell karnay kay sath he resistance level kay sath he profit sell ho jata hey
    bhali kay badlay bhali
    • #3 Collapse

      **Rectangle Pattern Trading: Roman Urdu Mein Guide**

      Rectangle pattern trading aik mashhoor aur simple technique hai jo technical analysis mein use hoti hai. Is mein traders price ke aik restricted range ya rectangle shape ka pattern identify karte hain, jo support aur resistance levels ke darmiyan banta hai. Roman Urdu mein hum is technique ko samajhte hain aur iske pros aur cons discuss karte hain.

      ### **Rectangle Pattern Kya Hai?**
      Rectangle pattern aik consolidation phase ko dikhata hai jahan price support (lowest level) aur resistance (highest level) ke darmiyan move karta hai. Yeh pattern us waqt banta hai jab market mein na bullish (upar jaane wali) aur na hi bearish (neeche jaane wali) trend hoti hai, balki price aik range ke andar ruka hota hai.

      #### **Rectangle Pattern Ke Do Types**:
      1. **Bullish Rectangle**:
      Jab price aik uptrend ke baad consolidate kare aur phir rectangle ke upar breakout kare, to isay bullish rectangle kehte hain. Yeh aksar upward continuation signal hota hai.

      2. **Bearish Rectangle**:
      Jab price aik downtrend ke baad consolidate kare aur phir rectangle ke neeche breakout kare, to isay bearish rectangle kehte hain. Yeh downward continuation signal hota hai.

      ### **Rectangle Pattern Ko Identify Karna**
      1. **Support Aur Resistance Levels**:
      Aapko do clear horizontal lines dekhni hoti hain:
      - **Support line**: Price iss level se neeche nahi jaata.
      - **Resistance line**: Price iss level se upar nahi jaata.

      2. **Volume Analysis**:
      Jab rectangle pattern banta hai, to volume aksar kam hota hai. Lekin breakout ke waqt volume ziada ho jata hai jo breakout ke confirmation mein madad karta hai.

      ### **Rectangle Pattern Trading Strategy**
      1. **Breakout Ke Intizaar Mein Rahiye**:
      Rectangle ke andar trade karne ki bajaye breakout hone ka intizaar karein. Breakout ke baad aapko price ki direction ka andaza hota hai.

      2. **Entry Aur Stop-Loss**:
      - Entry us waqt karein jab price resistance level ke upar (bullish breakout) ya support level ke neeche (bearish breakout) jaaye.
      - Stop-loss us range ke thoda upar ya neeche lagayein jis taraf breakout ho raha hai.

      3. **Profit Target**:
      Aapka profit target rectangle ki height ke barabar hota hai. Agar rectangle 20 points ka ho, to breakout ke baad price mein 20 points ka move expected hota hai.

      ### **Rectangle Pattern Ke Pros Aur Cons**
      #### **Pros**:
      - Simple aur asaan samajhne wali strategy hai.
      - Trend continuation signals ko pehchanne mein madad milti hai.
      - Risk management mein madadgar.

      #### **Cons**:
      - False breakouts ka khatra hota hai.
      - Kabhi kabar consolidation zyada waqt le sakti hai.
      - Har market condition mein kaam nahi karta.

      ### **Conclusion**
      Rectangle pattern trading aik reliable aur effective technique hai agar aap technical analysis ko samajhte hain aur patience ke sath breakout ka intizaar karte hain. Agar aap is pattern ko sahi tareeke se apply karein to aap apne trades mein achi success hasil kar sakte hain. Lekin hamesha yaad rakhein, market unpredictable hoti hai, is liye risk management aur discipline zaroori hai.

      Roman Urdu mein trading ka ye tareeqa beginner aur experienced traders dono ke liye faidemand ho sakta hai.
      • <a href="https://www.instaforex.org/ru/?x=ruforum">InstaForex</a>
      • #4 Collapse

        Rectangle Pattern Trading in Forex
        Forex trading mein price action analysis kaafi zaroori hoti hai, aur ismein different chart patterns ka use kiya jata hai. Rectangle pattern ek aisa chart pattern hai jo market ki consolidation phase ko represent karta hai. Yeh pattern tab banta hai jab price ek range ke andar move karta hai, aur traders is range ko breakout ke liye monitor karte hain. Rectangle pattern ek continuation ya reversal pattern ho sakta hai. Yeh tab banta hai jab price ek horizontal range mein bounded hota hai, jahan support aur resistance levels clearly define hote hain. Is pattern ka shape ek rectangle ki tarah hota hai, isliye isko "Rectangle Pattern" kaha jata hai.


        Key Characteristics
        1. Horizontal Support and Resistance: Price repeatedly ek specific support aur resistance level ke beech bounce karta hai.
        2. Equal Highs and Lows: Resistance aur support levels parallel hote hain.
        3. Consolidation Phase: Market mein buyers aur sellers ke darmiyan balance hota hai.
        4. Breakout Potential: Price eventually rectangle ke boundary ko tod kar breakout karta hai.
        Rectangle Pattern Kaise Identify Karein
        Rectangle pattern ko identify karne ke liye aapko candlestick chart par focus karna hoga. Neeche kuch steps diye gaye hain jo aapko is pattern ko samajhne mein madad karenge:
        1. Support and Resistance Draw Karna: Price chart par un levels ko identify karein jahan price consistently support aur resistance face kar raha ho.
        2. Range Define Karna: Jab price ek horizontal range ke andar bounded ho aur kisi specific level ko repeatedly touch kar raha ho, to wo rectangle pattern ban raha hai.
        3. Volume Analysis: Consolidation phase ke dauraan volume kam hota hai, lekin breakout ke waqt volume increase hota hai.
        Rectangle Pattern Ki Types
        Rectangle pattern do main types mein divide hoti hai:

        1. Bullish Rectangle Pattern
        Yeh pattern tab banta hai jab price ek uptrend ke baad consolidate kare. Is pattern mein price resistance ko tod kar upar breakout karta hai.

        Example: Agar EUR/USD ka price 1.1000 se lekar 1.1100 ke beech range mein hai aur uptrend ke baad consolidate kar raha hai, to yeh bullish rectangle pattern ho sakta hai.

        2. Bearish Rectangle Pattern
        Yeh pattern tab banta hai jab price ek downtrend ke baad consolidate kare. Is pattern mein price support ko tod kar neeche breakout karta hai.

        Example: Agar GBP/USD ka price 1.3000 se lekar 1.3100 ke beech range mein hai aur downtrend ke baad consolidate kar raha hai, to yeh bearish rectangle pattern ho sakta hai.

        Rectangle Pattern Ke Breakout Strategies
        Rectangle pattern trading mein breakout kaafi important hota hai. Neeche kuch trading strategies di gayi hain jo aap is pattern ke breakout ke waqt use kar sakte hain:

        1. Breakout Confirmation
        Jab price support ya resistance todta hai, to us breakout ki confirmation ke liye volume check karein. Zyada volume ke sath breakout zyada reliable hota hai.

        2. Buy on Bullish Breakout
        Agar price resistance tod kar upar breakout kare, to buy order place karein. Stop-loss support level ke neeche set karein aur target breakout range ke barabar set karein.

        Example: Agar EUR/USD ka price 1.1100 ka resistance todta hai, to buy karein aur stop-loss 1.1000 par set karein.

        3. Sell on Bearish Breakout
        Agar price support tod kar neeche breakout kare, to sell order place karein. Stop-loss resistance level ke upar set karein aur target breakout range ke barabar set karein.

        Example: Agar GBP/USD ka price 1.3000 ka support todta hai, to sell karein aur stop-loss 1.3100 par set karein.

        4. False Breakouts Handle Karna
        Kabhi kabhi price breakout ke baad wapas range ke andar aa jata hai. Is situation mein aapko stop-loss use karke apna risk control karna hoga.

        Rectangle Pattern Ke Advantages
        1. Easy to Identify: Rectangle pattern ko identify karna relatively easy hai, jo beginners ke liye helpful hai.
        2. Defined Entry and Exit Points: Support aur resistance levels ke wajah se entry aur exit points clearly defined hote hain.
        3. Suitable for Range Trading: Agar market range-bound hai, to rectangle pattern profitable opportunities provide karta hai.
        4. Breakout Opportunities: Yeh pattern breakout trading ke liye bhi ideal hai, jo high-profit potential create karta hai.
        Rectangle Pattern Ke Disadvantages
        1. False Breakouts: Rectangle pattern mein false breakouts kaafi common hain, jo losses ka sabab ban sakte hain.
        2. Extended Consolidation: Kabhi kabhi price zyada time tak range-bound reh sakta hai, jo trading opportunities ko delay kar sakta hai.
        3. Requires Patience: Traders ko breakout ka wait karna padta hai, jo patience demand karta hai.


        Rectangle Pattern Trading Tips
        1. Volume Par Focus Karein: Breakout ke waqt volume ko zaroor monitor karein. High volume breakout zyada reliable hota hai.
        2. Risk Management: Hamesha stop-loss use karein aur apne risk ko predefined range mein rakhein.
        3. Multiple Timeframes Analyze Karein: Different timeframes par rectangle pattern ko check karein taake aapko zyada confirmation mile.
        4. Combine with Indicators: Rectangle pattern ko aur reliable banane ke liye moving averages ya RSI jese indicators ka use karein.
        Rectangle pattern forex trading mein ek valuable tool hai jo traders ko price range aur breakout opportunities identify karne mein madad karta hai. Agar aap is pattern ko sahi tarah samajh kar use karein, to aap apne trading results ko kaafi improve kar sakte hain. Is pattern ko trade karte waqt patience aur proper risk management kaafi zaroori hai. Agar aap volume analysis aur technical indicators ke sath rectangle pattern ka use karein, to aap zyada consistent profits kama sakte hain.
        Believe in yourself and your abilities. When you fight for your dreams, you can achieve anything.

        اب آن لائن

        Working...
        X