What is pivot point in forex

No announcement yet.
`
X
  • وقت
  • دکھائیں
Clear All
new posts
  • #1 Collapse

    What is pivot point in forex
    Pivot Point in Forex Trading

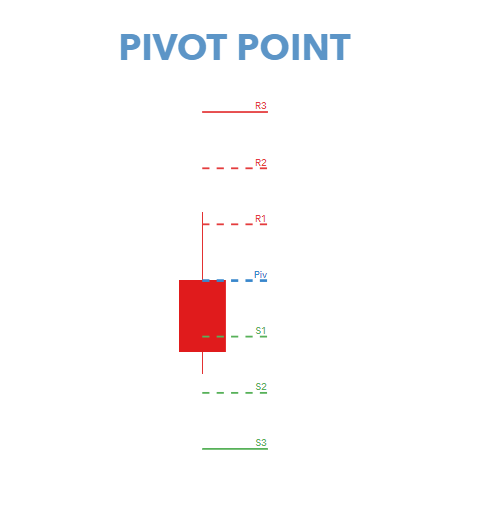
    Pivot Point ek widely-used technical analysis indicator hai jo forex trading mein market ke potential support aur resistance levels ko identify karne ke liye use hota hai. Pivot point ko market ke overall trend ko gauge karne ke liye bhi use kiya jata hai. Yeh ek average price level hota hai, jo previous trading session ke high, low, aur close prices ke basis par calculate kiya jata hai.

    Pivot points ko traders is liye pasand karte hain kyunki yeh objective aur easy-to-calculate levels hote hain, jinhon market mein aane wale din ya session ke significant levels ko identify karne mein madad milti hai.

    Click image for larger version

Name:	images (58).png
Views:	37
Size:	6.5 کلوبائٹ
ID:	13113836

    How Pivot Points Are Calculated:

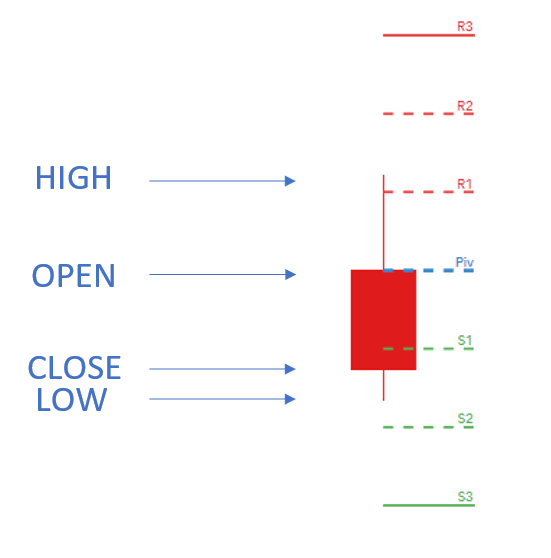
    Pivot points ko calculate karne ka basic formula yeh hai:

    Pivot Point (P) = (High + Low + Close) / 3

    Jahan:
    • High: Previous trading session ka highest price
    • Low: Previous trading session ka lowest price
    • Close: Previous trading session ka closing price

    Is primary pivot point se, kuch aur support aur resistance levels calculate kiye jate hain:

    Resistance 1 (R1) = (2 × Pivot Point) − Low
    Support 1 (S1) = (2 × Pivot Point) − High

    Resistance 2 (R2) = Pivot Point + (High − Low)
    Support 2 (S2) = Pivot Point − (High − Low)

    Resistance 3 (R3) = High + 2 × (Pivot Point − Low)
    Support 3 (S3) = Low − 2 × (High − Pivot Point)

    Yeh additional levels market ke significant turning points ko identify karte hain.

    Click image for larger version

Name:	images (57).png
Views:	36
Size:	5.8 کلوبائٹ
ID:	13113837

    Using Pivot Points in Trading:

    Pivot points ko trading strategy mein multiple tarikon se use kiya jata hai:
    1. Trend Identification:
      • Agar price pivot point ke upar trade kar raha hai, to yeh bullish trend ka indication hota hai. Agar price pivot point ke neeche trade kar raha hai, to yeh bearish trend ka signal hota hai.
    2. Support and Resistance:
      • Pivot point levels ko support aur resistance ke critical levels ke taur par use kiya jata hai. R1, R2, aur R3 levels ko resistance ke points ke taur par, aur S1, S2, aur S3 levels ko support ke points ke taur par use kiya jata hai.
    3. Breakout Trading:
      • Agar price pivot point ko breach kar ke upar jata hai, to yeh potential breakout ka signal hota hai, aur traders buy position enter kar sakte hain. Similarly, agar price pivot point ke neeche break hota hai, to yeh sell position enter karne ka signal hota hai.
    4. Reversal Trading:
      • Agar price significant support (S1, S2, S3) ya resistance (R1, R2, R3) levels tak pohanchta hai aur wahan se reverse hota hai, to yeh reversal trading ka signal hota hai. Traders is point par entry aur exit positions plan karte hain.
    Pivot Points Trading Strategy:
    1. Daily Trading:
      • Daily pivot points short-term traders ke liye useful hote hain. Previous day ke high, low, aur close par based daily pivot points aane wale trading day ke important levels ko highlight karte hain.
    2. Entry and Exit Points:
      • Pivot points ko entry aur exit points ke liye use kiya jata hai. Agar price pivot point par reverse ho raha hai, to yeh entry ka acha point ho sakta hai. Similarly, support ya resistance levels par exit plan ki ja sakti hai.
      • Combining with other indicator:
      • Pivot points ko moving averages, RSI (Relative Strength Index), ya MACD (Moving Average Convergence Divergence) jaise indicators ke sath combine karna trading signals ko strengthen karne mein madadgar hota hai.
    Click image for larger version

Name:	images (56).png
Views:	41
Size:	19.0 کلوبائٹ
ID:	13113838

    Conclusion:

    Pivot points forex trading mein ek effective tool hain jo market ke potential support aur resistance levels ko identify karne mein madad karte hain. Yeh simple, yet powerful, levels traders ke liye critical decisions ko simplify karte hain. Proper understanding aur calculation ke sath, pivot points ko profitable trading strategies ke sath integrate kiya ja sakta hai.
  • <a href="https://www.instaforex.org/ru/?x=ruforum">InstaForex</a>
  • #2 Collapse

    Pivot Point in forex market

    forex market mein pivot point aik kesam ka technical indicator hota hey jo keh pechle trading day ke high low or end price ke nomaindge karte hey yeh forex market mein mumkana support ya resistance level ko talash karnay kay ley etamal ke ja sakte hey
    commodities, indices , or forex pivot point ko he estamal keya ja sakta hey open high low or close prices ka analysis karnay kay ley estamal keya ja sakta hey
    yeh forex market mein aik kesam ka technical indicator he estamal keya ja sakta hey or forex market ke movement price kay level ka gage kay tor par he estamal ke ja sakte hey pivot point indicator forex market mein trend kay analysis karnay kay ley estamal keya ja sakta hey jo keh forex market ke support ya resistance level ka tayon karnay kay ley estamal keya ja sakta hey jo keh badlay mein profit ka target or loss ko he limited kar sakta hey forex market mein entry or exit kay tor par he estamal keya ja sakta hey


    Pivot Point ke calculation

    kuch period tak he computer baray paimanay par dasteyab nahi hotay thay lahza market bananay walay or ceiling trader yeh tayon karnay kay ley es bat ka he analysis kar saktay hein keh aya keh price saste hote hey ya expensive hote hey aik simple kesam ka mathematical calculation pivot point paida karta hey
    trader nay pechlay period mein high low or close price ko he assani kay sath leya hota hey Pivot ko talash karnay kay ley 3 say he taqseem kar deya jata hey


    Pivot Point Trading Example

    forex market mein aisay trader kay ley jo central ya long period ko tarjeh daytay hein pivot point kay sath swing trading weekly ya monthly time frame ka estamal kar kay ke jate hey
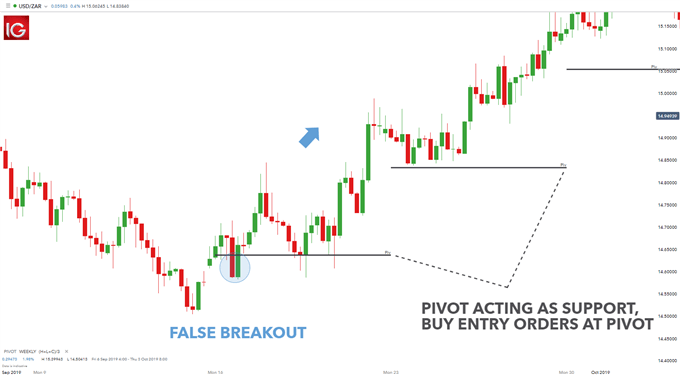
    nechay deya geya chart par forex market kay pivot point ka he estamal keya geya hey yeh wazah hey kehyeh forex market mein oper ke taraf trend tabdel ho choka hota hey jo keh pechlay pivot point ko resistace kay zarey say price kay break honay ko he identify kar sakta hey
    ab yeh forex market mein support level kay tor par he kam kar sakta hey forex trader pivot ke price mein long entry ko he darj kar saktay hein aik fake breakout hota hey jo keh forex market mein reversal trend ko he indicate kar sakta hey pivot ke level hamaisha price par he moshtamel nahi ho sakte hey laken yeh samate tor pa price ko kaim rakh sakte hey or aik long time kay ley Horizon ho ga swing trader kay ley mesale bhe ho sakta hey
    USD/ZAR ka weekly chart

    bhali kay badlay bhali
    • #3 Collapse

      Pivot Point Kya Hai?

      Pivot point forex trading mein ek ahem concept hai jo traders ko market ke potential reversal points ya support aur resistance levels ko identify karne mein madad karta hai. Ye ek mathematical calculation hai jo previous trading session ke high, low, aur closing prices ka use karke nikali jati hai.

      Click image for larger version

Name:	download.png
Views:	36
Size:	4.7 کلوبائٹ
ID:	13114024


      Pivot Point Ki Calculation

      Pivot point ko calculate karne ka formula kuch is tarah se hota hai:

      \[ \text{Pivot Point} = \frac{\text{High} + \text{Low} + \text{Close}}{3} \]

      Yahan, high, low, aur close previous trading session ke respective values hain. Is calculation se ek central point milta hai jise traders market ke direction ko samajhne ke liye use karte hain.

      Click image for larger version

Name:	images.png
Views:	39
Size:	9.8 کلوبائٹ
ID:	13114023


      Support Aur Resistance Levels

      Pivot point ke saath hi, additional support aur resistance levels bhi calculate kiye jate hain jo market ke potential turning points ko indicate karte hain. Ye levels yeh hain:

      Support Level 1 (S1): \( 2 \times \text{Pivot Point} \text{High} \)
      Support Level 2 (S2): \( \text{Pivot Point} - (\text{High} - \text{Low}) \)
      Resistance Level 1 (R1): \( 2 \times \text{Pivot Point} - \text{Low} \)
      Resistance Level 2 (R2): \( \text{Pivot Point} + (\text{High} - \text{Low}) \)

      Pivot Point Ka Use

      Pivot point aur support/resistance levels ko trading strategies mein integrate karke traders market ki direction ko predict karte hain. Agar market pivot point ke upar trade kar rahi hai, to bullish trend ka indication hota hai, aur agar pivot point ke neeche trade kar rahi hai, to bearish trend ka signal hota hai.


      Click image for larger version

Name:	images (1).png
Views:	40
Size:	5.5 کلوبائٹ
ID:	13114022

      In levels ko observe karke traders buy ya sell decisions lete hain, aur market movements ko better analyze karte hain. Is tarah se, pivot point ek important tool hai jo trading decisions ko refine karne mein madad karta hai.
      • #4 Collapse

        Forex Mein Pivot Point Kya Hai?

        1. Muqaddima

        Forex trading duniya ka sab se bara aur dynamic market hai, jahan har din trillon dollars ka exchange hota hai. Is market mein trade karna kabhi asaan nahi hota, aur yahan per successful trading ke liye accurate tools aur strategies ki zaroorat hoti hai. Pivot point aik aisa technical indicator hai jo traders ko market ke possible reversal points identify karne mein madad deta hai. Ye ek fundamental concept hai jo trading decisions ko behtar banane mein kaafi madadgar sabit hota hai. Iski samajh se traders ko market ki direction aur trend ke bare mein better insights milte hain, jo trading strategies ko optimize karne mein madad karte hain.

        Pivot point ki importance tab samajh aati hai jab aap daily trading decisions lete hain. Jab market ke movements unpredictable ho sakte hain, pivot point ek reliable benchmark provide karta hai jahan se market ke direction ka andaza lagaya ja sakta hai. Is concept ko samajhne se traders ko market ke trend ke potential reversal points ka idea milta hai, jo trading opportunities ko enhance karta hai. Har trader ke liye ye zaroori hai ke wo apne trading strategy mein pivot points ko shaamil karein taake market analysis aur decision-making behtar ho sake.

        Iske ilawa, pivot point ki understanding se aap trading risks ko bhi manage kar sakte hain. Pivot points ki madad se aap market ki volatility ko better understand kar sakte hain aur accordingly apne trading decisions ko adjust kar sakte hain. Ye ek simple lekin effective tool hai jo aapke trading arsenal ko aur bhi strong banata hai. Pivot points ko accurately calculate aur interpret karna zaroori hai taake aap maximum benefit hasil kar saken.

        2. Pivot Point Ki Definition

        Pivot point ko samajhna zaroori hai kyunke ye market ke turning point ko identify karne mein madad karta hai. Pivot point wo level hai jahan se market trend reverse ho sakta hai. Iska basic concept ye hai ke market ek particular point se upar ya neeche move karta hai, aur pivot point woh level hota hai jahan se price ka direction change ho sakta hai. Ye indicator technical analysis ka ek important part hai aur trading decisions ko behtar banane mein help karta hai.

        Pivot point ki definition ko samajhne ke liye, hume ye samajhna hoga ke yeh kis tarah se calculate hota hai. Ye level previous trading session ke high, low, aur closing prices ka use karke determine kiya jata hai. Is calculation ke zariye, traders market ke potential reversal points ko identify kar sakte hain. Ye ek standard approach hai jo market ki volatility aur trend ko samajhne mein madad karta hai.

        Pivot point ko calculate karna relatively simple hai, lekin iski accurate calculation zaroori hai taake market ki real situation ko reflect kiya ja sake. Pivot point ko daily trading decisions mein integrate karna zaroori hai, jisse aap market ki potential movements ko better predict kar saken. Iski understanding aapke trading strategies ko enhance kar sakti hai aur aapke overall trading performance ko improve kar sakti hai.

        Pivot point ke calculation ke sath sath, iski interpretation bhi zaroori hai. Traders ko pivot point ko samajhne aur interpret karne ke liye market trends aur patterns ka bhi analysis karna parta hai. Isliye, pivot point ke sath sath market ki overall situation ko samajhna bhi important hai. Ye understanding aapko market ke potential reversal points aur trading opportunities ko identify karne mein madad karti hai.

        3. Pivot Point Ka Hisab Lagane Ka Tareeqa

        Pivot point ka hisab lagana aik basic formula ke zariye hota hai. Iske liye aapko previous trading session ki high, low, aur closing prices ki zaroorat hoti hai. Pivot point calculate karne ka formula ye hai:

        Pivot Point=High+Low+Close3\text{Pivot Point} = \frac{\text{High} + \text{Low} + \text{Close}}{3}Pivot Point=3High+Low+Close​

        Is formula ko use karke aap easily pivot point calculate kar sakte hain. Ye formula market ki volatility aur trends ko reflect karta hai aur trading decisions ko behtar banane mein madad karta hai. Calculation ke liye aapko previous trading session ke data ki zaroorat hoti hai, jisse aap market ke behavior aur trends ko analyze kar sakte hain.

        Pivot point ke calculation ke baad, aapko support aur resistance levels bhi calculate karne chahiye. Ye levels pivot point ke around hotay hain aur market ke potential reversal points ko identify karne mein madad karte hain. Support aur resistance levels ke calculation ka formula kuch is tarah hota hai:

        Support=(2×Pivot Point)−High\text{Support} = (2 \times \text{Pivot Point}) - \text{High}Support=(2×Pivot Point)−High

        Resistance=(2×Pivot Point)−Low\text{Resistance} = (2 \times \text{Pivot Point}) - \text{Low}Resistance=(2×Pivot Point)−Low

        In formulas ko use karke aap easily support aur resistance levels calculate kar sakte hain jo market ke behavior ko better understand karne mein madad karte hain. Pivot point ke accurate calculation ke liye market data ka analysis zaroori hai, jo aapko trading decisions ko optimize karne mein help karta hai.

        Is calculation ko daily basis pe update karna zaroori hai taake aap market ke latest trends aur movements ko reflect kar saken. Accurate calculation se aap market ke potential reversal points ko better predict kar sakte hain aur apni trading strategy ko accordingly adjust kar sakte hain. Pivot point ka calculation trading decisions mein key role play karta hai aur market analysis ko enhance karta hai.

        4. Support Aur Resistance Levels

        Pivot point ke sath sath, support aur resistance levels bhi market analysis mein important role play karte hain. Support level wo point hota hai jahan se market ki price neeche nahi girti aur resistance level wo point hota hai jahan se price upar nahi chalti. Ye levels market ke behavior aur trends ko analyze karne mein madad karte hain aur potential trading opportunities ko identify karne mein help karte hain.

        Support aur resistance levels ko calculate karne ke liye pivot point ke around high, low, aur closing prices ko consider kiya jata hai. Support aur resistance levels ke calculation ka formula kuch is tarah hota hai:

        Support=(2×Pivot Point)−High\text{Support} = (2 \times \text{Pivot Point}) - \text{High}Support=(2×Pivot Point)−High

        Resistance=(2×Pivot Point)−Low\text{Resistance} = (2 \times \text{Pivot Point}) - \text{Low}Resistance=(2×Pivot Point)−Low

        Ye formulas market ke potential reversal points ko identify karne mein madad karte hain aur trading decisions ko optimize karne mein help karte hain. Support aur resistance levels ka analysis karke, traders market ke behavior aur trends ko samajh sakte hain aur accordingly apni trading strategies ko adjust kar sakte hain.

        Support aur resistance levels ke analysis se aap market ke potential reversal points ko identify kar sakte hain aur trading decisions ko behtar banane mein madad milti hai. Ye levels market ke psychological levels ko reflect karte hain aur traders ko market ki direction ka idea dete hain. Isliye, support aur resistance levels ka analysis trading strategy ko enhance karne mein kaafi effective hota hai.

        Iske ilawa, support aur resistance levels ko market ki volatility ke hisab se adjust kiya jata hai. Market ki changing conditions aur trends ko dekhte hue, support aur resistance levels ko regularly update karna zaroori hai taake aap market ke latest movements ko reflect kar saken. Accurate analysis aur regular updates se aap apni trading strategy ko optimize kar sakte hain aur market ki potential trading opportunities ko identify kar sakte hain.

        5. Pivot Point Ke Types

        Pivot points ke mukhtalif types hain jo trading analysis mein use kiye jate hain. In types ke mukhtalif methods aur calculations hain jo market ke trends aur behavior ko analyze karne mein madadgar hote hain. Pivot points ke types mein standard pivot points, Fibonacci pivot points, aur Woodie’s pivot points shamil hain.

        Standard Pivot Points sab se zyada use hone wale pivot points hain jo previous session ke high, low aur closing prices se calculate kiye jate hain. Ye basic aur commonly accepted method hai jo market ke behavior ko reflect karta hai aur trading decisions ko behtar banane mein madad karta hai. Standard pivot points ki calculation simple hoti hai aur ye daily trading decisions mein behtar insights provide karti hai.

        Fibonacci Pivot Points Fibonacci sequence ke levels ka use karke calculate kiye jate hain. Ye method market ke psychological levels ko identify karne mein madadgar hota hai. Fibonacci pivot points ka use karke traders market ke potential reversal points aur support/resistance levels ko identify kar sakte hain. Ye method market ki volatility aur trends ko accurately reflect karta hai aur trading decisions ko enhance karne mein madad karta hai.

        Woodie’s Pivot Points market ki sentiment ko reflect karte hain aur previous session ki closing price ko zyada importance dete hain. Ye method short-term traders ke liye behtar hota hai jo market ke quick movements aur trends ko analyze karte hain. Woodie’s pivot points ki calculation aur interpretation se traders market ke short-term trends aur behavior ko better understand kar sakte hain.

        Har type ki pivot points ki calculation aur interpretation ki apni methodology hoti hai jo trading strategy ko enhance karne mein madad karti hai. In types ko samajh kar aur use karke aap apni trading strategy ko better optimize kar sakte hain aur market ke potential reversal points ko identify kar sakte hain. Trading decisions ko behtar banane ke liye pivot points ke mukhtalif types ko integrate karna zaroori hai.

        6. Standard Pivot Points

        Standard pivot points ko calculate karna relatively simple hai aur ye market analysis ke liye aik basic method hai. Is method mein previous trading session ki high, low, aur closing prices ka use kiya jata hai. Standard pivot point ke calculation ke liye formula ye hai:

        Pivot Point=High+Low+Close3\text{Pivot Point} = \frac{\text{High} + \text{Low} + \text{Close}}{3}Pivot Point=3High+Low+Close​

        Is formula ko use karke aap easily pivot point calculate kar sakte hain jo market ke potential reversal points ko identify karne mein madad karta hai. Standard pivot points ko use karke traders market ke behavior aur trends ko analyze kar sakte hain aur accordingly trading decisions le sakte hain.

        Standard pivot points ka analysis karke aap support aur resistance levels ko bhi calculate kar sakte hain jo market ke potential reversal points ko identify karne mein madadgar hote hain. Is method ko daily trading decisions mein integrate karna zaroori hai taake aap market ke latest trends aur movements ko reflect kar saken. Standard pivot points ki simplicity aur effectiveness ise trading analysis ke liye aik popular choice banati hai.

        Iske ilawa, standard pivot points ko use karke aap market ke psychological levels ko bhi identify kar sakte hain. Ye levels market ke sentiment ko reflect karte hain aur trading decisions ko behtar banane mein madad karte hain. Standard pivot points ko daily basis pe update karna zaroori hai taake aap market ke latest data ko reflect kar saken aur trading strategy ko accordingly adjust kar saken.

        7. Fibonacci Pivot Points

        Fibonacci pivot points Fibonacci sequence ke levels ka use karke calculate kiye jate hain. Ye method market ke psychological levels ko identify karne mein madadgar hota hai aur trading decisions ko behtar banane mein help karta hai. Fibonacci pivot points ki calculation ke liye previous trading session ke high, low, aur closing prices ka use kiya jata hai.

        Fibonacci pivot points ko calculate karne ke liye, aapko Fibonacci retracement levels ka use karna padta hai. Ye levels market ke potential support aur resistance points ko identify karne mein madadgar hote hain. Fibonacci pivot points ke calculation ke liye specific levels jaise 23.6%, 38.2%, 50%, aur 61.8% ka use kiya jata hai jo market ke psychological levels ko reflect karte hain.

        Fibonacci pivot points ko use karke traders market ke potential reversal points aur trading opportunities ko identify kar sakte hain. Ye method market ke psychological levels ko accurately capture karta hai aur trading decisions ko optimize karne mein madad karta hai. Fibonacci pivot points ki understanding se aap market ke behavior aur trends ko better predict kar sakte hain.

        Is method ko use karke aap market ke support aur resistance levels ko bhi accurately identify kar sakte hain. Fibonacci pivot points ki accuracy aur effectiveness ise trading analysis ke liye aik valuable tool banati hai. Ye method market ke psychological levels ko reflect karta hai aur trading decisions ko behtar banane mein madadgar hota hai.

        8. Woodie’s Pivot Points

        Woodie’s pivot points market ki sentiment ko reflect karte hain aur previous session ki closing price ko zyada importance dete hain. Ye method short-term traders ke liye behtar hota hai jo market ke quick movements aur trends ko analyze karte hain. Woodie’s pivot points ke calculation ke liye, previous session ki closing price ko major role diya jata hai.

        Woodie’s pivot points ko calculate karne ke liye specific formulas ka use kiya jata hai jo market ke short-term trends aur behavior ko reflect karte hain. Is method mein previous session ki closing price ko pivot point ke calculation mein zyada importance di jati hai jo market ke sentiment aur trends ko accurately capture karta hai.

        Woodie’s pivot points ko use karke traders market ke short-term movements aur potential reversal points ko identify kar sakte hain. Ye method quick trading decisions aur short-term trends ke analysis ke liye kaafi effective hota hai. Woodie’s pivot points ki understanding se aap market ke short-term behavior aur sentiment ko better predict kar sakte hain.

        Is method ko daily trading decisions mein integrate karna zaroori hai taake aap market ke quick movements aur trends ko reflect kar saken. Woodie’s pivot points ko use karke aap market ke potential reversal points aur trading opportunities ko accurately identify kar sakte hain. Ye method short-term trading ke liye aik valuable tool hai jo trading strategy ko enhance karne mein madad karta hai.

        9. Pivot Point Trading Strategy

        Pivot point trading strategy ko use karke traders market ke trends aur potential reversal points ko analyze karte hain. Is strategy mein pivot point ke around support aur resistance levels ko identify kiya jata hai jo market ke behavior aur trends ko reflect karte hain. Pivot point trading strategy ka use karke aap trading decisions ko optimize kar sakte hain aur market ke potential movements ko better predict kar sakte hain.

        Pivot point trading strategy ko implement karne ke liye, aapko pivot point, support, aur resistance levels ko accurately calculate karna zaroori hai. Is strategy mein, jab price pivot point ko break karti hai, to ye potential trading signals generate karta hai. Traders in signals ko analyze kar ke buy ya sell decisions le sakte hain.

        Is strategy ka use karke aap market ke potential reversal points aur trading opportunities ko identify kar sakte hain. Pivot point trading strategy ka effective implementation market ke trends aur behavior ko accurately reflect karta hai aur trading decisions ko behtar banane mein madad karta hai. Accurate calculation aur interpretation se aap trading strategy ko optimize kar sakte hain aur trading performance ko enhance kar sakte hain.

        Pivot point trading strategy ko risk management ke sath integrate karna bhi zaroori hai. Is strategy mein risk management techniques ko use karke aap apni trading positions ko manage kar sakte hain aur market ke potential risks ko minimize kar sakte hain. Pivot point trading strategy ke sath sath, risk management techniques ko bhi apply karna zaroori hai taake aap trading decisions ko effectively manage kar saken.

        10. Pivot Points Ka Role Market Analysis Mein

        Pivot points market analysis mein aik important role play karte hain. Ye levels market ke potential reversal points aur trading opportunities ko identify karne mein madadgar hote hain. Pivot points ko use karke aap market ke trends aur behavior ko analyze kar sakte hain aur accordingly trading decisions le sakte hain.

        Pivot points ke analysis se aap market ke support aur resistance levels ko accurately identify kar sakte hain. Ye levels market ke psychological levels ko reflect karte hain aur trading decisions ko behtar banane mein madad karte hain. Pivot points ka role market analysis mein aapko market ke potential movements aur trading opportunities ko identify karne mein help karta hai.

        Market analysis ke liye pivot points ka use karke aap market ke overall behavior aur trends ko better understand kar sakte hain. Ye levels market ke potential reversal points ko identify karte hain aur trading decisions ko optimize karne mein madadgar hote hain. Pivot points ka effective use market analysis ko enhance karta hai aur trading performance ko improve karta hai.

        Iske ilawa, pivot points ka role market ke volatility aur trends ko accurately capture karne mein bhi hota hai. Accurate analysis aur interpretation se aap market ke potential reversal points aur trading opportunities ko better identify kar sakte hain. Pivot points ke use se aap market ke trends aur behavior ko behtar samajh sakte hain aur trading decisions ko accordingly adjust kar sakte hain.

        11. Trading Signals Aur Pivot Points

        Pivot points trading signals generate karte hain jo traders ko buy ya sell signals dete hain. Jab market price pivot point ko break karti hai, to ye potential trading signals generate karta hai. Pivot points ke around support aur resistance levels ke analysis se trading signals ko identify kiya jata hai jo market ke behavior aur trends ko reflect karte hain.

        Trading signals ko accurately interpret karna zaroori hai taake aap trading decisions ko effectively manage kar saken. Pivot points ke around trading signals ko analyze karke aap market ke potential reversal points aur trading opportunities ko identify kar sakte hain. Ye signals market ke psychological levels aur trends ko reflect karte hain aur trading decisions ko optimize karne mein madadgar hote hain.

        Trading signals ko implement karne ke liye aapko market ke trends aur behavior ko accurately analyze karna zaroori hai. Pivot points ka use karke aap market ke potential movements aur trading opportunities ko better predict kar sakte hain. Accurate interpretation aur timely execution se aap trading performance ko enhance kar sakte hain aur market ke potential risks ko manage kar sakte hain.

        Iske ilawa, trading signals ke sath sath risk management techniques ko bhi apply karna zaroori hai. Pivot points ke analysis se aap trading signals ko accurately identify kar sakte hain aur risk management techniques ke zariye trading positions ko effectively manage kar sakte hain. Ye approach aapki trading strategy ko behtar banane mein madad karta hai aur market ke potential risks ko minimize karta hai.

        12. Pivot Points Aur Risk Management

        Pivot points risk management mein bhi important role play karte hain. Traders pivot points ko stop-loss aur take-profit levels determine karne ke liye use karte hain jo unke risk exposure ko manage karte hain. Pivot points ke around support aur resistance levels ko analyze karke aap apni trading positions ko effectively manage kar sakte hain.

        Risk management techniques ko pivot points ke analysis ke sath integrate karna zaroori hai taake aap trading risks ko minimize kar saken. Pivot points ka use karke aap market ke potential reversal points aur trading opportunities ko accurately identify kar sakte hain. Isse aapki trading strategy ko optimize karne mein madad milti hai aur risk exposure ko manage karna asaan hota hai.

        Pivot points ke sath sath, risk management techniques jaise stop-loss aur take-profit levels ko bhi effectively use karna zaroori hai. Ye techniques aapki trading positions ko manage karte hain aur market ke potential risks ko minimize karte hain. Pivot points ko risk management ke sath integrate kar ke aap apni trading performance ko enhance kar sakte hain aur overall trading strategy ko optimize kar sakte hain.

        Iske ilawa, risk management ke liye market ke volatility aur trends ko accurately analyze karna zaroori hai. Pivot points ka use karke aap market ke psychological levels aur behavior ko samajh sakte hain aur accordingly apne risk management techniques ko adjust kar sakte hain. Ye approach aapke trading strategy ko behtar banane mein madad karta hai aur market ke potential risks ko manage karne mein help karta hai.

        13. Limitations Of Pivot Points

        Pivot points ke kuch limitations bhi hain jo trading decisions ko affect kar sakti hain. Pivot points market ki volatility ko accurately capture nahi kar sakte aur kabhi kabhi false signals generate ho sakte hain. Isliye, pivot points ko other technical indicators ke sath use karna chahiye taake aap market ke behavior aur trends ko accurately analyze kar saken.

        Pivot points ke limitations ko samajhna zaroori hai taake aap apni trading strategy ko accordingly adjust kar saken. Market ki volatility aur trends ko accurately capture karne ke liye, pivot points ko other technical indicators ke sath integrate karna chahiye. Ye approach aapko market ke potential movements aur trading opportunities ko better predict karne mein madad karta hai.

        Pivot points ke limitations ke bawajood, ye ek valuable tool hai jo market analysis aur trading decisions ko enhance karne mein madad karta hai. Accurate calculation aur interpretation se aap market ke behavior aur trends ko better understand kar sakte hain. Pivot points ko other technical indicators ke sath use karke aap apni trading strategy ko optimize kar sakte hain aur market ke potential risks ko manage kar sakte hain.

        Trading decisions ko behtar banane ke liye, pivot points ko limitations ke sath sath unki strengths ko bhi samajhna zaroori hai. Market ke behavior aur trends ko accurately capture karne ke liye, pivot points ko comprehensive analysis aur risk management techniques ke sath use karna chahiye. Ye approach aapko trading strategy ko optimize karne mein madad karta hai aur market ke potential risks ko minimize karne mein help karta hai.

        14. Conclusion

        Pivot point forex trading mein aik essential tool hai jo market trends ko analyze karne aur trading decisions ko optimize karne mein madad karta hai. Pivot point ke accurate calculation aur interpretation se traders market ke potential reversal points ko identify kar sakte hain aur apni trading strategy ko enhance kar sakte hain. Ye concept trading decisions ko behtar banane mein madad karta hai aur market ke behavior aur trends ko accurately reflect karta hai.

        Pivot points ke mukhtalif types aur calculations ko samajh kar aap apni trading strategy ko better optimize kar sakte hain. Standard, Fibonacci, aur Woodie’s pivot points ke analysis se aap market ke potential reversal points aur trading opportunities ko identify kar sakte hain. Ye types market ke psychological levels aur behavior ko accurately capture karte hain aur trading decisions ko enhance karte hain.

        Iske ilawa, pivot points ka role risk management aur trading signals ko accurately generate karne mein bhi hota hai. Accurate calculation aur timely execution se aap trading performance ko improve kar sakte hain aur market ke potential risks ko manage kar sakte hain. Pivot points ke limitations ko samajh kar aur other technical indicators ke sath use karke aap apni trading strategy ko optimize kar sakte hain aur market ke behavior ko better understand kar sakte hain.

        Aakhir mein, pivot points forex trading mein aik valuable tool hain jo market analysis aur trading decisions ko enhance karne mein madadgar hote hain. Accurate calculation, interpretation, aur integration se aap apni trading strategy ko optimize kar sakte hain aur market ke potential risks ko effectively manage kar sakte hain.
        • #5 Collapse

          Pivot Point Kya Hai Forex Mein?


          1. Pivot Point Ka Taaruf

          Forex trading mein pivot point ek ahem technical indicator hai jo price movement aur market trends ko analyze karne mein madad deta hai. Yeh indicator trading strategies mein frequently use hota hai kyunki yeh traders ko potential support aur resistance levels ko identify karne mein madad karta hai. Pivot point ki concept trading ke traditional methods se nikal kar modern trading strategies mein integrate ki gayi hai, jo traders ko zyada informed decisions lene mein madad karti hai.

          Pivot point ko calculate karne ka main purpose market ke equilibrium point ko find karna hai. Jab market pivot point ke aas paas hota hai, toh yeh indicate karta hai ke market balance mein hai aur future direction uncertain ho sakti hai. Pivot point ki calculation market ke previous highs, lows, aur closing prices ko consider karti hai, jo ki trading decisions ko impact karte hain. Traders pivot point ke around ke levels ko watch karte hain, jo unhein potential entry aur exit points provide karte hain.

          Yeh indicator market ki sentiment ko bhi gauge karne mein madad karta hai. Jab price pivot point se upar move karti hai, toh yeh bullish sentiment ko show karti hai, aur jab niche move karti hai, toh bearish sentiment ko indicate karti hai. Pivot point ki understanding aur implementation se traders market ki behavior ko better predict kar sakte hain aur effective trading strategies develop kar sakte hain.

          Pivot point ka concept Forex trading ke ilawa bhi different markets, jaise stocks aur commodities, mein use hota hai. Yeh indicator market trends ko samajhne ke liye ek standard tool hai jo traders ko market ki potential direction aur price levels ko assess karne mein help karta hai. Pivot point ke alawa bhi market analysis ke liye kai aur tools available hain, magar pivot point ka simplicity aur effectiveness isse ek valuable tool banata hai.

          Pivot point ka use trading strategies mein integrate karne se pehle, traders ko iska basic understanding hona chahiye. Iske calculation methods, support aur resistance levels, aur market trends ke impact ko samajhna zaroori hai taake pivot point ko effectively use kiya ja sake. Yeh ek tool hai jo market ke behavior ko analyze karne mein madad karta hai, lekin traders ko apne research aur analysis ke saath saath decision making karni chahiye.

          2. Pivot Point Ki Calculation

          Pivot point ki calculation Forex trading mein ek fundamental aspect hai jo traders ko market trends aur price levels ko assess karne mein madad deti hai. Pivot point ko calculate karne ka basic formula hai: Pivot Point=High+Low+Close3\text{Pivot Point} = \frac{\text{High} + \text{Low} + \text{Close}}{3}Pivot Point=3High+Low+Close​ Jahan High, Low aur Close previous trading period ke price points hain. Yeh formula market ke previous period ke highest, lowest aur closing prices ko average karke ek central point provide karta hai jo market ke potential direction ko indicate karta hai.

          Calculation ka process simple hai lekin iska impact significant hota hai. Pivot point ke calculation ke liye accurate high, low, aur close prices ka hona zaroori hai. Yeh prices usually daily trading period ke liye use kiye jate hain, lekin traders weekly ya monthly trading periods ke liye bhi pivot points calculate kar sakte hain. Yeh calculation market ki trends aur price movements ko understand karne mein help karta hai.

          Pivot point ki calculation ke baad, traders support aur resistance levels ko bhi calculate karte hain. Support aur resistance levels pivot point ke around ke price points hote hain jo market ke potential reversal points ko indicate karte hain. Support aur resistance levels ke calculation ke liye additional formulas use kiye jate hain, jo traders ko market ke key levels ko identify karne mein madad karte hain.

          Pivot point ki calculation ke liye accurate data ka hona essential hai. Agar high, low aur close prices galat hain, toh pivot point aur support-resistance levels bhi inaccurate honge. Isliye, traders ko reliable sources se data collect karna chahiye aur calculation ko carefully perform karna chahiye. Accurate pivot points aur levels market ke analysis aur trading decisions ke liye crucial hote hain.

          Pivot point ki calculation ka process aur methods traders ko market ke behavior ko samajhne mein madad karte hain. Yeh indicator market ke potential direction aur price levels ko predict karne mein assist karta hai, jo trading strategies ko develop karne mein helpful hota hai. Pivot point ke calculation ke through, traders market ke trends aur fluctuations ko better analyze kar sakte hain.

          3. Support Aur Resistance Levels

          Support aur resistance levels pivot point ke around ke important levels hain jo market ke potential reversal points ko indicate karte hain. Support level wo point hota hai jahan price niche jane ki koshish karti hai, lekin wahan se wapas uthti hai. Resistance level wo point hota hai jahan price upar jane ki koshish karti hai, lekin wahan se niche aati hai. Yeh levels market ke trends aur price movements ko analyze karne mein madad karte hain.

          Support aur resistance levels ki calculation pivot point ke basis par ki jati hai. Support levels ko calculate karne ke liye formulas hain: Support Level 1=2×Pivot Point−High\text{Support Level 1} = 2 \times \text{Pivot Point} - \text{High}Support Level 1=2×Pivot Point−High Support Level 2=Pivot Point−(High−Low)\text{Support Level 2} = \text{Pivot Point} - (\text{High} - \text{Low})Support Level 2=Pivot Point−(High−Low) Yeh formulas market ke potential support levels ko identify karte hain jo price ke neeche jane ki soorat mein act karte hain. Support levels price ke neeche move karne se rokne mein madadgar hote hain aur traders ko entry points identify karne mein assist karte hain.

          Resistance levels ko calculate karne ke liye formulas hain: Resistance Level 1=2×Pivot Point−Low\text{Resistance Level 1} = 2 \times \text{Pivot Point} - \text{Low}Resistance Level 1=2×Pivot Point−Low Resistance Level 2=Pivot Point+(High−Low)\text{Resistance Level 2} = \text{Pivot Point} + (\text{High} - \text{Low})Resistance Level 2=Pivot Point+(High−Low) Yeh formulas market ke potential resistance levels ko identify karte hain jo price ke upar jane ki soorat mein act karte hain. Resistance levels price ke upar move karne se rokne mein madadgar hote hain aur traders ko exit points identify karne mein assist karte hain.

          Support aur resistance levels ka analysis market ke trends aur price movements ko samajhne mein madad karta hai. Jab price support level ke paas hoti hai, toh yeh indicate karta hai ke market ko support mil raha hai aur price wahan se upar move kar sakti hai. Jab price resistance level ke paas hoti hai, toh yeh indicate karta hai ke market resistance face kar raha hai aur price wahan se niche aa sakti hai.

          Support aur resistance levels ko monitor karne se traders ko market ke potential reversal points aur price fluctuations ko samajhne mein madad milti hai. Yeh levels trading strategies aur decisions ke liye important hota hai. Traders ko chahiye ke woh support aur resistance levels ke sath pivot points ko bhi consider karen taake accurate trading decisions le saken.

          4. Pivot Point Ka Use Kaise Karein

          Pivot point ka use Forex trading mein market trends aur price levels ko analyze karne ke liye kiya jata hai. Jab price pivot point ke upar hoti hai, toh yeh bullish sentiment ko indicate karta hai aur jab niche hoti hai, toh bearish sentiment ko indicate karta hai. Pivot point ka use trading decisions ke liye ek valuable tool hai jo traders ko market ke potential direction aur key levels ko identify karne mein madad karta hai.

          Traders pivot point ke aas paas ke support aur resistance levels ko monitor karte hain. Jab price support level ke paas hoti hai aur wahan se upar move karti hai, toh yeh indicate karta hai ke market bullish ho sakta hai. Jab price resistance level ke paas hoti hai aur wahan se niche move karti hai, toh yeh indicate karta hai ke market bearish ho sakta hai. Pivot point ke saath support aur resistance levels ko consider karne se traders ko entry aur exit points identify karne mein madad milti hai.

          Pivot point ka use intraday trading mein bhi kiya jata hai. Intraday traders daily market trends aur fluctuations ko analyze karte hain aur pivot point ke levels ko monitor karte hain taake accurate trading decisions le saken. Pivot point ke aas paas ke price movements aur support-resistance levels intraday trading strategies mein help karte hain.

          Pivot point ka use long-term trading strategies mein bhi kiya jata hai. Long-term traders weekly ya monthly pivot points ko calculate karte hain aur unhe market ke overall trends aur price levels ko understand karne ke liye use karte hain. Pivot point ke saath saath long-term traders other technical indicators aur analysis tools bhi use karte hain taake comprehensive market analysis kiya ja sake.

          Pivot point ka effective use trading decisions ko enhance karne mein madad karta hai. Traders ko chahiye ke woh pivot point ke saath market analysis ke other tools aur techniques bhi use karen taake accurate aur informed trading decisions le saken. Pivot point ka use trading strategies ko refine karne aur market ke behavior ko better understand karne ke liye kiya jata hai.

          5. Intraday Trading Mein Pivot Point

          Intraday trading mein pivot point ka use daily market trends aur price movements ko analyze karne ke liye kiya jata hai. Intraday traders pivot point ke levels ko monitor karte hain taake short-term trading opportunities ko identify kar saken. Pivot point ka use intraday trading mein market ke potential reversal points aur key levels ko understand karne mein help karta hai.

          Intraday traders daily trading periods ke liye pivot point calculate karte hain. Yeh calculation daily high, low, aur close prices ke basis par ki jati hai. Pivot point ke aas paas ke support aur resistance levels intraday trading decisions ko influence karte hain. Jab price pivot point ke aas paas hoti hai, toh traders market ke short-term trends ko monitor karte hain aur potential trading opportunities ko identify karte hain.

          Intraday trading mein pivot point ka use market ke volatility aur fluctuations ko manage karne mein bhi madad karta hai. Pivot point ke aas paas ke price movements aur support-resistance levels market ke short-term trends aur volatility ko indicate karte hain. Traders pivot point aur other technical indicators ko combine karke accurate trading signals aur strategies develop karte hain.

          Intraday traders pivot point ke saath additional tools aur indicators bhi use karte hain, jaise moving averages aur oscillators. Yeh tools market ke short-term trends aur price movements ko analyze karne mein madad karte hain. Pivot point ke sath combined use se traders ko zyada accurate aur reliable trading signals milte hain.

          Intraday trading mein pivot point ka effective use market ke short-term trends aur fluctuations ko samajhne mein madad karta hai. Traders ko chahiye ke woh pivot point ke sath saath market analysis ke other tools aur techniques ko bhi use karen taake trading decisions zyada informed aur accurate ho saken.

          6. Pivot Point Aur Market Trends

          Pivot point market trends ko identify karne mein ek useful tool hai. Jab market pivot point ke upar trade kar raha hota hai, toh yeh indicate karta hai ke market bullish trend mein hai. Agar market pivot point ke niche trade kar raha hota hai, toh yeh bearish trend ko indicate karta hai. Pivot point ka use market ke overall trends aur price movements ko analyze karne ke liye kiya jata hai.

          Market trends ke analysis ke liye pivot point ke aas paas ke support aur resistance levels ko monitor kiya jata hai. Jab price pivot point ke aas paas hoti hai, toh yeh market ke equilibrium aur potential direction ko indicate karta hai. Market ke upar ya niche move karne se traders ko market ke bullish ya bearish trends ka idea milta hai.

          Pivot point market trends ko short-term aur long-term perspectives se analyze karne mein madad karta hai. Short-term traders daily pivot points ko consider karte hain, jabke long-term traders weekly ya monthly pivot points ko analyze karte hain. Pivot point ke saath saath other technical indicators aur tools bhi use kiye jate hain taake market trends ko comprehensively understand kiya ja sake.

          Pivot point ke analysis se traders ko market ke potential reversal points aur key levels ko identify karne mein madad milti hai. Market trends ko samajhne se traders ko accurate trading decisions aur strategies develop karne mein help milti hai. Pivot point ke saath saath traders ko market ke overall sentiment aur behavior ko bhi consider karna chahiye.

          Pivot point ka effective use market trends aur price movements ko analyze karne mein madad karta hai. Traders ko chahiye ke woh pivot point ke saath market analysis ke other tools aur techniques ko bhi use karen taake trading decisions zyada accurate aur reliable ho saken. Market trends ko analyze karne se traders ko better trading strategies aur opportunities milti hain.

          7. Pivot Point Aur Volatility

          Pivot point market ki volatility ko measure karne mein bhi madad karta hai. Jab price pivot point ke aas paas se kafi zyada move karti hai, toh yeh indicate karta hai ke market mein zyada volatility hai. Low volatility ka matlab hota hai ke price pivot point ke aas paas stable hai. Pivot point ki volatility analysis trading decisions aur strategies ko influence karti hai.

          Market ki volatility ko understand karne ke liye pivot point ke saath support aur resistance levels ko bhi consider kiya jata hai. Agar price pivot point se kafi zyada move karti hai, toh yeh signal hota hai ke market mein strong trends aur fluctuations hain. High volatility ke periods mein traders ko careful aur calculated trading decisions lene chahiye.

          Volatility ke analysis se traders ko market ke trends aur price movements ka better understanding milta hai. Pivot point ke saath volatility analysis market ke potential direction aur price levels ko predict karne mein madad karta hai. Traders ko chahiye ke woh market ki volatility aur fluctuations ko monitor karen taake accurate trading signals aur strategies develop kar saken.

          Pivot point aur volatility ke analysis se traders ko market ke risk aur opportunities ko assess karne mein madad milti hai. High volatility periods mein trading strategies ko adjust karna zaroori hota hai. Traders ko chahiye ke woh market ke volatility aur trends ko consider karen taake effective aur profitable trading decisions le saken.

          Pivot point aur volatility ka combination traders ko market ke behavior aur fluctuations ko samajhne mein madad karta hai. Yeh analysis trading strategies aur decisions ko enhance karne ke liye useful hota hai. Traders ko chahiye ke woh pivot point ke saath market analysis ke other tools aur techniques ko bhi use karen taake trading decisions zyada informed aur accurate ho saken.

          8. Different Types of Pivot Points

          Forex trading mein mukhtalif types ke pivot points use kiye jate hain, jaise ki Fibonacci pivot points, Woodie pivot points aur Camarilla pivot points. Har type ki pivot point ki calculation aur use ka tareeqa thoda different hota hai. Different types ke pivot points traders ko market ke different perspectives aur trends ko analyze karne mein madad karte hain.

          Fibonacci Pivot Points: Yeh pivot points Fibonacci retracement levels ke basis par calculate kiye jate hain. Fibonacci levels market ke potential support aur resistance levels ko identify karne mein madad karte hain. Fibonacci pivot points traders ko market ke key levels aur price movements ko understand karne mein assist karte hain.

          Woodie Pivot Points: Woodie pivot points ki calculation traditional pivot points se thodi different hoti hai. Yeh pivot points market ke previous high, low, aur close prices ke basis par calculate kiye jate hain, lekin yeh calculate karne ka method different hota hai. Woodie pivot points traders ko market ke potential support aur resistance levels ko identify karne mein madad karte hain.

          Camarilla Pivot Points: Camarilla pivot points ki calculation bhi unique hoti hai aur yeh market ke high, low, aur close prices ke basis par calculate kiye jate hain. Camarilla pivot points traders ko market ke short-term support aur resistance levels ko identify karne mein madad karte hain. Yeh pivot points market ke volatility aur price movements ko analyze karne mein help karte hain.

          Har type ke pivot points ki calculation aur use ka method different hota hai, lekin inka purpose market ke key levels aur trends ko analyze karna hota hai. Traders ko chahiye ke woh different types ke pivot points ko understand karen aur unka use market analysis aur trading decisions ke liye karein.

          Pivot points ka use trading strategies aur decisions ko enhance karne mein madad karta hai. Traders ko different types ke pivot points ke benefits aur limitations ko samajhna chahiye taake woh market ke behavior ko better analyze kar saken. Different types ke pivot points ka use market ke trends aur price movements ko comprehensive way mein analyze karne ke liye kiya jata hai.

          9. Pivot Point Ki Limitations

          Pivot point ek predictive tool hai aur har situation mein accurate nahi hota. Yeh market ke trends aur price movements ko predict karne mein madad karta hai, lekin market conditions ke mutabiq changes aa sakte hain. Pivot point ke limitations ko samajhna traders ke liye zaroori hai taake woh apne trading decisions ko better manage kar saken.

          Pivot point ki limitations mein ek major limitation yeh hai ke yeh ek lagging indicator hai. Lagging indicators market ke past data ke basis par analysis karte hain aur current market conditions ko accurately reflect nahi karte. Isliye, pivot point ke sath saath other technical indicators aur tools bhi use karne chahiye taake accurate trading signals mil saken.

          Another limitation yeh hai ke pivot point market ke volatility aur fluctuations ko accurately measure nahi kar sakta. High volatility periods mein pivot point ki accuracy kam ho sakti hai aur market ke trends aur price movements ko predict karna mushkil ho sakta hai. Traders ko pivot point ke sath market ki volatility aur fluctuations ko bhi consider karna chahiye.

          Pivot point ke limitations ko manage karne ke liye traders ko additional research aur analysis tools use karne chahiye. Technical indicators aur market analysis tools pivot point ke saath combine karke trading decisions ko enhance kiya ja sakta hai. Yeh combination traders ko market ke behavior ko better understand karne aur accurate trading decisions lene mein madad karta hai.

          Pivot point ki limitations ko samajhna aur manage karna traders ke liye important hai taake woh effective aur reliable trading strategies develop kar saken. Pivot point ek valuable tool hai, lekin iska effective use market analysis ke other tools aur techniques ke saath kiya jana chahiye. Traders ko chahiye ke woh pivot point ke limitations ko understand karen aur apne trading decisions ko accordingly adjust karen.

          10. Pivot Point Ka Historical Analysis

          Pivot point ka historical analysis trading decisions ke liye useful hota hai. Historical analysis market ke previous pivot points aur price movements ko study karke market ke trends aur patterns ko understand karne mein madad karta hai. Traders historical data ko analyze karke market ke potential direction aur price levels ko predict kar sakte hain.

          Historical analysis se traders ko market ke past trends aur price movements ka idea milta hai. Previous trading periods ke pivot points aur support-resistance levels ko analyze karne se market ke behavior aur fluctuations ko samajhne mein madad milti hai. Yeh analysis trading strategies aur decisions ko enhance karne ke liye useful hota hai.

          Pivot point ke historical analysis ke liye traders ko historical price data aur pivot points ko study karna chahiye. Yeh analysis market ke past behavior aur trends ko samajhne mein madad karta hai aur future trading decisions ko influence karta hai. Traders ko chahiye ke woh historical analysis ke results ko market ke current conditions ke sath combine karen.

          Historical analysis se traders ko market ke potential reversal points aur key levels ka idea milta hai. Pivot point ke historical data ko study karke traders market ke key levels aur trends ko better understand kar sakte hain. Yeh analysis trading strategies aur decisions ko accurate aur reliable banane mein madad karta hai.

          Pivot point ka historical analysis trading decisions aur strategies ko enhance karne ke liye important hai. Traders ko chahiye ke woh historical data ko analyze karen aur uske results ko market analysis ke saath combine karen. Yeh approach trading decisions ko better manage karne aur market ke behavior ko accurately understand karne mein madad karta hai.

          11. Pivot Point Aur Risk Management

          Pivot point trading decisions ke liye ek useful tool hai, lekin risk management bhi trading success ke liye zaroori hai. Risk management strategies pivot point ke analysis ko complement karti hain aur traders ko potential losses aur risks ko minimize karne mein madad karti hain. Effective risk management trading decisions ko enhance karne aur market ke volatility ko handle karne mein madad karta hai.

          Risk management strategies pivot point ke saath combine karke trading decisions ko secure aur reliable banane mein madad karti hain. Traders ko chahiye ke woh stop-loss aur take-profit levels ko pivot point ke analysis ke sath set karen. Yeh levels market ke volatility aur price movements ko manage karne mein madad karte hain.

          Pivot point ke sath risk management strategies use karke traders ko market ke potential risks aur rewards ko assess karne mein madad milti hai. Effective risk management trading strategies ko enhance karne aur market ke fluctuations ko manage karne ke liye useful hoti hai. Traders ko chahiye ke woh risk management techniques ko apni trading strategies mein incorporate karen.

          Pivot point aur risk management ka combination traders ko trading decisions ko effectively manage karne mein madad karta hai. Traders ko market ke behavior aur volatility ko monitor karna chahiye aur risk management strategies ko adjust karna chahiye. Yeh approach trading success aur profitability ko enhance karne ke liye useful hota hai.

          Risk management ke saath pivot point ka use trading decisions ko accurate aur reliable banane mein madad karta hai. Traders ko chahiye ke woh risk management techniques ko apne trading strategies ke sath combine karen taake market ke potential risks aur rewards ko better manage kar saken. Pivot point aur risk management ka combination effective trading strategies aur decisions ko develop karne mein madad karta hai.

          12. Pivot Point Ka Psychological Aspect

          Pivot point ka psychological aspect trading decisions aur market behavior ko influence karne mein madad karta hai. Market participants pivot point ke key levels ko psychological benchmarks ke roop mein dekhte hain. Yeh psychological factors market ke trends aur price movements ko affect karte hain.

          Market participants pivot point ke key levels ko support aur resistance levels ke roop mein consider karte hain. Jab price pivot point ke aas paas hoti hai, toh yeh psychological benchmarks ke roop mein kaam karti hai aur traders ke behavior ko influence karti hai. Traders market ke psychological aspects ko consider karke trading decisions lete hain.

          Pivot point ka psychological aspect market ke sentiment aur behavior ko analyze karne mein madad karta hai. Traders ko chahiye ke woh market ke psychological factors ko consider karen aur apne trading strategies ko accordingly adjust karen. Yeh approach market ke behavior aur price movements ko accurately understand karne ke liye useful hota hai.

          Psychological aspects ka analysis trading decisions aur strategies ko enhance karne ke liye important hai. Traders ko pivot point ke psychological aspects ko market analysis ke saath combine karna chahiye. Yeh combination trading decisions ko better manage karne aur market ke behavior ko accurately understand karne mein madad karta hai.

          Pivot point aur psychological aspects ka combination trading strategies aur decisions ko enhance karne ke liye useful hota hai. Traders ko chahiye ke woh market ke psychological factors ko consider karen aur apne trading decisions ko accordingly adjust karen. Yeh approach trading success aur profitability ko enhance karne mein madad karta hai.

          13. Pivot Point Aur Long-Term Trading

          Pivot point ka use long-term trading strategies mein bhi kiya jata hai. Long-term traders pivot point ko market ke major trends aur key levels ko analyze karne ke liye use karte hain. Yeh analysis long-term trading decisions aur strategies ko enhance karne mein madad karta hai.

          Long-term traders pivot point ko daily, weekly, aur monthly basis par analyze karte hain. Pivot point ke saath long-term trends aur key levels ko study karke traders market ke major direction aur price movements ko understand karte hain. Yeh analysis long-term trading strategies ko develop karne ke liye useful hoti hai.

          Pivot point ka use long-term trading decisions ko manage karne aur market ke major trends ko analyze karne mein madad karta hai. Traders ko chahiye ke woh pivot point ke saath long-term analysis tools aur techniques ko bhi use karen. Yeh approach trading strategies aur decisions ko enhance karne ke liye useful hota hai.

          Long-term trading mein pivot point ka effective use market ke major trends aur key levels ko identify karne mein madad karta hai. Traders ko chahiye ke woh long-term trends aur pivot point ke analysis ko combine karen taake accurate aur reliable trading decisions le saken. Yeh approach long-term trading success aur profitability ko enhance karne ke liye useful hoti hai.

          Pivot point aur long-term trading ka combination market ke major trends aur price movements ko analyze karne mein madad karta hai. Traders ko chahiye ke woh pivot point ke saath long-term trading strategies aur tools ko bhi use karen. Yeh approach trading decisions ko better manage karne aur market ke behavior ko accurately understand karne mein madad karta hai.

          14. Pivot Point Ka Use Automated Trading Systems Mein

          Automated trading systems mein pivot point ka use trading strategies aur decisions ko enhance karne ke liye kiya jata hai. Pivot point ka integration automated trading systems mein market ke key levels aur trends ko accurately analyze karne mein madad karta hai. Automated trading systems pivot point ke analysis ko trading decisions aur execution mein incorporate karte hain.

          Automated trading systems pivot point ke saath additional technical indicators aur tools ko bhi integrate karte hain. Yeh combination trading strategies ko enhance karne aur market ke fluctuations ko manage karne mein madad karta hai. Automated systems pivot point ke analysis ko real-time trading decisions mein incorporate karte hain.

          Pivot point ka use automated trading systems mein market ke short-term aur long-term trends ko analyze karne ke liye kiya jata hai. Traders automated systems ke zariye pivot point ke key levels aur price movements ko accurately monitor kar sakte hain. Yeh approach trading decisions aur execution ko enhance karne ke liye useful hoti hai.

          Automated trading systems pivot point ke analysis ko trading strategies ke saath combine karte hain. Yeh combination market ke behavior aur price movements ko better understand karne aur trading decisions ko effectively manage karne mein madad karta hai. Automated systems pivot point ka use trading success aur profitability ko enhance karne ke liye kiya jata hai.

          Pivot point ka integration automated trading systems mein market ke analysis aur execution ko streamline karne mein madad karta hai. Traders ko chahiye ke woh automated systems ke saath pivot point aur other technical indicators ko bhi use karen. Yeh approach trading decisions aur strategies ko accurate aur reliable banane mein madad karta hai.

          15. Pivot Point Aur Multi-Timeframe Analysis

          Pivot point ka use multi-timeframe analysis mein bhi kiya jata hai. Multi-timeframe analysis market ke different timeframes par pivot point ke key levels aur trends ko analyze karne mein madad karta hai. Yeh approach market ke overall behavior aur price movements ko comprehensively understand karne ke liye useful hota hai.

          Multi-timeframe analysis se traders market ke different timeframes par pivot point ke support aur resistance levels ko analyze kar sakte hain. Yeh analysis short-term aur long-term trends ko identify karne mein madad karta hai. Pivot point ke saath multi-timeframe analysis market ke overall direction aur trends ko accurately predict karne mein useful hota hai.

          Traders multi-timeframe analysis ke zariye market ke key levels aur trends ko better understand kar sakte hain. Pivot point ke saath different timeframes par analysis karke traders ko market ke behavior aur fluctuations ka comprehensive view milta hai. Yeh approach trading strategies aur decisions ko enhance karne ke liye useful hoti hai.

          Pivot point aur multi-timeframe analysis ka combination market ke behavior aur price movements ko accurately understand karne mein madad karta hai. Traders ko chahiye ke woh multi-timeframe analysis ke saath pivot point ke key levels aur trends ko bhi consider karen. Yeh approach trading decisions ko better manage karne aur market ke overall behavior ko comprehend karne mein madad karti hai.

          Multi-timeframe analysis se traders ko market ke different perspectives aur trends ko identify karne mein madad milti hai. Pivot point ka use multi-timeframe analysis mein market ke overall direction aur key levels ko understand karne ke liye kiya jata hai. Yeh approach trading strategies aur decisions ko enhance karne ke liye useful hoti hai.

          • #6 Collapse


            Pivot Point Kya Hai Forex Mein?


            1. Pivot Point Ka Taaruf

            Forex trading mein pivot point ek ahem technical indicator hai jo price movement aur market trends ko analyze karne mein madad deta hai. Yeh indicator trading strategies mein frequently use hota hai kyunki yeh traders ko potential support aur resistance levels ko identify karne mein madad karta hai. Pivot point ki concept trading ke traditional methods se nikal kar modern trading strategies mein integrate ki gayi hai, jo traders ko zyada informed decisions lene mein madad karti hai.

            Pivot point ko calculate karne ka main purpose market ke equilibrium point ko find karna hai. Jab market pivot point ke aas paas hota hai, toh yeh indicate karta hai ke market balance mein hai aur future direction uncertain ho sakti hai. Pivot point ki calculation market ke previous highs, lows, aur closing prices ko consider karti hai, jo ki trading decisions ko impact karte hain. Traders pivot point ke around ke levels ko watch karte hain, jo unhein potential entry aur exit points provide karte hain.

            Yeh indicator market ki sentiment ko bhi gauge karne mein madad karta hai. Jab price pivot point se upar move karti hai, toh yeh bullish sentiment ko show karti hai, aur jab niche move karti hai, toh bearish sentiment ko indicate karti hai. Pivot point ki understanding aur implementation se traders market ki behavior ko better predict kar sakte hain aur effective trading strategies develop kar sakte hain.

            Pivot point ka concept Forex trading ke ilawa bhi different markets, jaise stocks aur commodities, mein use hota hai. Yeh indicator market trends ko samajhne ke liye ek standard tool hai jo traders ko market ki potential direction aur price levels ko assess karne mein help karta hai. Pivot point ke alawa bhi market analysis ke liye kai aur tools available hain, magar pivot point ka simplicity aur effectiveness isse ek valuable tool banata hai.

            Pivot point ka use trading strategies mein integrate karne se pehle, traders ko iska basic understanding hona chahiye. Iske calculation methods, support aur resistance levels, aur market trends ke impact ko samajhna zaroori hai taake pivot point ko effectively use kiya ja sake. Yeh ek tool hai jo market ke behavior ko analyze karne mein madad karta hai, lekin traders ko apne research aur analysis ke saath saath decision making karni chahiye.

            2. Pivot Point Ki Calculation

            Pivot point ki calculation Forex trading mein ek fundamental aspect hai jo traders ko market trends aur price levels ko assess karne mein madad deti hai. Pivot point ko calculate karne ka basic formula hai: Pivot Point=High+Low+Close3\text{Pivot Point} = \frac{\text{High} + \text{Low} + \text{Close}}{3}Pivot Point=3High+Low+Close​ Jahan High, Low aur Close previous trading period ke price points hain. Yeh formula market ke previous period ke highest, lowest aur closing prices ko average karke ek central point provide karta hai jo market ke potential direction ko indicate karta hai.

            Calculation ka process simple hai lekin iska impact significant hota hai. Pivot point ke calculation ke liye accurate high, low, aur close prices ka hona zaroori hai. Yeh prices usually daily trading period ke liye use kiye jate hain, lekin traders weekly ya monthly trading periods ke liye bhi pivot points calculate kar sakte hain. Yeh calculation market ki trends aur price movements ko understand karne mein help karta hai.

            Pivot point ki calculation ke baad, traders support aur resistance levels ko bhi calculate karte hain. Support aur resistance levels pivot point ke around ke price points hote hain jo market ke potential reversal points ko indicate karte hain. Support aur resistance levels ke calculation ke liye additional formulas use kiye jate hain, jo traders ko market ke key levels ko identify karne mein madad karte hain.

            Pivot point ki calculation ke liye accurate data ka hona essential hai. Agar high, low aur close prices galat hain, toh pivot point aur support-resistance levels bhi inaccurate honge. Isliye, traders ko reliable sources se data collect karna chahiye aur calculation ko carefully perform karna chahiye. Accurate pivot points aur levels market ke analysis aur trading decisions ke liye crucial hote hain.

            Pivot point ki calculation ka process aur methods traders ko market ke behavior ko samajhne mein madad karte hain. Yeh indicator market ke potential direction aur price levels ko predict karne mein assist karta hai, jo trading strategies ko develop karne mein helpful hota hai. Pivot point ke calculation ke through, traders market ke trends aur fluctuations ko better analyze kar sakte hain.

            3. Support Aur Resistance Levels

            Support aur resistance levels pivot point ke around ke important levels hain jo market ke potential reversal points ko indicate karte hain. Support level wo point hota hai jahan price niche jane ki koshish karti hai, lekin wahan se wapas uthti hai. Resistance level wo point hota hai jahan price upar jane ki koshish karti hai, lekin wahan se niche aati hai. Yeh levels market ke trends aur price movements ko analyze karne mein madad karte hain.

            Support aur resistance levels ki calculation pivot point ke basis par ki jati hai. Support levels ko calculate karne ke liye formulas hain: Support Level 1=2×Pivot Point−High\text{Support Level 1} = 2 \times \text{Pivot Point} - \text{High}Support Level 1=2×Pivot Point−High Support Level 2=Pivot Point−(High−Low)\text{Support Level 2} = \text{Pivot Point} - (\text{High} - \text{Low})Support Level 2=Pivot Point−(High−Low) Yeh formulas market ke potential support levels ko identify karte hain jo price ke neeche jane ki soorat mein act karte hain. Support levels price ke neeche move karne se rokne mein madadgar hote hain aur traders ko entry points identify karne mein assist karte hain.

            Resistance levels ko calculate karne ke liye formulas hain: Resistance Level 1=2×Pivot Point−Low\text{Resistance Level 1} = 2 \times \text{Pivot Point} - \text{Low}Resistance Level 1=2×Pivot Point−Low Resistance Level 2=Pivot Point+(High−Low)\text{Resistance Level 2} = \text{Pivot Point} + (\text{High} - \text{Low})Resistance Level 2=Pivot Point+(High−Low) Yeh formulas market ke potential resistance levels ko identify karte hain jo price ke upar jane ki soorat mein act karte hain. Resistance levels price ke upar move karne se rokne mein madadgar hote hain aur traders ko exit points identify karne mein assist karte hain.

            Support aur resistance levels ka analysis market ke trends aur price movements ko samajhne mein madad karta hai. Jab price support level ke paas hoti hai, toh yeh indicate karta hai ke market ko support mil raha hai aur price wahan se upar move kar sakti hai. Jab price resistance level ke paas hoti hai, toh yeh indicate karta hai ke market resistance face kar raha hai aur price wahan se niche aa sakti hai.

            Support aur resistance levels ko monitor karne se traders ko market ke potential reversal points aur price fluctuations ko samajhne mein madad milti hai. Yeh levels trading strategies aur decisions ke liye important hota hai. Traders ko chahiye ke woh support aur resistance levels ke sath pivot points ko bhi consider karen taake accurate trading decisions le saken.

            4. Pivot Point Ka Use Kaise Karein

            Pivot point ka use Forex trading mein market trends aur price levels ko analyze karne ke liye kiya jata hai. Jab price pivot point ke upar hoti hai, toh yeh bullish sentiment ko indicate karta hai aur jab niche hoti hai, toh bearish sentiment ko indicate karta hai. Pivot point ka use trading decisions ke liye ek valuable tool hai jo traders ko market ke potential direction aur key levels ko identify karne mein madad karta hai.

            Traders pivot point ke aas paas ke support aur resistance levels ko monitor karte hain. Jab price support level ke paas hoti hai aur wahan se upar move karti hai, toh yeh indicate karta hai ke market bullish ho sakta hai. Jab price resistance level ke paas hoti hai aur wahan se niche move karti hai, toh yeh indicate karta hai ke market bearish ho sakta hai. Pivot point ke saath support aur resistance levels ko consider karne se traders ko entry aur exit points identify karne mein madad milti hai.

            Pivot point ka use intraday trading mein bhi kiya jata hai. Intraday traders daily market trends aur fluctuations ko analyze karte hain aur pivot point ke levels ko monitor karte hain taake accurate trading decisions le saken. Pivot point ke aas paas ke price movements aur support-resistance levels intraday trading strategies mein help karte hain.

            Pivot point ka use long-term trading strategies mein bhi kiya jata hai. Long-term traders weekly ya monthly pivot points ko calculate karte hain aur unhe market ke overall trends aur price levels ko understand karne ke liye use karte hain. Pivot point ke saath saath long-term traders other technical indicators aur analysis tools bhi use karte hain taake comprehensive market analysis kiya ja sake.

            Pivot point ka effective use trading decisions ko enhance karne mein madad karta hai. Traders ko chahiye ke woh pivot point ke saath market analysis ke other tools aur techniques bhi use karen taake accurate aur informed trading decisions le saken. Pivot point ka use trading strategies ko refine karne aur market ke behavior ko better understand karne ke liye kiya jata hai.

            5. Intraday Trading Mein Pivot Point

            Intraday trading mein pivot point ka use daily market trends aur price movements ko analyze karne ke liye kiya jata hai. Intraday traders pivot point ke levels ko monitor karte hain taake short-term trading opportunities ko identify kar saken. Pivot point ka use intraday trading mein market ke potential reversal points aur key levels ko understand karne mein help karta hai.

            Intraday traders daily trading periods ke liye pivot point calculate karte hain. Yeh calculation daily high, low, aur close prices ke basis par ki jati hai. Pivot point ke aas paas ke support aur resistance levels intraday trading decisions ko influence karte hain. Jab price pivot point ke aas paas hoti hai, toh traders market ke short-term trends ko monitor karte hain aur potential trading opportunities ko identify karte hain.

            Intraday trading mein pivot point ka use market ke volatility aur fluctuations ko manage karne mein bhi madad karta hai. Pivot point ke aas paas ke price movements aur support-resistance levels market ke short-term trends aur volatility ko indicate karte hain. Traders pivot point aur other technical indicators ko combine karke accurate trading signals aur strategies develop karte hain.

            Intraday traders pivot point ke saath additional tools aur indicators bhi use karte hain, jaise moving averages aur oscillators. Yeh tools market ke short-term trends aur price movements ko analyze karne mein madad karte hain. Pivot point ke sath combined use se traders ko zyada accurate aur reliable trading signals milte hain.

            Intraday trading mein pivot point ka effective use market ke short-term trends aur fluctuations ko samajhne mein madad karta hai. Traders ko chahiye ke woh pivot point ke sath saath market analysis ke other tools aur techniques ko bhi use karen taake trading decisions zyada informed aur accurate ho saken.

            6. Pivot Point Aur Market Trends

            Pivot point market trends ko identify karne mein ek useful tool hai. Jab market pivot point ke upar trade kar raha hota hai, toh yeh indicate karta hai ke market bullish trend mein hai. Agar market pivot point ke niche trade kar raha hota hai, toh yeh bearish trend ko indicate karta hai. Pivot point ka use market ke overall trends aur price movements ko analyze karne ke liye kiya jata hai.

            Market trends ke analysis ke liye pivot point ke aas paas ke support aur resistance levels ko monitor kiya jata hai. Jab price pivot point ke aas paas hoti hai, toh yeh market ke equilibrium aur potential direction ko indicate karta hai. Market ke upar ya niche move karne se traders ko market ke bullish ya bearish trends ka idea milta hai.

            Pivot point market trends ko short-term aur long-term perspectives se analyze karne mein madad karta hai. Short-term traders daily pivot points ko consider karte hain, jabke long-term traders weekly ya monthly pivot points ko analyze karte hain. Pivot point ke saath saath other technical indicators aur tools bhi use kiye jate hain taake market trends ko comprehensively understand kiya ja sake.

            Pivot point ke analysis se traders ko market ke potential reversal points aur key levels ko identify karne mein madad milti hai. Market trends ko samajhne se traders ko accurate trading decisions aur strategies develop karne mein help milti hai. Pivot point ke saath saath traders ko market ke overall sentiment aur behavior ko bhi consider karna chahiye.

            Pivot point ka effective use market trends aur price movements ko analyze karne mein madad karta hai. Traders ko chahiye ke woh pivot point ke saath market analysis ke other tools aur techniques ko bhi use karen taake trading decisions zyada accurate aur reliable ho saken. Market trends ko analyze karne se traders ko better trading strategies aur opportunities milti hain.

            7. Pivot Point Aur Volatility

            Pivot point market ki volatility ko measure karne mein bhi madad karta hai. Jab price pivot point ke aas paas se kafi zyada move karti hai, toh yeh indicate karta hai ke market mein zyada volatility hai. Low volatility ka matlab hota hai ke price pivot point ke aas paas stable hai. Pivot point ki volatility analysis trading decisions aur strategies ko influence karti hai.

            Market ki volatility ko understand karne ke liye pivot point ke saath support aur resistance levels ko bhi consider kiya jata hai. Agar price pivot point se kafi zyada move karti hai, toh yeh signal hota hai ke market mein strong trends aur fluctuations hain. High volatility ke periods mein traders ko careful aur calculated trading decisions lene chahiye.

            Volatility ke analysis se traders ko market ke trends aur price movements ka better understanding milta hai. Pivot point ke saath volatility analysis market ke potential direction aur price levels ko predict karne mein madad karta hai. Traders ko chahiye ke woh market ki volatility aur fluctuations ko monitor karen taake accurate trading signals aur strategies develop kar saken.

            Pivot point aur volatility ke analysis se traders ko market ke risk aur opportunities ko assess karne mein madad milti hai. High volatility periods mein trading strategies ko adjust karna zaroori hota hai. Traders ko chahiye ke woh market ke volatility aur trends ko consider karen taake effective aur profitable trading decisions le saken.

            Pivot point aur volatility ka combination traders ko market ke behavior aur fluctuations ko samajhne mein madad karta hai. Yeh analysis trading strategies aur decisions ko enhance karne ke liye useful hota hai. Traders ko chahiye ke woh pivot point ke saath market analysis ke other tools aur techniques ko bhi use karen taake trading decisions zyada informed aur accurate ho saken.

            8. Different Types of Pivot Points

            Forex trading mein mukhtalif types ke pivot points use kiye jate hain, jaise ki Fibonacci pivot points, Woodie pivot points aur Camarilla pivot points. Har type ki pivot point ki calculation aur use ka tareeqa thoda different hota hai. Different types ke pivot points traders ko market ke different perspectives aur trends ko analyze karne mein madad karte hain.

            Fibonacci Pivot Points: Yeh pivot points Fibonacci retracement levels ke basis par calculate kiye jate hain. Fibonacci levels market ke potential support aur resistance levels ko identify karne mein madad karte hain. Fibonacci pivot points traders ko market ke key levels aur price movements ko understand karne mein assist karte hain.

            Woodie Pivot Points: Woodie pivot points ki calculation traditional pivot points se thodi different hoti hai. Yeh pivot points market ke previous high, low, aur close prices ke basis par calculate kiye jate hain, lekin yeh calculate karne ka method different hota hai. Woodie pivot points traders ko market ke potential support aur resistance levels ko identify karne mein madad karte hain.

            Camarilla Pivot Points: Camarilla pivot points ki calculation bhi unique hoti hai aur yeh market ke high, low, aur close prices ke basis par calculate kiye jate hain. Camarilla pivot points traders ko market ke short-term support aur resistance levels ko identify karne mein madad karte hain. Yeh pivot points market ke volatility aur price movements ko analyze karne mein help karte hain.

            Har type ke pivot points ki calculation aur use ka method different hota hai, lekin inka purpose market ke key levels aur trends ko analyze karna hota hai. Traders ko chahiye ke woh different types ke pivot points ko understand karen aur unka use market analysis aur trading decisions ke liye karein.

            Pivot points ka use trading strategies aur decisions ko enhance karne mein madad karta hai. Traders ko different types ke pivot points ke benefits aur limitations ko samajhna chahiye taake woh market ke behavior ko better analyze kar saken. Different types ke pivot points ka use market ke trends aur price movements ko comprehensive way mein analyze karne ke liye kiya jata hai.

            9. Pivot Point Ki Limitations

            Pivot point ek predictive tool hai aur har situation mein accurate nahi hota. Yeh market ke trends aur price movements ko predict karne mein madad karta hai, lekin market conditions ke mutabiq changes aa sakte hain. Pivot point ke limitations ko samajhna traders ke liye zaroori hai taake woh apne trading decisions ko better manage kar saken.

            Pivot point ki limitations mein ek major limitation yeh hai ke yeh ek lagging indicator hai. Lagging indicators market ke past data ke basis par analysis karte hain aur current market conditions ko accurately reflect nahi karte. Isliye, pivot point ke sath saath other technical indicators aur tools bhi use karne chahiye taake accurate trading signals mil saken.

            Another limitation yeh hai ke pivot point market ke volatility aur fluctuations ko accurately measure nahi kar sakta. High volatility periods mein pivot point ki accuracy kam ho sakti hai aur market ke trends aur price movements ko predict karna mushkil ho sakta hai. Traders ko pivot point ke sath market ki volatility aur fluctuations ko bhi consider karna chahiye.

            Pivot point ke limitations ko manage karne ke liye traders ko additional research aur analysis tools use karne chahiye. Technical indicators aur market analysis tools pivot point ke saath combine karke trading decisions ko enhance kiya ja sakta hai. Yeh combination traders ko market ke behavior ko better understand karne aur accurate trading decisions lene mein madad karta hai.

            Pivot point ki limitations ko samajhna aur manage karna traders ke liye important hai taake woh effective aur reliable trading strategies develop kar saken. Pivot point ek valuable tool hai, lekin iska effective use market analysis ke other tools aur techniques ke saath kiya jana chahiye. Traders ko chahiye ke woh pivot point ke limitations ko understand karen aur apne trading decisions ko accordingly adjust karen.

            10. Pivot Point Ka Historical Analysis

            Pivot point ka historical analysis trading decisions ke liye useful hota hai. Historical analysis market ke previous pivot points aur price movements ko study karke market ke trends aur patterns ko understand karne mein madad karta hai. Traders historical data ko analyze karke market ke potential direction aur price levels ko predict kar sakte hain.

            Historical analysis se traders ko market ke past trends aur price movements ka idea milta hai. Previous trading periods ke pivot points aur support-resistance levels ko analyze karne se market ke behavior aur fluctuations ko samajhne mein madad milti hai. Yeh analysis trading strategies aur decisions ko enhance karne ke liye useful hota hai.

            Pivot point ke historical analysis ke liye traders ko historical price data aur pivot points ko study karna chahiye. Yeh analysis market ke past behavior aur trends ko samajhne mein madad karta hai aur future trading decisions ko influence karta hai. Traders ko chahiye ke woh historical analysis ke results ko market ke current conditions ke sath combine karen.

            Historical analysis se traders ko market ke potential reversal points aur key levels ka idea milta hai. Pivot point ke historical data ko study karke traders market ke key levels aur trends ko better understand kar sakte hain. Yeh analysis trading strategies aur decisions ko accurate aur reliable banane mein madad karta hai.

            Pivot point ka historical analysis trading decisions aur strategies ko enhance karne ke liye important hai. Traders ko chahiye ke woh historical data ko analyze karen aur uske results ko market analysis ke saath combine karen. Yeh approach trading decisions ko better manage karne aur market ke behavior ko accurately understand karne mein madad karta hai.

            11. Pivot Point Aur Risk Management

            Pivot point trading decisions ke liye ek useful tool hai, lekin risk management bhi trading success ke liye zaroori hai. Risk management strategies pivot point ke analysis ko complement karti hain aur traders ko potential losses aur risks ko minimize karne mein madad karti hain. Effective risk management trading decisions ko enhance karne aur market ke volatility ko handle karne mein madad karta hai.

            Risk management strategies pivot point ke saath combine karke trading decisions ko secure aur reliable banane mein madad karti hain. Traders ko chahiye ke woh stop-loss aur take-profit levels ko pivot point ke analysis ke sath set karen. Yeh levels market ke volatility aur price movements ko manage karne mein madad karte hain.

            Pivot point ke sath risk management strategies use karke traders ko market ke potential risks aur rewards ko assess karne mein madad milti hai. Effective risk management trading strategies ko enhance karne aur market ke fluctuations ko manage karne ke liye useful hoti hai. Traders ko chahiye ke woh risk management techniques ko apni trading strategies mein incorporate karen.

            Pivot point aur risk management ka combination traders ko trading decisions ko effectively manage karne mein madad karta hai. Traders ko market ke behavior aur volatility ko monitor karna chahiye aur risk management strategies ko adjust karna chahiye. Yeh approach trading success aur profitability ko enhance karne ke liye useful hota hai.

            Risk management ke saath pivot point ka use trading decisions ko accurate aur reliable banane mein madad karta hai. Traders ko chahiye ke woh risk management techniques ko apne trading strategies ke sath combine karen taake market ke potential risks aur rewards ko better manage kar saken. Pivot point aur risk management ka combination effective trading strategies aur decisions ko develop karne mein madad karta hai.

            12. Pivot Point Ka Psychological Aspect

            Pivot point ka psychological aspect trading decisions aur market behavior ko influence karne mein madad karta hai. Market participants pivot point ke key levels ko psychological benchmarks ke roop mein dekhte hain. Yeh psychological factors market ke trends aur price movements ko affect karte hain.

            Market participants pivot point ke key levels ko support aur resistance levels ke roop mein consider karte hain. Jab price pivot point ke aas paas hoti hai, toh yeh psychological benchmarks ke roop mein kaam karti hai aur traders ke behavior ko influence karti hai. Traders market ke psychological aspects ko consider karke trading decisions lete hain.

            Pivot point ka psychological aspect market ke sentiment aur behavior ko analyze karne mein madad karta hai. Traders ko chahiye ke woh market ke psychological factors ko consider karen aur apne trading strategies ko accordingly adjust karen. Yeh approach market ke behavior aur price movements ko accurately understand karne ke liye useful hota hai.

            Psychological aspects ka analysis trading decisions aur strategies ko enhance karne ke liye important hai. Traders ko pivot point ke psychological aspects ko market analysis ke saath combine karna chahiye. Yeh combination trading decisions ko better manage karne aur market ke behavior ko accurately understand karne mein madad karta hai.

            Pivot point aur psychological aspects ka combination trading strategies aur decisions ko enhance karne ke liye useful hota hai. Traders ko chahiye ke woh market ke psychological factors ko consider karen aur apne trading decisions ko accordingly adjust karen. Yeh approach trading success aur profitability ko enhance karne mein madad karta hai.

            13. Pivot Point Aur Long-Term Trading

            Pivot point ka use long-term trading strategies mein bhi kiya jata hai. Long-term traders pivot point ko market ke major trends aur key levels ko analyze karne ke liye use karte hain. Yeh analysis long-term trading decisions aur strategies ko enhance karne mein madad karta hai.

            Long-term traders pivot point ko daily, weekly, aur monthly basis par analyze karte hain. Pivot point ke saath long-term trends aur key levels ko study karke traders market ke major direction aur price movements ko understand karte hain. Yeh analysis long-term trading strategies ko develop karne ke liye useful hoti hai.

            Pivot point ka use long-term trading decisions ko manage karne aur market ke major trends ko analyze karne mein madad karta hai. Traders ko chahiye ke woh pivot point ke saath long-term analysis tools aur techniques ko bhi use karen. Yeh approach trading strategies aur decisions ko enhance karne ke liye useful hota hai.

            Long-term trading mein pivot point ka effective use market ke major trends aur key levels ko identify karne mein madad karta hai. Traders ko chahiye ke woh long-term trends aur pivot point ke analysis ko combine karen taake accurate aur reliable trading decisions le saken. Yeh approach long-term trading success aur profitability ko enhance karne ke liye useful hoti hai.

            Pivot point aur long-term trading ka combination market ke major trends aur price movements ko analyze karne mein madad karta hai. Traders ko chahiye ke woh pivot point ke saath long-term trading strategies aur tools ko bhi use karen. Yeh approach trading decisions ko better manage karne aur market ke behavior ko accurately understand karne mein madad karta hai.

            14. Pivot Point Ka Use Automated Trading Systems Mein

            Automated trading systems mein pivot point ka use trading strategies aur decisions ko enhance karne ke liye kiya jata hai. Pivot point ka integration automated trading systems mein market ke key levels aur trends ko accurately analyze karne mein madad karta hai. Automated trading systems pivot point ke analysis ko trading decisions aur execution mein incorporate karte hain.

            Automated trading systems pivot point ke saath additional technical indicators aur tools ko bhi integrate karte hain. Yeh combination trading strategies ko enhance karne aur market ke fluctuations ko manage karne mein madad karta hai. Automated systems pivot point ke analysis ko real-time trading decisions mein incorporate karte hain.

            Pivot point ka use automated trading systems mein market ke short-term aur long-term trends ko analyze karne ke liye kiya jata hai. Traders automated systems ke zariye pivot point ke key levels aur price movements ko accurately monitor kar sakte hain. Yeh approach trading decisions aur execution ko enhance karne ke liye useful hoti hai.

            Automated trading systems pivot point ke analysis ko trading strategies ke saath combine karte hain. Yeh combination market ke behavior aur price movements ko better understand karne aur trading decisions ko effectively manage karne mein madad karta hai. Automated systems pivot point ka use trading success aur profitability ko enhance karne ke liye kiya jata hai.

            Pivot point ka integration automated trading systems mein market ke analysis aur execution ko streamline karne mein madad karta hai. Traders ko chahiye ke woh automated systems ke saath pivot point aur other technical indicators ko bhi use karen. Yeh approach trading decisions aur strategies ko accurate aur reliable banane mein madad karta hai.

            15. Pivot Point Aur Multi-Timeframe Analysis

            Pivot point ka use multi-timeframe analysis mein bhi kiya jata hai. Multi-timeframe analysis market ke different timeframes par pivot point ke key levels aur trends ko analyze karne mein madad karta hai. Yeh approach market ke overall behavior aur price movements ko comprehensively understand karne ke liye useful hota hai.

            Multi-timeframe analysis se traders market ke different timeframes par pivot point ke support aur resistance levels ko analyze kar sakte hain. Yeh analysis short-term aur long-term trends ko identify karne mein madad karta hai. Pivot point ke saath multi-timeframe analysis market ke overall direction aur trends ko accurately predict karne mein useful hota hai.

            Traders multi-timeframe analysis ke zariye market ke key levels aur trends ko better understand kar sakte hain. Pivot point ke saath different timeframes par analysis karke traders ko market ke behavior aur fluctuations ka comprehensive view milta hai. Yeh approach trading strategies aur decisions ko enhance karne ke liye useful hoti hai.

            Pivot point aur multi-timeframe analysis ka combination market ke behavior aur price movements ko accurately understand karne mein madad karta hai. Traders ko chahiye ke woh multi-timeframe analysis ke saath pivot point ke key levels aur trends ko bhi consider karen. Yeh approach trading decisions ko better manage karne aur market ke overall behavior ko comprehend karne mein madad karti hai.

            Multi-timeframe analysis se traders ko market ke different perspectives aur trends ko identify karne mein madad milti hai. Pivot point ka use multi-timeframe analysis mein market ke overall direction aur key levels ko understand karne ke liye kiya jata hai. Yeh approach trading strategies aur decisions ko enhance karne ke liye useful hoti hai.
            • #7 Collapse

              Pivot Point Kya Hai Forex Mein?


              Forex trading mein pivot point ek ahem technical analysis tool hai jo market ke important levels ko determine karne ke liye use hota hai. Yeh concept traders ko market ki potential reversals aur support-resistance levels ko identify karne mein madad deta hai. Pivot points ko samajhna forex trading mein aapki strategy ko behtar bana sakta hai aur aapko market ke trends ko accurately predict karne mein help kar sakta hai. Is article mein hum pivot point ke detailed concept, types, aur forex trading mein iske role par gehra jaiza leinge.
              Pivot Point Ka Taaruf


              Pivot point ek mathematical calculation hai jo market ke average price level ko determine karta hai. Yeh level traders ko ek central point provide karta hai jisse woh market ki direction aur trend ko gauge kar sakte hain. Pivot point ka calculation usually previous trading session ke high, low, aur close prices ko dekh kar kiya jata hai. Yeh ek key level hota hai jahan se market reverse ho sakti hai ya continue kar sakti hai. Pivot points ko understanding karna zaroori hai kyun ke yeh market ke critical turning points ko identify karte hain.

              Pivot point ka basic concept yeh hai ke market ke price movements ko track karne ke liye ek reliable reference point provide kiya jaye. Yeh point market ke high aur low prices ko dekh kar calculate kiya jata hai, isse traders ko ek idea milta hai ke market kis direction mein move kar sakti hai. Pivot points ko different time frames par calculate kiya ja sakta hai, jisse traders ko short-term aur long-term trends ko samajhne mein madad milti hai. Is tarah, pivot points forex trading mein ek key role play karte hain aur traders ko market ki dynamics ko samajhne mein help karte hain.
              Pivot Point Kaise Calculate Kiya Jata Hai?


              Pivot point ko calculate karne ke liye aapko previous trading day ke high, low, aur close prices ki zaroorat hoti hai. Calculation formula simple hai: Pivot Point (PP) = (High + Low + Close) / 3. Is formula ke zariye aap ek central point determine kar sakte hain jo market ke potential support aur resistance levels ko define karta hai. Yeh calculation traders ko ek clear indication provide karta hai ke market kis level par support ya resistance de sakti hai.

              Agar aapko accurate pivot point calculate karna hai, to aapko previous day ka high, low, aur close price sahi se note karna hoga. Phir in prices ko formula mein substitute karke pivot point nikalna hoga. Example ke taur par, agar previous day ka high price 1.3500, low price 1.3400, aur close price 1.3450 hai, to pivot point calculate karna kuch is tarah hoga: (1.3500 + 1.3400 + 1.3450) / 3 = 1.3450. Yeh pivot point aapko market ke potential turning point ke baare mein indication deta hai.
              Pivot Point Ke Types


              Pivot points ke different types hain jo trading strategies aur market conditions ke hisaab se use kiye ja sakte hain. In types ko samajhna traders ko market analysis mein madad deta hai aur unki trading strategies ko enhance karta hai.
              1. Standard Pivot Point: Yeh sabse basic pivot point hai jo high, low, aur close prices ko average kar ke calculate kiya jata hai. Yeh level trading decisions ke liye ek basic reference point provide karta hai aur market ke general trend ko samajhne mein madad karta hai.
              2. Fibonacci Pivot Point: Is pivot point ko Fibonacci retracement levels ke saath integrate kiya jata hai. Fibonacci levels market ke natural retracement levels ko indicate karte hain, aur isse traders ko market ke potential reversal points ko identify karne mein madad milti hai. Fibonacci pivot points usually market ke deeper analysis ke liye use kiye jate hain.
              3. Woodie’s Pivot Point: Yeh pivot point ko traditional calculation method se thoda different tareeqe se calculate kiya jata hai. Woodie’s pivot point mein previous day ke close price ko zyada weightage di jati hai, jo market ke trend aur sentiment ko reflect karta hai. Yeh method usually intraday trading mein use kiya jata hai.
              4. Camarilla Pivot Point: Yeh ek advanced pivot point calculation method hai jo market ke additional levels ko provide karta hai. Camarilla pivot points market ke volatility aur price movements ko accurately capture karte hain aur traders ko detailed analysis ke liye use kiye jate hain. Is method ka use high-frequency trading aur advanced strategies ke liye hota hai.
              Forex Trading Mein Pivot Point Ki Ahmiyat


              Forex trading mein pivot points ki ahmiyat is baat mein hai ke yeh market ke key levels ko identify karne mein madad karte hain. Traders pivot points ko support aur resistance levels ke tor par use karte hain aur yeh levels unke trading decisions ko guide karte hain.

              Agar market pivot point ke upar trade kar rahi hoti hai, to yeh bullish signal hota hai aur traders ko buy positions lene ka indication hota hai. Agar market pivot point ke niche trade kar rahi hoti hai, to yeh bearish signal hota hai aur traders ko sell positions lene ka indication hota hai. Is tarah pivot points market ke potential reversal points ko identify karne mein madadgar hote hain aur traders ko strategic decisions lene mein help karte hain.

              Pivot points ki madad se traders market ke important levels ko gauge kar sakte hain aur trading plans ko accordingly adjust kar sakte hain. Yeh levels market ki volatility aur price movements ko samajhne mein madad karte hain aur traders ko risk management aur profit-taking strategies adopt karne mein help karte hain.
              Support Aur Resistance Levels


              Pivot points market ke support aur resistance levels ko define karte hain, jo trading decisions ke liye crucial hote hain. Support level wo point hota hai jahan se market ki price niche ki taraf jaane ki bajaye reverse ho sakti hai, jabke resistance level wo point hota hai jahan se price upar ki taraf jaane ki bajaye reverse ho sakti hai.

              Agar market pivot point se upar trade kar rahi hoti hai, to yeh bullish trend ko indicate karta hai aur traders ko buy positions lene ka suggestion deta hai. Aur agar market pivot point se niche trade kar rahi hoti hai, to yeh bearish trend ko indicate karta hai aur traders ko sell positions lene ka suggestion deta hai. Yeh levels market ke key turning points ko identify karte hain aur traders ko market ki movement ke hisaab se trading decisions lene mein madad karte hain.

              Pivot points ke alawa bhi market ke support aur resistance levels ko identify karne ke liye aur tools aur techniques available hain. Lekin pivot points ki simplicity aur effectiveness ke wajah se yeh traders ke liye ek reliable tool hain. In levels ko use karke traders market ki trends ko accurately gauge kar sakte hain aur apni trading strategies ko accordingly adjust kar sakte hain.
              Pivot Point Aur Market Sentiment


              Pivot points market sentiment ko gauge karne mein bhi madadgar hote hain. Market sentiment traders ke overall mood aur market ke direction ke baare mein hota hai. Agar market pivot point ke upar trade kar rahi hoti hai, to yeh bullish sentiment ko indicate karta hai, jabke pivot point ke niche trade karna bearish sentiment ko indicate karta hai.

              Pivot points traders ko market ke overall sentiment ko samajhne mein madad karte hain aur unke trading decisions ko guide karte hain. Yeh levels market ke turning points aur potential reversals ko identify karte hain, jo market sentiment ko reflect karte hain. Traders pivot points ke zariye market ke mood ko gauge kar sakte hain aur apni trading strategies ko accordingly adjust kar sakte hain.

              Market sentiment ko samajhne ke liye pivot points ke saath saath other technical analysis tools aur indicators ka bhi use kiya jata hai. Yeh tools traders ko market ke overall mood aur direction ko accurately gauge karne mein help karte hain. Pivot points ke zariye traders market ke sentiment ko samajh kar apne trading decisions ko behtar bana sakte hain aur profitable trading opportunities identify kar sakte hain.
              Intraday Trading Aur Pivot Points


              Intraday trading mein pivot points ka use market ke short-term trends aur price movements ko identify karne ke liye hota hai. Intraday traders pivot points ko daily trading decisions ke liye use karte hain aur yeh levels unko market ke key turning points aur potential reversals ko identify karne mein madad karte hain.

              Intraday trading ke dauran market ki price movements fast aur volatile hoti hain, isliye pivot points ko use karke traders market ke important levels ko track kar sakte hain aur quick trades execute kar sakte hain. Pivot points traders ko market ke crucial support aur resistance levels ko determine karne mein madad karte hain, jo intraday trading strategies ke liye essential hote hain.

              Pivot points ka use intraday trading ke liye market ke hourly aur 15-minute charts par bhi kiya jata hai. Yeh traders ko short-term trends ko analyze karne aur quick trading decisions lene mein help karte hain. Intraday traders pivot points ke zariye market ke movements ko monitor kar sakte hain aur timely trades execute kar sakte hain.
              Pivot Points Aur Risk Management


              Pivot points risk management ke liye bhi important hain. Risk management forex trading ka ek crucial aspect hai, aur pivot points traders ko stop-loss aur take-profit orders place karne mein madad karte hain. Yeh levels market ke potential reversals aur price movements ko identify karte hain, jo risk management strategies ke liye essential hain.

              Agar aap pivot points ko use karke stop-loss aur take-profit orders place karte hain, to yeh aapki trading risk ko manage karne mein help karte hain. For example, agar market pivot point ke upar trade kar rahi hoti hai, to aap apna stop-loss pivot point ke niche place kar sakte hain aur take-profit orders ko higher resistance levels par place kar sakte hain.

              Risk management ke liye pivot points ke saath saath other technical analysis tools aur risk management strategies ka bhi use kiya jata hai. Yeh tools aur strategies traders ko market ke movements ko accurately analyze karne aur risk ko effectively manage karne mein help karte hain. Pivot points risk management ke process ko simplify karte hain aur traders ko disciplined trading approach adopt karne mein madad karte hain.
              Pivot Points Aur Market Volatility


              Market volatility ke dauran pivot points ka use market ke sudden movements aur fluctuations ko manage karne ke liye kiya jata hai. Pivot points market ke key levels ko determine karte hain aur yeh levels market ke volatility aur price movements ko accurately capture karte hain.

              Volatile market conditions ke dauran, pivot points traders ko market ke important levels ko identify karne aur trading strategies ko accordingly adjust karne mein madad karte hain. Pivot points ke zariye traders market ke crucial support aur resistance levels ko track kar sakte hain aur apni trades ko market ki volatility ke hisaab se adjust kar sakte hain.

              Market volatility ko manage karne ke liye pivot points ke saath saath other technical analysis tools aur volatility indicators ka bhi use kiya jata hai. Yeh tools aur indicators traders ko market ke fluctuations aur price movements ko accurately analyze karne mein help karte hain. Pivot points volatility ko manage karne mein ek important tool hain aur traders ko market ki dynamics ko effectively handle karne mein madad karte hain.
              Pivot Point Indicators


              Forex trading platforms pivot point indicators provide karte hain jo automatically pivot points calculate aur plot karte hain. Yeh indicators traders ko manual calculations se bachate hain aur accurate levels provide karte hain.

              Pivot point indicators traders ke liye ek convenient aur efficient tool hain jo market ke key levels ko identify karne mein madad karte hain. In indicators ka use karke traders market ke potential support aur resistance levels ko accurately gauge kar sakte hain aur apni trading strategies ko accordingly adjust kar sakte hain.

              Forex trading platforms par available pivot point indicators usually different types ke pivot points ko calculate karte hain, jaise ki standard, Fibonacci, Woodie’s, aur Camarilla pivot points. Yeh indicators traders ko ek comprehensive view provide karte hain aur unki trading decisions ko enhance karte hain.
              Pivot Point Strategies


              Different traders different pivot point strategies adopt karte hain jo unki trading style aur market conditions ke hisaab se hoti hain. Pivot point strategies ko market ke trends aur movements ko accurately analyze karne ke liye use kiya jata hai.
              1. Support aur Resistance Trading: Traders pivot points ko support aur resistance levels ke tor par use karte hain. Agar price pivot point se upar trade kar rahi hoti hai, to yeh buy signal hota hai aur agar niche trade kar rahi hoti hai, to yeh sell signal hota hai. Traders yeh levels use karke trading decisions lete hain aur market ke trends ko follow karte hain.
              2. Trend Confirmation: Pivot points ko trend confirmation ke liye bhi use kiya jata hai. Traders pivot points ko market ke trend ko confirm karne ke liye use karte hain aur market ke direction ke hisaab se trades execute karte hain. Yeh strategy trend-following traders ke liye effective hoti hai.
              3. Reversal Trading: Pivot points ko market ke potential reversal points ko identify karne ke liye bhi use kiya jata hai. Traders pivot points ko reversal trading strategies ke liye use karte hain aur market ke turning points ko capture karne ki koshish karte hain.
              4. Breakout Trading: Pivot points ka use breakout trading strategies ke liye bhi hota hai. Traders pivot points ke levels ko monitor karte hain aur market ke breakout points ko identify karte hain. Yeh strategy market ke sudden price movements ko capture karne mein madad karti hai.
              Common Mistakes With Pivot Points


              Pivot points ke use mein kuch common mistakes hoti hain jo trading outcomes ko negatively affect kar sakti hain. In mistakes ko avoid karna zaroori hai taake aapki trading strategies effective aur profitable rahein.
              1. Improper Calculation: Pivot points ko accurately calculate karna zaroori hai. Agar aap calculations mein mistakes karte hain, to yeh incorrect levels ko generate kar sakta hai jo aapki trading decisions ko impact kar sakte hain. Accurate calculations ko ensure karna trading success ke liye important hai.
              2. Ignoring Market Conditions: Pivot points ko market conditions ke hisaab se adjust karna zaroori hai. Agar aap market ke current conditions ko ignore karte hain aur pivot points ko static level ke tor par use karte hain, to yeh aapki trading strategies ko negatively impact kar sakta hai.
              3. Over-Reliance on Pivot Points: Pivot points ke saath saath other technical analysis tools aur indicators ka bhi use karna zaroori hai. Over-reliance on pivot points hi market ke complete picture ko capture nahi kar sakta aur aapki trading decisions ko affect kar sakta hai.
              4. Failure to Adjust Strategies: Market conditions aur trends change hote hain, isliye pivot points ko apni trading strategies ke hisaab se adjust karna zaroori hai. Agar aap apni strategies ko adjust nahi karte hain, to aap market ke changes ko effectively manage nahi kar sakte aur aapki trading performance affect ho sakti hai.
              Conclusion


              Pivot points forex trading ka ek crucial aspect hain jo traders ko market ke dynamics ko samajhne aur apne trading decisions ko improve karne mein madad dete hain. In points ko accurately calculate karke aur strategically use karke traders market ke potential reversals aur support-resistance levels ko identify kar sakte hain. Pivot points ka use sahi tareeqe se karke traders apne trading strategies ko enhance kar sakte hain aur market ke trends ko effectively analyze kar sakte hain.

              Pivot points ko forex trading mein effectively use karne ke liye traders ko inke calculations, types, aur market dynamics ko achi tarah samajhna chahiye. Yeh tool traders ko market ke key levels ko determine karne aur apni trading strategies ko accordingly adjust karne mein significant help provide karta hai. Accurate analysis aur strategic use ke zariye, traders apne trading outcomes ko improve kar sakte hain aur profitable trading opportunities ko identify kar sakte hain.
              • #8 Collapse

                Forex trading mein pivot point ek ahem technical indicator hai jo market ki movement ko samajhne mein madad karta hai. Ye ek aisa point hai jahan se price movement ko analyze kar ke market ke future direction ka andaza lagaya ja sakta hai. Pivot point ko daily, weekly, ya monthly charts par calculate kiya ja sakta hai, lekin daily charts par ye zyada use hota hai.
                Pivot Point Ki Calculation


                Pivot point ko calculate karne ka tareeqa bohot simple hai. Yeh calculation usually three points par based hoti hai: the high, low, aur closing price of the previous trading session. In points ka formula kuch is tarah hota hai:

                Pivot Point (P) = (High + Low + Close) / 3

                Iske baad, traders is central pivot point ko use karke market ke support aur resistance levels ko identify karte hain. Pivot point ke aas paas price ka movement indicate karta hai ke market bullish hai ya bearish.
                Support Aur Resistance Levels


                Pivot point ke sath, kuch additional levels bhi calculate kiye jate hain jo market ke support aur resistance points ko define karte hain. Ye levels hain:
                • Support 1 (S1) = 2*Pivot Point - High
                • Support 2 (S2) = Pivot Point - (High - Low)
                • Resistance 1 (R1) = 2*Pivot Point - Low
                • Resistance 2 (R2) = Pivot Point + (High - Low)

                In support aur resistance levels ko use karke traders market ke potential entry aur exit points identify karte hain.
                Pivot Points Ka Use


                Pivot points ka use trading decisions lene mein kiya jata hai. Agar price pivot point ke upar trade kar rahi hai, to yeh bullish signal hota hai, aur agar price pivot point ke neeche trade kar rahi hai, to yeh bearish signal hota hai. Traders is information ka use karke apne trades ko manage karte hain aur market ki direction ko samajhne ki koshish karte hain.
                Pivot Point Ka Faida


                Pivot point ka faida yeh hai ke yeh ek simple aur effective tool hai jo traders ko market ki movement ko samajhne mein madad karta hai. Ye ek clear point provide karta hai jo market ki overall trend ko define karta hai. Is tool ko use karke traders apne risk ko manage kar sakte hain aur trading strategies ko optimize kar sakte hain.

                In summary, pivot points Forex trading mein ek fundamental tool hain jo market ki direction aur trend ko samajhne mein madad karte hain. Traders inhe use karke apne trading decisions ko enhance kar sakte hain aur market ke support aur resistance levels ko effectively identify kar sakte hain.
                • #9 Collapse

                  Forex Trading Mein Pivot Point Kya Hai?


                  Forex trading mein pivot point ek ahem aur basic technical indicator hai jo market ki price action aur trend reversal points ko identify karne mein madad karta hai. Ye concept traders ke liye market ke potential support aur resistance levels ko samajhne ke liye bahut useful hai. Pivot point ek central level provide karta hai jo market ki overall trend aur sentiment ko reflect karta hai. Is level ke aas-paas price movements ko monitor karke traders market ki direction aur possible reversals ko predict kar sakte hain.

                  Pivot point ka use karne se traders ko market ki overall trend ko samajhne mein madad milti hai. Yeh point ek key level hota hai jahan market price apni direction change kar sakti hai. Traders pivot point ke around support aur resistance levels ko determine karke trading decisions lete hain. Pivot point analysis se market ki volatility aur potential turning points ko identify kiya ja sakta hai, jo trading strategies ko enhance karte hain.

                  Is concept ko samajhne ke liye, ek simple example lete hain. Agar ek trader ne dekha ke price pivot point ke upar trade kar rahi hai, to yeh bullish signal hota hai aur trader market ko upward trend ki taraf expect kar sakta hai. Iske opposite agar price pivot point ke niche trade kar rahi hai, to yeh bearish signal hota hai aur trader market ke downward trend ki expectation rakh sakta hai. Pivot point ke istemal se traders apni trading strategies ko market conditions ke mutabiq adjust kar sakte hain.

                  Pivot point ki importance is baat mein bhi hai ke yeh traders ko potential reversals aur market dynamics ko samajhne mein madad karta hai. Market mein price movements ke analysis se pivot points ki accuracy ko enhance kiya ja sakta hai. Is indicator ke sath technical analysis aur risk management strategies ko combine karke traders better trading decisions le sakte hain.
                  Pivot Point Ki Definition


                  Pivot point ek technical indicator hai jo market ke price action ko central level par analyze karta hai. Yeh ek average price level hota hai jo market ke previous trading day ke high, low, aur close prices ko consider karke calculate kiya jata hai. Pivot point ko market ke key levels ke roop mein dekha jata hai jo price movements ke direction ko indicate karte hain.

                  Pivot point ki calculation se traders ko market ke potential support aur resistance levels ka idea milta hai. Yeh calculation ek average level provide karti hai jo price action ke central point ko represent karta hai. Pivot point ki definition ke mutabiq, agar price pivot point ke upar hai to market bullish hai aur agar price pivot point ke niche hai to market bearish hai. Yeh concept traders ko market ke trend aur sentiment ko samajhne mein madad karta hai.

                  Pivot point ek tool hai jo market ke overall sentiment ko analyze karne ke liye use hota hai. Iski calculation ka basic formula hai:

                  Pivot Point=High+Low+Close3\text{Pivot Point} = \frac{\text{High} + \text{Low} + \text{Close}}{3}Pivot Point=3High+Low+Close​

                  Is formula se traders ko ek central level milta hai jo market ke price action ke average ko represent karta hai. Yeh level traders ko support aur resistance levels ko determine karne mein madad karta hai, jo trading decisions ko guide karta hai.

                  Pivot point ko technical analysis ke sath combine karne se market trends aur price movements ko accurately predict kiya ja sakta hai. Yeh tool market ke key levels aur potential reversals ko identify karne mein helpful hota hai. Pivot point ki definition aur calculation traders ko market analysis ke liye ek reliable framework provide karti hai.
                  Pivot Point Ka Calculation


                  Pivot point calculate karna kaafi straightforward hai aur iski accuracy market analysis ke liye important hai. Pivot point ke calculation ke liye, previous trading day ke high, low, aur close prices ka use kiya jata hai. Formula kuch is tarah hota hai:

                  Pivot Point=High+Low+Close3\text{Pivot Point} = \frac{\text{High} + \text{Low} + \text{Close}}{3}Pivot Point=3High+Low+Close​

                  Is formula se aap ek central pivot point calculate karte hain jo market ke price action ke average ko represent karta hai. Is central point ke aas-paas support aur resistance levels calculate kiye jate hain jo market ki potential turning points ko identify karte hain.

                  Pivot point calculation ke baad, traders support aur resistance levels calculate karte hain jo market ki key levels ko represent karte hain. Yeh levels market ke reversal points aur trend continuation points ko indicate karte hain. Support levels woh points hain jahan market price niche aane par ruk sakti hai, aur resistance levels woh points hain jahan price upar aane par rokti hai.

                  Pivot point ke calculation ka process kuch is tarah hota hai:
                  1. High Price: Previous trading day ka highest price.
                  2. Low Price: Previous trading day ka lowest price.
                  3. Close Price: Previous trading day ka closing price.

                  In prices ko formula me insert karke central pivot point calculate kiya jata hai. Is central point ke aas-paas support aur resistance levels ko calculate kiya jata hai jo trading decisions ko guide karte hain.

                  Pivot point calculation se traders ko market ke trend aur sentiment ko accurately analyze karne mein madad milti hai. Yeh calculation ek reliable framework provide karti hai jo market ke key levels aur potential reversals ko identify karne mein help karta hai.
                  Support Aur Resistance Levels


                  Support aur resistance levels pivot point ke around determine kiye jate hain aur yeh market ke key levels ko represent karte hain. Support levels woh points hote hain jahan market price niche aane par ruk sakti hai aur resistance levels woh points hote hain jahan price upar aane par rokti hai. Pivot point ke around yeh levels traders ko market ke potential turning points aur trend continuation points ko identify karne mein madad karte hain.

                  Support aur resistance levels calculate karne ke liye, pivot point ke formula se calculate kiye gaye central level ko use kiya jata hai. Support aur resistance levels kuch is tarah calculate kiye jate hain:
                  1. First Support Level (S1): S1=2×Pivot Point−HighS1 = 2 \times \text{Pivot Point} - \text{High}S1=2×Pivot Point−High
                  2. Second Support Level (S2): S2=Pivot Point−(High−Low)S2 = \text{Pivot Point} - (\text{High} - \text{Low})S2=Pivot Point−(High−Low)
                  3. First Resistance Level (R1): R1=2×Pivot Point−LowR1 = 2 \times \text{Pivot Point} - \text{Low}R1=2×Pivot Point−Low
                  4. Second Resistance Level (R2): R2=Pivot Point+(High−Low)R2 = \text{Pivot Point} + (\text{High} - \text{Low})R2=Pivot Point+(High−Low)

                  Yeh levels market ke key points ko represent karte hain aur traders ko potential support aur resistance points ko identify karne mein madad karte hain. Support aur resistance levels ka analysis market ke trend aur price movements ko accurately predict karne mein help karta hai.

                  Traders support aur resistance levels ko trading strategies me integrate karte hain aur in levels ke breakouts ya reversals par trading decisions lete hain. Yeh levels market ke sentiment aur trend ko reflect karte hain aur traders ko effective trading decisions le kar market ko analyze karne mein madad karte hain.
                  Pivot Point Ke Types


                  Pivot points ke various types hain jo different trading strategies aur market conditions ke liye use kiye jate hain. Har type ka pivot point calculation method alag hota hai aur traders ke liye specific use cases provide karta hai. Pivot points ke kuch common types hain:
                  1. Standard Pivot Point: Ye sabse common type hai aur iska calculation simple formula se hota hai. Isme previous trading day ke high, low, aur close prices ko average karke pivot point calculate kiya jata hai. Ye point market ke central level ko represent karta hai aur support/resistance levels ko determine karne ke liye use hota hai.
                  2. Fibonacci Pivot Points: Isme Fibonacci ratios ka use hota hai jo support aur resistance levels ko determine karne mein help karte hain. Fibonacci ratios market ke price movements ko predict karne ke liye use kiye jate hain. Yeh method Fibonacci retracement levels ke sath combine karke support aur resistance levels ko calculate karta hai.
                  3. Woodie’s Pivot Points: Woodie’s method pivot point calculation ka thoda different approach hai. Isme previous day ke close price ko consider kiya jata hai aur high aur low prices ke sath combine karke pivot point calculate kiya jata hai. Yeh method short-term traders ke liye useful hota hai aur market ke current trend ko accurately reflect karta hai.
                  4. Camarilla Pivot Points: Camarilla method short-term trading ke liye useful hota hai aur isme pivot levels ko calculate karne ka unique method hota hai. Isme market ke short-term trends aur price movements ko analyze karke support aur resistance levels determine kiye jate hain. Yeh method specific market conditions ke liye effective hota hai aur traders ko precise trading signals provide karta hai.

                  Har type ke pivot point ka calculation method aur use case different hota hai. Traders apne trading strategies aur market conditions ke mutabiq appropriate pivot point type ko select kar sakte hain. Yeh types market ke analysis aur trading decisions ko enhance karne mein madad karte hain.
                  Pivot Point Ka Use Kaise Karein?


                  Pivot point ka use karne ke liye traders market ke trend aur price movements ko analyze karte hain. Pivot point ke around price action ko monitor karke traders market ki potential direction aur trend reversal points ko identify karte hain. Pivot point ke istemal se traders ko market ki direction aur sentiment ko samajhne mein madad milti hai.

                  Pivot point ka use karte waqt, traders support aur resistance levels ko analyze karte hain aur price movements ke according trading decisions lete hain. Agar price pivot point ke upar trade kar rahi hai, to market bullish hai aur agar price pivot point ke niche trade kar rahi hai, to market bearish hai. Yeh analysis traders ko market ke trend aur sentiment ko accurately understand karne mein madad karta hai.

                  Pivot point ka use trading strategies mein bhi kiya jata hai. Traders pivot point ke around price action patterns ko monitor karte hain aur support/resistance levels ke breakouts ya reversals par trading decisions lete hain. Yeh strategies market ke current conditions aur trends ke mutabiq hoti hain aur trading decisions ko guide karte hain.

                  Pivot point ke use se risk management strategies bhi implement ki ja sakti hain. Traders pivot levels ko stop-loss aur take-profit levels set karne ke liye use karte hain. Yeh levels market ke potential turning points aur price movements ko reflect karte hain aur trading decisions ko manage karne mein help karte hain.
                  Pivot Point Aur Price Action


                  Pivot point aur price action ka combination trading analysis ko enhance karta hai. Price action patterns aur pivot points ke analysis se traders market ke trend aur potential reversals ko accurately predict kar sakte hain. Price action patterns jaise ke candlestick patterns aur chart formations pivot points ke sath combine karke trading signals generate kiye jate hain.

                  Price action analysis pivot point ke around price movements ko monitor karke trading decisions ko guide karta hai. Traders price action patterns ko observe karte hain aur pivot levels ke breakouts ya reversals par trade karte hain. Yeh analysis market ke sentiment aur trend ko reflect karta hai aur trading decisions ko improve karta hai.

                  Pivot point aur price action analysis se traders ko market ke key levels aur trend continuation points ko identify karne mein madad milti hai. Yeh combination market ke dynamics ko accurately understand karne mein help karta hai aur trading strategies ko enhance karta hai. Price action patterns aur pivot points ke analysis se trading signals ko better interpret kiya ja sakta hai.

                  Traders price action aur pivot point ke combination ko apni trading strategies mein integrate karte hain. Yeh combination market ke trend aur potential reversals ko accurately predict karne mein help karta hai aur trading decisions ko improve karta hai. Pivot point aur price action analysis trading decisions ko enhance karne ke liye ek effective tool hai.
                  Pivot Point Aur Risk Management


                  Pivot point risk management ke liye bhi useful hai. Traders pivot levels ko risk management strategies mein integrate karte hain aur support/resistance levels ke basis par stop-loss aur take-profit levels set karte hain. Pivot point ke around price movements ko analyze karke risk ko manage kiya ja sakta hai aur trading decisions ko better handle kiya ja sakta hai.

                  Support aur resistance levels ko risk management ke liye use kiya jata hai. Traders pivot point ke around yeh levels ko consider karte hain aur price movements ke basis par risk ko manage karte hain. Yeh levels market ke potential turning points aur price movements ko reflect karte hain aur trading decisions ko guide karte hain.

                  Pivot point aur risk management ka combination traders ko market ke trend aur sentiment ko samajhne mein madad karta hai. Yeh combination risk ko effectively manage karne mein help karta hai aur trading decisions ko improve karta hai. Risk management strategies pivot point ke sath combine karke traders apne trading positions ko better manage kar sakte hain.

                  Pivot point ka use risk management ke liye bhi kiya jata hai. Traders market ke key levels aur price movements ko analyze karte hain aur trading decisions ko risk management strategies ke mutabiq adjust karte hain. Yeh approach trading risk ko minimize karne aur trading decisions ko enhance karne ke liye effective hota hai.
                  Pivot Point Ka Role Market Trends Mein


                  Pivot point market trends ko identify karne mein ek important role play karta hai. Jab price pivot point se upar ya niche move karti hai, to yeh market ke trend aur potential reversals ki indication hoti hai. Pivot point market ke central level ko represent karta hai aur price movements ke basis par trend analysis kiya jata hai.

                  Market trends ko analyze karte waqt, traders pivot point ke position ko monitor karte hain aur price movements ke basis par trading decisions lete hain. Agar price pivot point ke upar trade kar rahi hai, to market bullish hai aur agar price pivot point ke niche trade kar rahi hai, to market bearish hai. Yeh analysis traders ko market ke trend aur sentiment ko accurately understand karne mein madad karta hai.

                  Pivot point market trends ko identify karne ke liye ek reliable framework provide karta hai. Yeh framework market ke key levels aur potential turning points ko reflect karta hai aur trading decisions ko guide karta hai. Pivot point ka role market trends ke analysis mein important hota hai aur traders ko market ke dynamics ko accurately understand karne mein help karta hai.

                  Market trends ko analyze karne ke liye, pivot point ke sath other technical indicators aur analysis tools ko combine kiya jata hai. Yeh combination market ke trends aur price movements ko better predict karne mein madad karta hai aur trading decisions ko improve karta hai.
                  Daily Aur Weekly Pivot Points


                  Pivot points ko daily aur weekly timeframes ke liye calculate kiya ja sakta hai. Daily pivot points short-term trading ke liye useful hote hain aur weekly pivot points long-term trading decisions ke liye madadgar hote hain. Har timeframe ka pivot point calculation market ke specific conditions aur trading strategies ke liye effective hota hai.

                  Daily Pivot Points: Daily pivot points ek trading day ke high, low, aur close prices ko consider karke calculate kiye jate hain. Yeh points short-term traders ko market ke key levels aur potential reversals ko identify karne mein madad karte hain. Daily pivot points market ke short-term trends aur price movements ko reflect karte hain.

                  Weekly Pivot Points: Weekly pivot points previous week ke high, low, aur close prices ko consider karke calculate kiye jate hain. Yeh points long-term traders ko market ke key levels aur trend continuation points ko identify karne mein madad karte hain. Weekly pivot points market ke long-term trends aur price movements ko reflect karte hain.

                  Daily aur weekly pivot points ka use trading strategies mein kiya jata hai aur market ke trends aur sentiment ko accurately analyze karne ke liye effective hote hain. Traders apni trading strategies aur market conditions ke mutabiq daily aur weekly pivot points ko use karte hain aur trading decisions ko guide karte hain.

                  Daily aur weekly pivot points ke analysis se traders ko market ke different timeframes ke trends aur price movements ko understand karne mein madad milti hai. Yeh analysis trading decisions ko enhance karne aur market ke key levels ko identify karne mein help karta hai.
                  Pivot Point Indicators Aur Tools


                  Trading platforms pe pivot point indicators aur tools available hote hain jo automatically pivot points aur support/resistance levels ko calculate kar dete hain. Yeh tools traders ko real-time data provide karte hain aur trading decisions ko enhance karte hain. Pivot point indicators traders ko market ke key levels aur potential reversals ko accurately identify karne mein madad karte hain.

                  Pivot Point Indicators: Trading platforms pe available pivot point indicators pivot points aur support/resistance levels ko automatically calculate karte hain. Yeh indicators market ke price action aur trends ko monitor karke trading signals generate karte hain. Indicators ke sath traders ko real-time data aur accurate calculations milte hain jo trading decisions ko enhance karte hain.

                  Pivot Point Tools: Pivot point tools trading platforms pe available hote hain jo pivot points aur support/resistance levels ko visualize karne ke liye use kiye jate hain. Yeh tools traders ko market ke key levels aur price movements ko analyze karne mein madad karte hain. Tools ke sath traders ko market ke trends aur potential reversals ko better understand karne mein help milti hai.

                  Pivot point indicators aur tools trading analysis ko simplify karte hain aur traders ko market ke key levels aur trends ko accurately predict karne mein madad karte hain. Yeh tools market ke real-time data aur accurate calculations provide karte hain jo trading decisions ko enhance karte hain.

                  Trading platforms pe available pivot point indicators aur tools traders ko market ke dynamics aur price movements ko better analyze karne mein madad karte hain. Yeh tools trading strategies ko improve karne aur market ke key levels ko identify karne ke liye effective hote hain.
                  Pivot Points Aur Other Indicators


                  Pivot points ko other technical indicators ke sath combine karke trading strategies develop ki ja sakti hain. Moving averages, RSI (Relative Strength Index), aur MACD (Moving Average Convergence Divergence) ke sath pivot points ko use karke accurate trading signals milte hain. Other indicators ke sath pivot points ka combination market ke trends aur price movements ko better predict karne mein madad karta hai.

                  Moving Averages: Moving averages pivot points ke sath combine karke market ke trend aur potential reversals ko analyze karte hain. Moving averages market ke average price ko smooth out karte hain aur trend identification mein madad karte hain. Pivot points aur moving averages ke combination se trading signals ko enhance kiya ja sakta hai.

                  RSI (Relative Strength Index): RSI ek momentum oscillator hai jo market ke overbought aur oversold conditions ko identify karne mein madad karta hai. Pivot points aur RSI ke combination se market ke trend aur potential reversals ko accurately predict kiya ja sakta hai. Yeh combination trading decisions ko improve karta hai aur market ke dynamics ko reflect karta hai.

                  MACD (Moving Average Convergence Divergence): MACD ek trend-following indicator hai jo market ke momentum aur trend changes ko identify karne mein madad karta hai. Pivot points aur MACD ke combination se market ke key levels aur trend continuation points ko accurately analyze kiya ja sakta hai. Yeh combination trading signals ko enhance karne mein help karta hai.

                  Pivot points aur other technical indicators ke combination se traders market ke trends aur price movements ko better analyze kar sakte hain. Yeh combination trading strategies ko improve karne aur market ke key levels ko accurately identify karne mein madad karta hai.
                  Pivot Point Trading Strategies


                  Pivot points ke basis pe trading strategies develop ki ja sakti hain. Pivot points market ke key levels aur potential reversals ko identify karne mein madad karte hain. Traders pivot points ke around price action ko monitor karte hain aur support/resistance levels ke breakouts ya reversals par trading decisions lete hain.

                  Breakout Strategy: Pivot points ke breakout strategy mein traders price ke pivot point ke breakouts ko monitor karte hain. Agar price pivot point ke upar breakout karti hai, to traders bullish position lete hain aur agar price pivot point ke niche breakout karti hai, to traders bearish position lete hain. Yeh strategy market ke trend aur sentiment ko reflect karti hai aur trading decisions ko guide karti hai.

                  Reversal Strategy: Pivot points ke reversal strategy mein traders price action patterns aur pivot levels ke reversals ko monitor karte hain. Agar price pivot point ke support level se reverse hoti hai, to traders buying position lete hain aur agar price pivot point ke resistance level se reverse hoti hai, to traders selling position lete hain. Yeh strategy market ke potential reversals aur trend continuation points ko identify karti hai.

                  Trend Continuation Strategy: Pivot points ke trend continuation strategy mein traders price ke pivot levels ke basis par market ke trend continuation ko monitor karte hain. Agar price pivot point ke upar trade kar rahi hai, to traders uptrend ko continue karne ki expectation rakhte hain aur agar price pivot point ke niche trade kar rahi hai, to traders downtrend ko continue karne ki expectation rakhte hain. Yeh strategy market ke trend aur sentiment ko accurately analyze karti hai.

                  Pivot point trading strategies market ke key levels aur price movements ko accurately predict karne mein madad karti hain. Traders apni trading strategies ko pivot points ke analysis aur market conditions ke mutabiq adjust karte hain aur trading decisions ko guide karte hain.
                  Conclusion


                  Forex trading mein pivot point ek valuable tool hai jo market ke trend aur potential reversals ko identify karne mein madad karta hai. Pivot point ki various types aur applications ko samajh kar traders apni trading strategies ko enhance kar sakte hain aur market trends ko better analyze kar sakte hain. Pivot point ka use trading decisions ko improve karne aur market ke key levels ko accurately identify karne ke liye effective hota hai.

                  Pivot point ke around support aur resistance levels ko analyze karne se market ke trend aur price movements ko accurately predict kiya ja sakta hai. Pivot points aur other technical indicators ke combination se trading strategies ko enhance kiya ja sakta hai aur market ke dynamics ko better understand kiya ja sakta hai.

                  Trading platforms pe available pivot point indicators aur tools market ke real-time data aur accurate calculations provide karte hain jo trading decisions ko enhance karte hain. Traders apni trading strategies ko pivot points ke analysis aur market conditions ke mutabiq adjust karte hain aur trading decisions ko better manage karte hain.

                  Pivot point trading strategies market ke key levels aur potential reversals ko identify karne mein madad karti hain aur trading decisions ko guide karti hain. Pivot point ka role Forex trading mein ek important aspect hai jo market analysis aur trading decisions ko improve karne mein help karta hai.
                  • #10 Collapse

                    Pivot Point Kya Hai Forex Mein?

                    1. Introduction

                    Forex trading mein pivot point ek ahem technical indicator hai jo traders ko price movements aur market ke potential turning points ko samajhne mein madad karta hai. Pivot point ko primarily market ke support aur resistance levels ko determine karne ke liye use kiya jata hai. Yeh indicator trading decisions ko guide karne mein kaafi madadgar hota hai aur iska use trading strategies aur risk management mein bhi hota hai. Is article mein hum pivot point ke concepts, calculation methods, aur trading strategies mein uski importance ko detail se samjhenge.

                    Pivot point ki basic understanding ke liye yeh samajhna zaroori hai ke yeh market ki overall direction aur momentum ko track karne mein madad karta hai. Pivot point ki calculation aik central value provide karti hai jo market ke potential support aur resistance levels ko identify karti hai. Traders is value ko dekh kar decide karte hain ke market kis direction mein move kar sakti hai aur kis point par price reversal ho sakta hai. Yeh analysis traders ko ek clear picture provide karta hai jo unki trading decisions ko influence karta hai.

                    Trading mein pivot point ko implement karne ka tareeqa kaafi straightforward hai. Aapko previous trading session ke high, low, aur close prices ko use karna hota hai. Yeh values pivot point ko calculate karne ke liye essential hain aur iski calculation se market ke key levels ka pata chalta hai. Pivot point ko daily, weekly, aur monthly time frames mein calculate kiya ja sakta hai jo traders ko short-term aur long-term trading decisions lene mein madad karta hai.

                    Pivot point ka concept sirf Forex trading tak hi limited nahi hai, balki yeh stocks, commodities, aur other financial markets mein bhi use hota hai. Yeh indicator traders ko market ki trends aur potential reversal points ko identify karne mein help karta hai. Aaj ke is article mein, hum pivot point ke detailed aspects aur practical applications par focus karenge jo aapko Forex trading mein is indicator ko effectively use karne mein madad karenge.

                    2. Pivot Point Ka Taaruf

                    Pivot point ka basic idea yeh hai ke yeh ek central level provide karta hai jo market ke support aur resistance levels ko identify karne mein help karta hai. Yeh central level previous trading session ke high, low, aur close prices ko consider karke calculate kiya jata hai. Pivot point ki calculation ek formula ke zariye hoti hai jo traders ko market ki overall direction aur momentum ko analyze karne mein madad karta hai.

                    Pivot point ko calculate karne ke baad, traders uske upar aur neeche support aur resistance levels ko identify karte hain. Support levels wo points hain jahan price downward movement ke bawajood ruk sakti hai ya reverse ho sakti hai. Resistance levels wo points hain jahan price upward movement ke bawajood rok sakti hai. Pivot point ka central level market ke key levels ko set karta hai aur traders iske around price movements ko analyze karte hain.

                    Pivot point ka main purpose market ki direction aur potential turning points ko identify karna hota hai. Agar price pivot point se upar trade kar rahi hai, toh yeh bullish signal hota hai aur agar neeche ho, toh bearish signal. Yeh indicator traders ko market ke trends aur movements ke baare mein insights provide karta hai jo unke trading decisions ko influence karte hain.

                    Pivot point ka concept trading strategies aur risk management mein bhi use hota hai. Traders pivot point aur support/resistance levels ko stop loss aur take profit levels set karne ke liye use karte hain. Yeh strategy unhe market ke potential turning points ko identify karne mein madad karti hai aur unke trading risk ko manage karne mein help karti hai.

                    3. Pivot Point Calculation

                    Pivot point ko calculate karna kaafi simple process hai lekin iske accurate calculation se hi aap market ke key levels ko identify kar sakte hain. Sabse pehle, aapko previous day ki high, low, aur close prices ki zaroorat hoti hai. Yeh prices aapko market ke previous session ke performance ko analyze karne mein madad karti hain.

                    Pivot point ki calculation ke liye yeh formula use hota hai:

                    Pivot Point=High+Low+Close3\text{Pivot Point} = \frac{\text{High} + \text{Low} + \text{Close}}{3}Pivot Point=3High+Low+Close​

                    Is formula ko apply karne se aapko ek central value milti hai jo market ke support aur resistance levels ko determine karti hai. Yeh central value market ke trends aur movements ko analyze karne ke liye base level provide karti hai.

                    Support aur resistance levels ko calculate karne ke liye aap additional formulas use karte hain jo pivot point ke upar aur neeche levels ko identify karte hain. Yeh levels market ke potential turning points ko identify karne mein help karte hain aur traders ko entry aur exit points set karne mein madad karte hain.

                    Pivot point ki calculation ko daily, weekly, aur monthly time frames mein bhi kiya ja sakta hai. Har time frame ke liye pivot point aur support/resistance levels ki calculation alag hoti hai aur yeh traders ko different time periods ke liye market ke key levels ko identify karne mein madad karti hai.

                    4. Support aur Resistance Levels

                    Support aur resistance levels pivot point ke calculation ka important part hain. Yeh levels market ke potential turning points ko identify karne mein madad karte hain aur traders ko market ki direction ko samajhne mein help karte hain. Support levels wo points hain jahan price downward movement ke bawajood ruk sakti hai ya reverse ho sakti hai. Resistance levels wo points hain jahan price upward movement ke bawajood rok sakti hai.

                    Support levels ko calculate karne ke liye yeh formulas use kiye jate hain:

                    Support 1=2×Pivot Point−High\text{Support 1} = 2 \times \text{Pivot Point} - \text{High}Support 1=2×Pivot Point−High Support 2=Pivot Point−(High−Low)\text{Support 2} = \text{Pivot Point} - (\text{High} - \text{Low})Support 2=Pivot Point−(High−Low)

                    Resistance levels ko calculate karne ke liye yeh formulas use kiye jate hain:

                    Resistance 1=2×Pivot Point−Low\text{Resistance 1} = 2 \times \text{Pivot Point} - \text{Low}Resistance 1=2×Pivot Point−Low Resistance 2=Pivot Point+(High−Low)\text{Resistance 2} = \text{Pivot Point} + (\text{High} - \text{Low})Resistance 2=Pivot Point+(High−Low)

                    Yeh support aur resistance levels traders ko market ke key points ko identify karne mein madad karte hain. Agar price support level ke kareeb ho aur bounce kar rahi ho, toh yeh bullish signal ho sakta hai. Agar price resistance level ke kareeb ho aur wahan se reverse ho, toh yeh bearish signal ho sakta hai.

                    Support aur resistance levels ko identify karne ke baad, traders market ke potential turning points ko observe karte hain aur apni trading strategies ko adjust karte hain. Yeh levels market ki trends aur movements ko samajhne mein help karte hain aur trading decisions ko influence karte hain.

                    5. Pivot Point Ka Role Trading Strategy Mein

                    Pivot point trading strategy mein kaafi important role play karta hai. Yeh indicator market ke potential entry aur exit points ko identify karne mein madad karta hai. Traders pivot point ko dekh kar decide karte hain ke market ki direction kya ho sakti hai aur kis point par price reversal ho sakta hai.

                    Agar price pivot point ke upar trade kar rahi hai, toh yeh bullish signal hota hai aur traders buy positions consider karte hain. Agar price pivot point ke neeche trade kar rahi hai, toh yeh bearish signal hota hai aur traders sell positions consider karte hain. Pivot point traders ko market ki overall direction ko samajhne mein help karta hai jo unki trading strategies ko influence karta hai.

                    Pivot point ke saath support aur resistance levels ko bhi consider kiya jata hai. Agar price support level se bounce kar rahi hai, toh yeh bullish signal ho sakta hai aur agar resistance level se reverse ho rahi hai, toh yeh bearish signal ho sakta hai. Traders in levels ko observe karke apni trading strategies ko adjust karte hain aur entry/exit points ko set karte hain.

                    Pivot point ka use risk management mein bhi hota hai. Traders stop loss aur take profit levels ko pivot point aur support/resistance levels ke around set karte hain. Yeh strategy unhe trading risk ko manage karne mein madad karti hai aur market ke potential turning points ko identify karne mein help karti hai.

                    6. Pivot Point Aur Market Trends

                    Pivot point market trends ko identify karne mein bhi madadgar hota hai. Agar market pivot point ke upar trading kar rahi hai, toh yeh uptrend ka indication hota hai. Agar market pivot point ke neeche trading kar rahi hai, toh yeh downtrend ka indication hota hai. Pivot point ko market trends ko samajhne ke liye use kiya jata hai jo traders ko apni trading strategies ko adjust karne mein madad karta hai.

                    Market trends ko identify karne ke liye pivot point ke alawa other technical indicators bhi use kiye jate hain. Traders pivot point aur moving averages, trend lines, aur momentum indicators ko combine karke market ke overall trends ko analyze karte hain. Yeh combination traders ko market ki direction aur potential turning points ko identify karne mein help karta hai.

                    Pivot point ka use market ke short-term aur long-term trends ko samajhne ke liye bhi hota hai. Daily, weekly, aur monthly pivot points ko calculate karke traders market ke different time frames ke liye trends ko observe karte hain. Yeh analysis unhe market ke broader perspective ko samajhne mein madad karta hai aur trading decisions ko influence karta hai.

                    Market trends ko identify karne ke liye price action aur pivot point ke beech ke relationship ko bhi observe kiya jata hai. Agar price pivot point ke kareeb ho aur wahan se bounce kar rahi ho, toh yeh ek significant signal ho sakta hai. Traders is signal ko analyze karke apni trading strategies ko adjust karte hain.

                    7. Pivot Point Aur Price Action

                    Price action analysis mein pivot point ka use market ke potential turning points ko identify karne ke liye kiya jata hai. Price action aur pivot point ke beech ke relationship ko observe karke traders market ke trends aur movements ko samajhne ki koshish karte hain. Jab price pivot point ke kareeb hoti hai aur wahan se bounce karti hai, toh yeh ek important signal hota hai.

                    Price action ke analysis ke liye candlestick patterns aur chart formations bhi consider kiye jate hain. Traders pivot point aur price action ke beech ke relationship ko observe karke potential entry aur exit points ko identify karte hain. Yeh analysis unhe market ke behavior ko samajhne mein madad karti hai aur trading decisions ko guide karti hai.

                    Pivot point aur price action ko combine karke traders market ke key levels ko identify karte hain. Agar price pivot point ke kareeb ho aur wahan se significant movement dikhe, toh yeh traders ko trading decisions lene mein help karta hai. Price action ke analysis se traders market ke short-term aur long-term trends ko samajhne ki koshish karte hain.

                    Price action ke analysis mein pivot point ka role trading strategies ko refine karne mein bhi hota hai. Traders pivot point aur price action ke beech ke relationship ko analyze karke apni trading strategies ko adjust karte hain. Yeh approach unhe market ke potential turning points ko identify karne mein madad karti hai aur trading decisions ko influence karti hai.

                    8. Pivot Point Ka Use Risk Management Mein

                    Pivot point ka use risk management mein bhi kaafi important hota hai. Traders pivot point aur support/resistance levels ko stop loss aur take profit levels set karne ke liye use karte hain. Yeh approach unhe trading risk ko manage karne mein madad karti hai aur market ke potential turning points ko identify karne mein help karti hai.

                    Stop loss levels ko pivot point aur support levels ke around set kiya jata hai. Agar price support level ke niche move karti hai, toh stop loss trigger hota hai aur loss ko limit kiya jata hai. Take profit levels ko pivot point aur resistance levels ke around set kiya jata hai. Agar price resistance level ke upar move karti hai, toh take profit trigger hota hai aur profit ko secure kiya jata hai.

                    Risk management ke liye pivot point ke saath other technical indicators bhi use kiye jate hain. Traders pivot point aur volatility indicators, momentum indicators, aur moving averages ko combine karke apni risk management strategies ko refine karte hain. Yeh combination unhe market ke risk ko manage karne mein madad karta hai aur trading decisions ko guide karta hai.

                    Pivot point ka use risk management mein trading psychology ko bhi impact karta hai. Traders pivot point aur support/resistance levels ko analyze karke apni trading strategies ko adjust karte hain. Yeh approach unhe market ke potential risks ko identify karne mein madad karti hai aur trading decisions ko optimize karti hai.

                    9. Pivot Point Aur Different Time Frames

                    Pivot point ko different time frames mein calculate karna traders ko market ke broader perspective ko samajhne mein madad karta hai. Daily, weekly, aur monthly pivot points ko calculate karke traders market ke different time periods ke liye key levels ko identify karte hain. Yeh analysis unhe short-term aur long-term trading decisions lene mein madad karti hai.

                    Daily pivot point ko calculate karne ke liye previous day ki high, low, aur close prices use ki jati hain. Yeh pivot point traders ko daily trading session ke liye market ke key levels ko identify karne mein help karta hai. Weekly pivot point ko calculate karne ke liye previous week ki high, low, aur close prices use ki jati hain. Yeh pivot point traders ko weekly trading session ke liye market ke broader perspective ko samajhne mein madad karta hai.

                    Monthly pivot point ko calculate karne ke liye previous month ki high, low, aur close prices use ki jati hain. Yeh pivot point traders ko monthly trading session ke liye market ke long-term trends aur movements ko identify karne mein madad karta hai. Different time frames ke pivot points ko analyze karke traders market ke short-term aur long-term trends ko samajhte hain.

                    Different time frames ke pivot points ko combine karke traders market ke overall trends aur movements ko analyze karte hain. Yeh combination unhe trading decisions ko refine karne mein madad karta hai aur market ke potential turning points ko identify karne mein help karta hai.

                    10. Pivot Point Ki Limitations

                    Pivot point ki kuch limitations bhi hain jo traders ko dhyan mein rakhni chahiye. Yeh indicator sirf past data par based hota hai aur future price movements ko accurately predict nahi kar sakta. Isliye, pivot point ko other technical indicators ke saath combine karke use karna chahiye taake accurate trading decisions liye ja sakein.

                    Pivot point ki limitations ko overcome karne ke liye traders additional technical indicators aur chart patterns ko use karte hain. Yeh indicators aur patterns market ke broader perspective ko samajhne mein madad karte hain aur pivot point ke signals ko confirm karte hain. Traders pivot point ke saath moving averages, trend lines, aur momentum indicators ko combine karke apni trading strategies ko refine karte hain.

                    Pivot point ki limitations ko trading psychology ke perspective se bhi dekha jata hai. Traders ko market ke behavior aur price movements ko accurately predict karne ke liye market ke broader trends aur sentiments ko bhi consider karna chahiye. Pivot point ka use trading decisions ko guide karne mein madad karta hai, lekin market ki unpredictability ko bhi samajhna zaroori hai.

                    Pivot point ki limitations ko samajhne ke baad, traders apni trading strategies ko adjust karte hain aur market ke potential risks ko manage karte hain. Yeh approach unhe accurate trading decisions lene mein madad karti hai aur market ke potential turning points ko identify karne mein help karti hai.

                    11. Practical Examples

                    Pivot point ko practically use karne ke liye traders historical data ka analysis karte hain. Historical data ko analyze karke traders market ke potential turning points aur key levels ko identify karte hain. Yeh examples traders ko pivot point ke practical applications ko samajhne mein madad karte hain aur trading decisions ko guide karte hain.

                    Agar aap historical data ko analyze karte hain aur dekhte hain ke price pivot point ke kareeb ho aur wahan se significant movement dikhe, toh yeh ek important signal ho sakta hai. Traders is signal ko observe karke apni trading strategies ko adjust karte hain aur market ke potential turning points ko identify karte hain.

                    Pivot point ke practical examples ko analyze karne ke liye traders chart patterns aur candlestick formations ko bhi consider karte hain. Yeh patterns aur formations market ke behavior aur price movements ko samajhne mein madad karte hain aur pivot point ke signals ko confirm karte hain. Traders in patterns ko observe karke apni trading strategies ko refine karte hain.

                    Practical examples ke through traders pivot point ke use ko real-world trading scenarios mein implement karte hain. Yeh examples unhe market ke key levels aur potential turning points ko identify karne mein madad karte hain aur trading decisions ko optimize karte hain.

                    12. Pivot Point Ka Use Different Markets Mein

                    Pivot point ka use Forex ke ilawa stocks, commodities, aur other financial markets mein bhi hota hai. Yeh indicator traders ko market ke potential support aur resistance levels ko identify karne mein madad karta hai. Different markets mein pivot point ka use trading strategies aur risk management mein bhi kiya jata hai.

                    Stocks market mein pivot point ko use karke traders stock ke price movements aur trends ko analyze karte hain. Yeh indicator stock ke potential turning points aur key levels ko identify karne mein madad karta hai. Commodities market mein pivot point ka use commodities ke price movements aur trends ko samajhne ke liye kiya jata hai. Yeh indicator commodities ke potential support aur resistance levels ko identify karne mein help karta hai.

                    Other financial markets mein bhi pivot point ka use similar concepts ke saath kiya jata hai. Yeh indicator market ke potential turning points aur key levels ko identify karne mein madad karta hai. Traders pivot point ko combine karke other technical indicators aur chart patterns ko use karte hain aur market ke broader perspective ko samajhte hain.

                    Pivot point ka use different markets mein trading strategies aur risk management ko enhance karne ke liye kiya jata hai. Yeh approach traders ko market ke key levels aur potential turning points ko identify karne mein madad karti hai aur trading decisions ko guide karti hai.

                    13. Pivot Point Aur Trading Psychology

                    Pivot point ka use trading psychology ko bhi impact karta hai. Traders pivot point aur support/resistance levels ko analyze karke apni trading strategies ko adjust karte hain. Yeh approach unhe market ke potential risks aur rewards ko samajhne mein madad karti hai aur trading decisions ko optimize karti hai.

                    Trading psychology ke perspective se, pivot point traders ko market ke behavior aur sentiment ko samajhne mein madad karta hai. Agar price pivot point ke kareeb ho aur wahan se significant movement dikhe, toh yeh traders ko trading decisions lene mein help karta hai. Pivot point trading psychology ko influence karta hai aur traders ke decision-making process ko guide karta hai.

                    Traders pivot point ko apni trading strategies mein integrate karke apni trading psychology ko bhi enhance karte hain. Yeh approach unhe market ke potential risks aur rewards ko identify karne mein madad karti hai aur trading decisions ko optimize karti hai. Pivot point trading psychology ke perspective se bhi important role play karta hai.

                    Pivot point trading psychology ke perspective se market ke behavior aur sentiment ko samajhne mein bhi madad karta hai. Yeh indicator traders ko market ke potential turning points aur key levels ko identify karne mein madad karta hai aur trading decisions ko guide karta hai.

                    14. Future Trends Aur Pivot Point

                    Pivot point ke future trends ko analyze karne ke liye traders market ke broader trends aur developments ko observe karte hain. Future trends aur pivot point ke beech ke relationship ko samajhne ke liye market ke evolving dynamics aur price movements ko analyze kiya jata hai.

                    Future trends ko identify karne ke liye traders market ke economic indicators aur news events ko bhi consider karte hain. Yeh indicators aur events market ke behavior aur price movements ko influence karte hain. Traders future trends ko pivot point ke saath analyze karke apni trading strategies ko adjust karte hain aur market ke potential turning points ko identify karte hain.

                    Pivot point ke future trends ko analyze karne ke liye traders historical data aur technical analysis tools ko bhi use karte hain. Yeh tools market ke potential turning points aur key levels ko identify karne mein madad karte hain aur trading decisions ko guide karte hain. Future trends aur pivot point ke beech ke relationship ko samajhne ke liye traders market ke evolving dynamics ko analyze karte hain.

                    Pivot point ke future trends ko samajhne ke liye traders market ke broader trends aur sentiments ko bhi consider karte hain. Yeh approach unhe market ke potential risks aur rewards ko identify karne mein madad karti hai aur trading decisions ko optimize karti hai.

                    15. Conclusion

                    Pivot point trading strategy ek valuable tool hai jo market ke key levels aur potential turning points ko identify karne mein madad karta hai. Is indicator ka use trading decisions, risk management, aur market trends ko analyze karne ke liye kiya jata hai. Pivot point ke practical applications aur limitations ko samajhne ke baad traders apni trading strategies ko refine kar sakte hain.

                    Pivot point ka use different markets, time frames, aur trading scenarios mein kiya jata hai. Yeh indicator trading psychology aur future trends ko bhi influence karta hai. Traders pivot point ke saath other technical indicators aur chart patterns ko combine karke apni trading strategies ko enhance karte hain aur market ke potential risks aur rewards ko identify karte hain.

                    In summary, pivot point trading strategy market ke key levels aur potential turning points ko identify karne mein ek effective tool hai. Traders is indicator ko apni trading strategies aur risk management mein integrate karke accurate trading decisions le sakte hain aur market ke broader perspective ko samajh sakte hain.

                    • #11 Collapse

                      Pivot Point Kya Hai Forex Mein?

                      Forex trading ki duniya mein, pivot points ek aham tool hain jo traders ko market ke trend ko samajhne aur entry ya exit points dhoondne mein madad dete hain. Is maqale mein, hum pivot points ki ta'arif, unke faide, aur inhe kaise istemal kiya jata hai, par baat karenge.
                      1. Pivot Point Ka Ta'aruf


                      Pivot point ek technical indicator hai jo price movement ke mukhtalif levels ko darust karne ke liye istemal hota hai. Ye levels price action ke liye support aur resistance ka kaam karte hain.
                      2. Pivot Points Kaise Calculate Kiya Jata Hai


                      Pivot points ko calculate karne ka tareeqa aasan hai. Ye usually pichle din ke high, low, aur close prices ki madad se nikaale jate hain. Formula hai:

                      Pivot Point=High+Low+Close3\text{Pivot Point} = \frac{High + Low + Close}{3}Pivot Point=3High+Low+Close​
                      3. Support Aur Resistance Levels


                      Pivot point ke sath support aur resistance levels bhi calculate kiye jate hain. Pehla support level (S1) aur pehla resistance level (R1) in formulaon se nikaale jate hain:
                      • S1 = (2 * Pivot Point) - High
                      • R1 = (2 * Pivot Point) - Low

                      Dusre support aur resistance levels (S2, R2, S3, R3) bhi isi tarah se calculate kiye jate hain.
                      4. Pivot Points Ka Istemal Kyon Karein?


                      Traders pivot points ko istemal karte hain kyunki ye market ke sentiment aur price movement ko samajhne mein madadgar hote hain. Ye ek objective approach provide karte hain jo emotional decision making ko kam karta hai.
                      5. Market Trends Ki Pehchan


                      Pivot points se traders market ke trend ki pehchan kar sakte hain. Agar price pivot point se upar hai, to bullish trend ki sambhavna hoti hai. Aur agar price neeche hai, to bearish trend ki sambhavna hoti hai.
                      6. Entry Aur Exit Points


                      Pivot points ko entry aur exit points dhoondne ke liye bhi istemal kiya ja sakta hai. Jab price resistance levels tak pohanchti hai, to traders yahan selling ka soch sakte hain. Aur jab support levels par price aati hai, to buying ka mauka samjha ja sakta hai.
                      7. Risk Management


                      Pivot points ke sath risk management ka bhi khayal rakhna chahiye. In points ko dekh kar stop-loss orders ko set kiya ja sakta hai. Ye aapko loss se bacha sakta hai jab market aapke against jaye.
                      8. Trading Strategies


                      Pivot points ke sath mukhtalif trading strategies bna sakte hain. Kuch traders intraday trading ke liye pivot points ko istemal karte hain jabke doosre swing trading ke liye inhe prefer karte hain.
                      9. Pivot Points Ki Limitations


                      Har tool ki tarah, pivot points bhi kuch limitations rakhte hain. Market ki volatility aur unexpected news events in points ki reliability ko kam kar sakte hain.
                      10. Time Frame Ka Ahmiyat


                      Pivot points ko calculate karne ke liye time frame ka khayal rakhna zaroori hai. Daily, weekly, ya monthly pivot points aapke trading style par depend karte hain. Har time frame par pivot points ki significance alag hoti hai.
                      11. Technical Indicators Ke Sath Istemal


                      Pivot points ko doosre technical indicators ke sath istemal karna bhi faydemand ho sakta hai. Jaise moving averages ya RSI ka istemal karke confirmation mil sakta hai.
                      12. Demo Trading Ka Faida


                      Agar aap pivot points ke istemal mein naye hain, to pehle demo account par practice karna acha hai. Ye aapko real market conditions mein seekhne ka mauka dega bina kisi risk ke.
                      13. Psychological Aspects


                      Traders ka psychological aspect bhi pivot points ke istemal mein aham hota hai. Market ki movement ko samajhne aur in points ke sath trading karne se aapka confidence barhta hai.
                      14. Conclusion


                      Pivot points forex trading mein ek valuable tool hain jo traders ko market ki dynamics samajhne aur effective trading decisions lene mein madad karte hain. Inki sahulat se aap market mein behtar performance hasil kar sakte hain. Pivot points ko samajhne aur unhe apne trading strategies mein shaamil karne se aap apni trading skills ko enhance kar sakte hain.

                      Is liye, agar aap forex trading mein serious hain, to pivot points ko zaroor explore karein.
                      • #12 Collapse

                        **Forex Mein Pivot Point Kya Hai?**
                        1. **Taaruf**
                        - Pivot point ek technical analysis tool hai jo traders ko market ke potential reversal points aur support/resistance levels identify karne mein madad karta hai. Yeh point price movements ko samajhne ke liye ek important reference hota hai.

                        2. **Calculation**
                        - Pivot point ko calculate karne ka formula yeh hai:
                        **Pivot Point (PP) = (High + Low + Close) / 3**
                        Yahan, High, Low, aur Close pichlay trading session ke price levels hain. Is formula se pivot point ka central level milta hai.

                        3. **Support Aur Resistance Levels**
                        - Pivot point se additional support aur resistance levels calculate kiye ja sakte hain. Ye levels traders ko help karte hain potential price reversal ya bounce points dhoondne mein.
                        - **Support 1 (S1) = (2 * PP) - High**
                        - **Resistance 1 (R1) = (2 * PP) - Low**
                        - Aur isi tarah aage ke levels bhi calculate kiye jate hain.

                        4. **Trading Signals**
                        - Agar price pivot point ko cross karti hai, to yeh ek potential trading signal ho sakta hai. Agar price pivot point se upar move karti hai, to yeh bullish signal hota hai, jabke neeche move karna bearish signal hota hai.

                        5. **Time Frames**
                        - Pivot points har time frame ke liye calculate kiye ja sakte hain, lekin daily pivot points sab se zyada popular hain. Traders apne preferred time frame ke hisab se pivot points ko use karte hain.

                        6. **Market Volatility**
                        - Pivot points market volatility ke dauran bhi useful hote hain. Jab market mein high volatility hoti hai, to pivot points traders ko important levels par focus karne mein madad karte hain.

                        7. **Complementing Other Tools**
                        - Pivot points ko dusre technical analysis tools ke sath combine karna bhi effective hai. Jaise, moving averages, RSI, ya MACD ka istemal kar ke traders apne decisions ko aur confirm kar sakte hain.

                        8. **Market Psychology**
                        - Pivot points traders ki psychology ko bhi samajhne mein madad karte hain. Jab zyada traders kisi specific level par expect karte hain, to price movements us level ke ird gird hone lagte hain, jo support ya resistance ban jata hai.

                        9. **Backtesting**
                        - Pivot points ki effectiveness ko samajhne ke liye backtesting zaroori hai. Traders apne historical data par pivot points ka istemal karke unki reliability ko test kar sakte hain.

                        10. **Limitations**
                        - Har tool ki tarah, pivot points ki bhi limitations hain. Market ki dynamics kabhi kabhi pivot levels ko break kar sakti hain. Isliye, traders ko hamesha dusre factors ko bhi madde nazar rakhna chahiye.

                        11. **Risk Management**
                        - Pivot points ka istemal karte waqt risk management zaroori hai. Stop loss aur take profit levels ko pivot points ke aas paas set karna trading decisions ko safeguard kar sakta hai.

                        12. **Conclusion**
                        - Forex trading mein pivot points ek important tool hain jo traders ko potential reversal points aur support/resistance levels identify karne mein madad karte hain. Inka sahi istemal karke traders profitable trades execute kar sakte hain. Proper analysis aur risk management ke sath, pivot points ko apne trading strategy mein shamil karna chahiye.
                        • #13 Collapse

                          **Pivot Point Forex Mein Kya Hai? - Aik Mukammal Rehnuma**
                          Forex trading duniya bhar mein ek mashhoor aur lucrative business ban chuka hai. Is mein musalsal price movement ko samajhna buhat zaroori hai. Forex traders aksar pivot points ka istemal karte hain taake trading decisions ko behter banaya ja sake. Iss article mein hum pivot points ke bare mein tafseel se jaan'nay ki koshish karain gay aur dekhein gay ke yeh kis tarah se forex trading mein madadgar hotay hain.

                          ### 1. **Pivot Point Kya Hai?**

                          Pivot point aik technical analysis indicator hai jo price action ko samajhne ke liye istamaal hota hai. Yeh ek central point hai jahan se market ki direction ka andaza lagaya ja sakta hai. Agar price pivot point ke upar ho to market bullish hoti hai, aur agar neeche ho to market bearish hoti hai. Pivot points traders ko market ke important levels jaise support aur resistance ko identify karne mein madad deti hain.

                          ### 2. **Pivot Points Ka Calculation Formula**

                          Pivot point calculate karna ziada mushkil nahi hai. Iska formula kuch yun hai: (High + Low + Close) / 3. Is se pivot point ka central price milta hai jo market ki potential movement ko track karne mein madadgar hota hai. Support aur resistance points ko calculate karne ke liye, pivot point ke calculation ko aage badhaya jata hai.

                          ### 3. **Support Aur Resistance Levels**

                          Pivot points ke zariye traders support aur resistance levels ko pehchaan sakte hain. Yeh levels un price points ko represent karte hain jahan se price ka bounce ya break hona expected hota hai. Support levels wo points hain jahan price gir kar rukne ka imkaan hota hai, jab ke resistance levels wo points hain jahan se price upar ja kar rukne ka imkaan hota hai.

                          ### 4. **Pivot Points Trading Mein Kyu Zaroori Hain?**

                          Pivot points trading ke liye iss liye zaroori hain kyun ke yeh ek simple aur asaan tareeqa hai price movement ko samajhne ka. Har trader ke liye yeh bohot zaroori hota hai ke woh support aur resistance ko pehchan sake, aur pivot points is ka asaan tareeqa faraham karte hain. Iss ke zariye market ki direction aur reversal points ka behtareen andaaza lagaya ja sakta hai.

                          ### 5. **Pivot Point Ka Faida Kaise Hota Hai?**

                          Pivot points ka sabse bara faida yeh hai ke yeh traders ko market ki clear image faraham karte hain. Agar price pivot point se ooper ho, to yeh indicate karta hai ke market mein bullish trend hai aur traders buying ke liye tayar ho sakte hain. Wohi agar price neeche ho to bearish trend ka signal milta hai aur selling ka socha ja sakta hai.

                          ### 6. **Pivot Points Ka Istemaal Kaise Karein?**

                          Pivot points ka istemal karna bilkul asaan hai. Aapko bas pivot point ko calculate karna hota hai aur uske mutabiq support aur resistance levels ko track karna hota hai. Jab price in levels ko hit karti hai, to aapko yeh samajhne mein madad milti hai ke market kis direction mein move karne wali hai.

                          ### 7. **Daily Pivot Points Kya Hain?**

                          Daily pivot points wo points hain jo har trading day ke liye nikalay jate hain. Har din ka high, low, aur close price pivot points ko nikalne mein madadgar hota hai. Daily pivot points se traders ko short-term market movement ko samajhne ka moka milta hai. Yeh day traders ke liye buhat hi faidemand hotay hain jo daily price fluctuations pe kaam karte hain.

                          ### 8. **Pivot Points Aur Fibonacci Retracement**

                          Pivot points aur Fibonacci retracement dono technical analysis ke tools hain lekin unka istamaal thora mukhtalif hota hai. Pivot points price ke fixed levels ko indicate karte hain jab ke Fibonacci retracement historical price points ke base pe levels ko predict karta hai. Dono tools ka mix istamaal traders ko zyada accurate predictions karne mein madad deta hai.

                          ### 9. **Pivot Points Ka Long-Term Trading Mein Kirdar**

                          Aksar traders sirf short-term trading ke liye pivot points ka istemal karte hain, magar yeh long-term trading ke liye bhi kafi useful hain. Weekly ya monthly pivot points ke zariye aap bade price moves ko predict kar sakte hain aur long-term positions ko manage kar sakte hain.

                          ### 10. **Pivot Points Aur Risk Management**

                          Risk management trading ka ek bohot ahem hissa hai, aur pivot points isme madadgar sabit hotay hain. Agar aapko market ke support aur resistance levels ka pata ho, to aap apne stop-loss aur take-profit levels ko behtareen tareeqa se set kar sakte hain. Yeh strategy aapko unnecessary losses se bachati hai.

                          ### 11. **Pivot Points Indicators Tools**

                          Aaj kal ke trading platforms par aapko mukhtalif pivot points indicators milte hain jo automatically support aur resistance levels ko calculate kar dete hain. Yeh tools aapke liye analysis ko asaan banate hain aur real-time market trends ka andaza lagane mein madad karte hain.

                          ### 12. **Pivot Points Ka Comparison Doosre Indicators Se**

                          Doosre technical indicators jaise ke moving averages ya Bollinger Bands se compare karein to pivot points asaani se samajh mein aa jate hain. Yeh ek simple tool hai jo trading decisions ko rapidly enhance kar sakta hai. Lekin yeh yaad rakhein ke pivot points akelay koi magic formula nahi hain. Unka istemal doosre indicators ke sath combine karna zaroori hai.

                          ### 13. **Pivot Points Aur Scalping Strategy**

                          Scalpers ke liye pivot points buhat useful hain kyunki yeh short-term price movements ko target karte hain. Scalpers aksar pivot point ke qareeb buy ya sell karte hain aur jab price support ya resistance hit karti hai to apne positions ko close kar lete hain.

                          ### 14. **Kya Pivot Points Har Market Mein Kaam Karte Hain?**

                          Pivot points na sirf forex market mein balkay stocks, commodities aur cryptocurrencies mein bhi kaam karte hain. Inka principle har market pe asar daal sakta hai kyunki price movements ke patterns har jagah lagbhag ek jaise hote hain.

                          ### **Conclusion**

                          Pivot points forex trading mein aik zabardast tool hai jo market ke movements ko samajhne mein madad karta hai. Yeh traders ko support aur resistance levels ko identify karne, trend ko predict karne, aur risk management mein madad dete hain. Iska seedha aur asaan formula har trader ko advanced tools ke baghair bhi market ki direction ka andaaza lagane ki sahulat faraham karta hai. Lekin, pivot points ko hamesha doosre technical indicators ke sath milakar use karna zaroori hota hai taake trading decisions zyada accurate aur profitable ho sakain.
                           
                          • #14 Collapse

                            ### Pivot Point Kya Hai Forex Mein?
                            Pivot Point ek important technical analysis tool hai jo traders ko market ke potential support aur resistance levels ko samajhne mein madad karta hai. Yeh ek mathematical calculation par mabni hota hai jo price action ko analyze karne ke liye istemal kiya jata hai, khaaskar forex market mein. Pivot Points ka istemal karte hue traders ko market ki direction aur potential reversal points ka andaza lagana asaan hota hai.

                            Pivot Point ko calculate karne ka tariqa bohot aasan hai. Isay aam tor par previous day ki high, low, aur close prices ko istemal karte hue calculate kiya jata hai. Formula kuch is tarah hai:

                            **Pivot Point (PP) = (High + Low + Close) / 3**

                            Is calculation se jo value milti hai, wo central pivot point hoti hai. Yeh central level market ki bullish ya bearish momentum ko darshata hai. Agar price is level ke upar trade kar rahi hai, to yeh bullish sentiment ka indication hai, jabke agar price is level ke neeche hai, to yeh bearish sentiment ko darshata hai.

                            Is central pivot point ke alawa, traders additional support aur resistance levels bhi calculate karte hain. In levels ko calculate karne ke liye aam tor par ye formulas istemal kiye jate hain:

                            - **Resistance 1 (R1) = (2 x PP) - Low**
                            - **Resistance 2 (R2) = PP + (High - Low)**
                            - **Support 1 (S1) = (2 x PP) - High**
                            - **Support 2 (S2) = PP - (High - Low)**

                            Yeh support aur resistance levels market ki potential reversal points ko darshate hain. Jab price kisi resistance level tak pahunchti hai, to traders ko sell position lene par ghoor karna chahiye, jabke support level par buying opportunities dekhi ja sakti hain.

                            Pivot Points ka istemal traders ke liye isliye bhi faida mand hai kyunki yeh ek simple aur effective tareeqa hai market ki direction ko samajhne ka. Yeh tool chhote time frames, jaise 1-minute ya 15-minute charts par bhi istemal kiya ja sakta hai, jo scalpers aur day traders ke liye khaas tor par useful hai.

                            Aakhir mein, Pivot Points forex trading mein ek valuable tool hain jo market ki movements ko samajhne mein madad karte hain. Agar aap trading mein naye hain ya apni strategy ko enhance karna chahte hain, to Pivot Points ko apne analysis mein shamil karna ek acha option ho sakta hai. Isay sahi tareeqe se istemal karke aap market ke trends aur potential reversal points ko behtar samajh sakte hain.
                            • <a href="https://www.instaforex.org/ru/?x=ruforum">InstaForex</a>
                            • #15 Collapse

                              Forex Mein Pivot Point Kya Hai?


                              Forex trading mein pivot point aik aham concept hai jo traders ko market ke potential support aur resistance levels ko samajhne mein madad karta hai. Is maqalay mein hum pivot point ki definition, uski importance, calculation ka tareeqa, aur isay kaise istemal kiya jata hai, ka jaiza lenge.
                              1. Pivot Point Ki Tareef


                              Pivot point aik technical indicator hai jo kisi bhi financial asset ki price movement ko samajhne ke liye istemal hota hai, khaaskar forex market mein. Ye market ki khud ki price action ke basis par support aur resistance levels tay karta hai. Jab trader kisi currency pair ki trading karta hai, to wo pivot points ko dekh kar ye andaza laga sakta hai ke market kis taraf ja sakta hai—upar ya neeche.
                              2. Pivot Point Ki Ahmiyat


                              Pivot points ki importance unki ability mein hai ke ye traders ko market ke trend ko pehchanne mein madad dete hain. Ye na sirf short-term trading mein balke long-term trading mein bhi kaam aate hain. Agar kisi currency ki price pivot point se upar hai, to ye bullish signal hota hai, jabke neeche hone par bearish signal hota hai. Is tarah se traders isay market ki overall direction samajhne ke liye istemal karte hain.
                              3. Pivot Point Kaise Calculate Kiya Jata Hai


                              Pivot point ko calculate karne ke liye traders aksar previous day's high, low, aur close prices ka istemal karte hain. Yahan aik simple formula diya gaya hai:

                              Pivot Point (PP) = (High + Low + Close) / 3

                              Is formula ke zariye, traders pivot point ka aik central level nikaalte hain. Iske ilawa, pivot points ke support aur resistance levels nikaalne ka formula ye hai:
                              • Support 1 (S1) = (2 * PP) - High
                              • Support 2 (S2) = PP - (High - Low)
                              • Resistance 1 (R1) = (2 * PP) - Low
                              • Resistance 2 (R2) = PP + (High - Low)

                              Is tareeqe se traders easily apne pivot points aur unke support aur resistance levels ko calculate kar sakte hain.
                              4. Pivot Points Ka Istemal Kaise Kiya Jata Hai


                              Pivot points ka istemal karne ka aik tareeqa hai technical analysis ke liye charts par inhe plot karna. Jab traders market ke price action ko dekhte hain, to wo pivot points ke around price ke behaviour ko analyse karte hain. Agar price pivot point se upar ya neeche move karti hai, to is se traders ko buy ya sell karne ka signal milta hai.
                              Example:


                              Agar kisi trader ka pivot point 1.2000 hai aur price 1.2050 tak pahunchti hai, to ye bullish signal hai, jo trader ko ye suggest karta hai ke price aage chal kar aur bhi upar ja sakti hai. Iske alawa, agar price pivot point 1.2000 se neeche chali jati hai, to ye bearish signal hota hai, jo trader ko short selling ki taraf motivate karta hai.
                              5. Pivot Points Aur Market Psychology


                              Pivot points sirf technical analysis ka hissa nahi hain, balke ye market psychology ko bhi samajhne mein madad karte hain. Jab traders dekhtay hain ke market pivot point ke aas paas kaise react karti hai, to wo isay ek psychological level samajhte hain. Ye level market participants ke liye significant hote hain, kyunki inhe aksar support ya resistance ki tarah dekha jata hai.
                              Example:


                              Agar ek currency pair ne kisi din pivot point ko cross kiya, to ye market mein momentum ko badha sakta hai. Ye traders ke liye ek strong signal hota hai ke market ne direction change kiya hai. Is tarah se pivot points market ke behavior aur trader sentiment ko analyze karne mein madadgar hote hain.
                              6. Pivot Points Ka Aam Istemal


                              Pivot points ka aam istemal trading strategies mein hota hai, jahan traders inhe apne risk management plans ke liye bhi istemal karte hain. Support aur resistance levels ko samajhne se traders ko stop-loss orders ko set karne mein madad milti hai, taake wo market ki volatility se bach sakein.
                              Conclusion


                              Forex trading mein pivot points aik crucial tool hain jo traders ko market ki movement ko samajhne aur analyze karne mein madad karte hain. Inka istemal market ke potential reversal points ko identify karne, risk management, aur trading decisions lene mein hota hai. Agar aap trading mein serious hain, to pivot points ko apni strategy ka hissa banana aapke liye faydemand ho sakta hai.

                              Is article mein humne dekha ke pivot point kya hai, iski ahmiyat, calculation ka tareeqa, aur istemal kaise kiya jata hai. Aakhir mein, ye kehna galat nahi hoga ke pivot points forex market mein trading ke liye ek must-have tool hain, jo na sirf technical analysis balke market psychology ko samajhne mein bhi madadgar sabit hotay hain.

                              اب آن لائن

                              Working...
                              X