Cup and Handle Pattern:
No announcement yet.
X
  • وقت
  • دکھائیں
Clear All
new posts
  • #1 Collapse

    Cup and Handle Pattern:
    **Cup and Handle Pattern: Ek Detailed Overview**
    Click image for larger version

Name:	download (50).png
Views:	17
Size:	5.0 کلوبائٹ
ID:	13110513
    **Definition:**
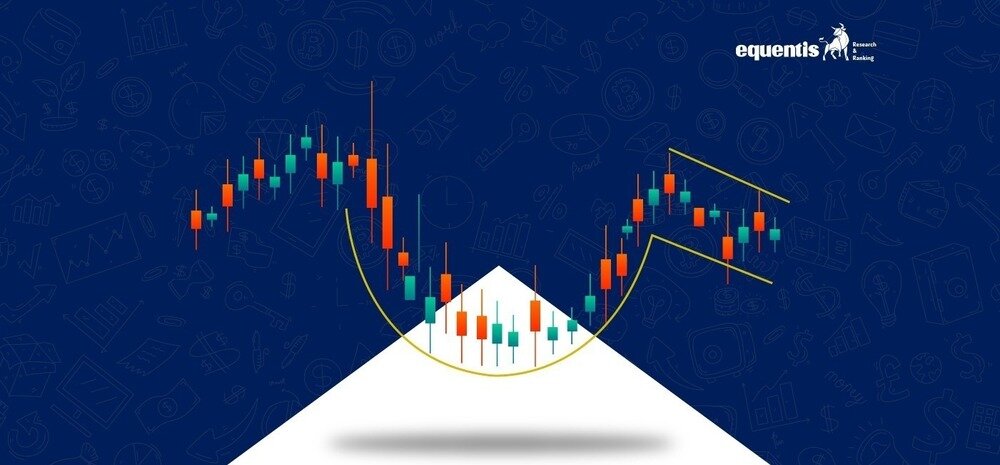
    Cup and Handle Pattern ek technical analysis chart pattern hai jo bullish continuation signal ke liye jaana jata hai. Yeh pattern price chart par ek cup aur handle ke form mein develop hota hai aur aksar long-term uptrends ko continue karne ka indication hota hai.

    **Pattern Structure:**

    1. **Cup Formation:**
    - **Shape:** Cup ka shape U-shaped hota hai, jo ek rounded bottom ke saath hota hai. Isme price pehle girti hai, phir gradually recover karti hai aur ek rounded bottom create karti hai.
    - **Duration:** Cup formation ke liye kuch weeks ya months lag sakte hain. Is pattern ka duration trend aur market conditions ke hisaab se vary kar sakta hai.

    2. **Handle Formation:**
    - **Shape:** Handle ek small consolidation phase hota hai jo cup ke right side ke upar develop hota hai. Yeh usually ek flag, pennant, ya rectangular consolidation hota hai.
    - **Duration:** Handle formation cup ke completion ke baad hota hai aur yeh kuch days ya weeks tak chal sakta hai.

    **Volume Analysis:**

    - **Cup Phase:** Volume generally high hota hai jab cup ban raha hota hai aur phir gradually decrease hota hai jab price cup ke bottom se recover hoti hai.
    - **Handle Phase:** Volume handle formation ke dauran low ya moderate hota hai, jo consolidation aur market indecision ko indicate karta hai.

    **Trading Interpretation aur Strategy:**

    1. **Bullish Continuation Signal:**
    - Cup and Handle Pattern ka formation bullish trend continuation ka signal hota hai. Jab handle complete ho jata hai aur price handle ke upper boundary (resistance level) ko breakout karti hai, tab yeh bullish trend ka confirmation hota hai.

    2. **Entry aur Exit Points:**
    - **Entry Point:** Ideal entry point tab hota hai jab price handle ke upper boundary (resistance level) ko breakout karti hai.
    - **Stop-Loss:** Stop-loss ko handle ke neeche rakha jata hai, jo potential losses ko manage karne mein madad karta hai.
    - **Profit Target:** Profit target ko cup ke depth ke equivalent set kiya jata hai, jo pattern ke completion ke baad price movement ko estimate karta hai.

    **Trading Strategy:**

    1. **Confirmation Indicators:**
    - Cup and Handle Pattern ke signals ko confirm karne ke liye doosre technical indicators ka use kiya jata hai, jaise moving averages, relative strength index (RSI), ya volume analysis. Confirmatory signals pattern ke effectiveness ko enhance karte hain.

    2. **Risk Management:**
    - Risk management strategies ko implement karna zaroori hota hai, jaise stop-loss aur take-profit levels, taaki trading risks ko control kiya ja sake.

    **Conclusion:**
    Cup and Handle Pattern ek powerful tool hai jo bullish trends ke continuation ko identify karne mein madad karta hai. Yeh pattern ko market context aur additional technical indicators ke saath analyze karke trading decisions ko zyada effective aur informed banaya ja sakta hai.
  • <a href="https://www.instaforex.org/ru/?x=ruforum">InstaForex</a>
  • #2 Collapse


    Click image for larger version

Name:	images (16).png
Views:	23
Size:	5.0 کلوبائٹ
ID:	13110528
    **Introduction:**
    The Cup and Handle Pattern ek technical analysis ka renowned chart pattern hai, jo bullish continuation ke signals ke liye widely recognized hai. Yeh pattern price chart par ek distinctive cup aur handle ke shape mein nazar aata hai, aur aksar market ke long-term uptrends ko reinforce karta hai, indicating ke trend agay barhne wala hai.

    **Pattern Composition:**

    1. **Cup Formation:**
    - **Shape:** Cup ka structure ek smooth, rounded U-shape ka hota hai, jisme price pehle downward move karti hai, phir dheere dheere recover hoti hai, aur ek rounded bottom create hota hai. Is pattern mein bottom kaafi deep aur stable hota hai, jo recovery ke dauran gradually upward turn leta hai.
    - **Duration:** Cup formation mein kuch weeks se lekar kayi mahine lag sakte hain, depending on market dynamics. Iska duration market ke trend aur volatility ke hisaab se vary karta hai.

    2. **Handle Formation:**
    - **Shape:** Handle, jo cup ke right side par develop hota hai, ek brief consolidation phase hota hai. Yeh phase aksar ek flag, pennant, ya rectangular consolidation ka form leta hai, jo cup ke top ke pass hota hai.
    - **Duration:** Handle formation tab hota hai jab cup complete ho chuka hota hai, aur yeh kuch dinon se lekar kayi hafton tak chal sakta hai, depending on market condition.

    **Volume Dynamics:**

    - **During the Cup:** Cup ke formation ke doran, volume kaafi high rehta hai jab initial price decline hoti hai, lekin jaise-jaise price bottom ke pass stabilize hoti hai aur recover karna shuru karti hai, volume gradually kam hota jata hai.
    - **During the Handle:** Handle ke formation ke waqt, volume aksar low ya moderate hota hai, jo market mein consolidation aur temporary indecision ko reflect karta hai.

    **Trading Insights and Strategy:**

    1. **Bullish Continuation Signal:**
    - Cup and Handle Pattern ka formation ek strong bullish trend continuation ka indication hota hai. Jab handle complete hota hai aur price handle ke upper boundary ya resistance level ko breakout karti hai, yeh ek confirmatory signal hota hai ke bullish trend ab agay barhne wala hai.

    2. **Entry and Exit Strategies:**
    - **Entry Point:** Ideal entry point tab hota hai jab price handle ke resistance level ko breakout karti hai, jo bullish momentum ke resurgence ka sign hota hai.
    - **Stop-Loss Placement:** Stop-loss order ko handle ke neeche position karna recommended hota hai, jo potential losses ko limit karne mein madad karta hai agar trade unfavorable direction mein jaye.
    - **Profit Targeting:** Profit target ko cup ke depth ke barabar rakha jata hai, jo expected price movement ko pattern ke completion ke baad forecast karta hai.

    **Advanced Trading Strategies:**

    1. **Using Confirmation Tools:**
    - Cup and Handle Pattern ke signals ko confirm karne ke liye, traders aksar additional technical tools ka use karte hain, jaise moving averages, relative strength index (RSI), aur detailed volume analysis. Yeh confirmatory indicators pattern ke reliability aur effectiveness ko boost karte hain.

    2. **Implementing Risk Management:**
    - Trading mein risk management ko prioritize karna critical hota hai. Yeh strategies include karti hain precise stop-loss aur take-profit levels ko define karna, taake market ki unpredictability ko tackle kiya ja sake aur potential losses ko minimize kiya ja sake.

    **Conclusion:**
    Cup and Handle Pattern ek influential chart pattern hai jo bullish trend ke continuation ko identify karne ke liye kaafi effective hai. Yeh pattern tab aur bhi zyada impactful ho jata hai jab ise broader market context aur supplementary technical indicators ke sath analyze kiya jata hai, jisse trading decisions aur bhi informed aur strategic ban jati hain. Is pattern ka samajh aur sahi tarah se implement karna, traders ko long-term bullish trends ko capitalize karne mein madad deta hai.
    • #3 Collapse

      Cup and Handle Pattern: Ek Comprehensive Guide

      1. Cup and Handle Pattern Ka Taaruf

      Cup and Handle pattern aik popular technical analysis tool hai jo trading aur investing mein use hota hai. Is pattern ko stock market aur financial markets ke technical analysis mein aik crucial element mana jata hai. Yeh pattern khas taur par bullish trend ko identify karne ke liye use hota hai aur market ke future price movements ko predict karne mein madad karta hai. Cup and Handle pattern ka naam iski distinct shape ke wajah se pada hai, jo aik cup aur aik handle ki tarah nazar aata hai. Yeh pattern technical analysis ke tools mein aik valuable addition hai jo investors aur traders ko market trends aur price movements ko samajhne mein help karta hai.

      Is pattern ko samajhne ke liye pehle iski basic structure ko understand karna zaroori hai. Cup and Handle pattern ki pehchaan tab hoti hai jab aik cup ka shape banta hai aur phir uske upar aik handle ban jata hai. Cup ki shape aik rounded bottom ke sath hoti hai, jabke handle ka shape aik consolidation phase ko dikhata hai. Is pattern ke formation ke doran, market price pehle girti hai, phir dheere dheere recover karti hai aur finally aik handle banati hai jo consolidation ko represent karta hai.

      Technical analysts is pattern ko identify karne ke liye specific criteria ko follow karte hain. Cup and Handle pattern ka use karte waqt, traders ko iske formation ka accurate observation zaroori hota hai taake woh sahi time pe trading decisions le sakein. Pattern ka accurate identification trading strategy ko successful banane mein help karta hai aur risk management ko bhi improve karta hai. Isliye, traders ko is pattern ki understanding aur application pe focus karna chahiye.

      2. Pattern Ki Pehchaan

      Cup and Handle pattern ko pehchanne ke liye specific visual cues aur characteristics ko dekhna zaroori hai. Is pattern ki pehchaan tab hoti hai jab market price aik rounded bottom banaati hai jo cup ke shape ka hissa hota hai. Cup ka shape generally ek smooth aur gradual decline aur rise ko represent karta hai. Yeh decline aur rise aik cup ki tarah rounded aur symmetrical hoti hai, jo market ke consolidation phase ko dikhata hai. Cup ki formation typically 7 se 65 din ke doran hoti hai aur iska shape market ki stability aur steady movements ko reflect karta hai.

      Handle ke formation ke doran, cup ke upper portion ke sath aik handle form hoti hai jo aik consolidation phase ko dikhata hai. Handle ka shape generally rectangular ya triangular hota hai aur yeh pattern ke completion ka indication hota hai. Handle ke formation ke doran volume usually decrease hota hai, jo market ke stability aur consolidation ko show karta hai. Handle ka duration aam taur par 1 se 4 weeks ke doran hota hai aur iska shape aur size pattern ke accuracy ko determine karta hai.

      Cup and Handle pattern ko accurately pehchaanne ke liye traders ko pattern ke formation aur price movement ko closely observe karna hota hai. Yeh observation traders ko sahi trading decisions lene mein help karti hai aur market trends ko accurately predict karne mein madad deti hai. Isliye, pattern ki pehchaan aur analysis ko trading strategy ka part banana zaroori hai.

      3. Cup Ka Formation

      Cup ki formation Cup and Handle pattern ka aik essential element hai. Cup ka shape aik rounded bottom ke sath hota hai jo market price ke gradual decline aur rise ko show karta hai. Is pattern ki formation tab hoti hai jab market price pehle girti hai, phir ek bottom point tak pahunchti hai aur finally dheere dheere rise karti hai. Cup ka shape market ki stability aur consolidation ko represent karta hai, aur iska gradual decline aur rise pattern ki accuracy ko confirm karta hai.

      Cup ki formation ke doran, market price pehle high se low tak girti hai aur phir dheere dheere upar chadhai karti hai. Yeh smooth aur rounded bottom ka shape cup ki pehchaan ko define karta hai. Cup ki duration aam taur par 7 se 65 din ke beech hoti hai, aur iska shape aur size market ke consolidation phase ko dikhata hai. Cup ki formation ka time frame market trends aur price movements ko accurately predict karne mein madad karta hai.

      Cup ki formation ke doran volume bhi important role play karta hai. Volume ke changes cup ke formation ke validity ko confirm karte hain. Jab cup banta hai, volume usually decrease hota hai aur phir handle ke formation ke doran volume increase hota hai. Yeh volume changes pattern ke authenticity aur reliability ko assess karte hain. Isliye, cup ki formation aur volume changes ka observation trading strategy ke success ke liye zaroori hai.

      4. Handle Ka Formation

      Cup ke baad handle ka formation Cup and Handle pattern ka aik important aspect hai. Handle ka shape generally rectangular ya triangular hota hai aur yeh pattern ke completion ko represent karta hai. Handle ki formation tab hoti hai jab market price cup ke upper portion ke sath consolidate hoti hai. Handle ke formation ke doran, price range usually narrow hoti hai aur consolidation phase ko dikhata hai. Handle ke duration aam taur par 1 se 4 weeks ke beech hota hai, aur iska shape aur size pattern ke accuracy ko determine karta hai.

      Handle ke formation ke doran, volume bhi ek important factor hota hai. Handle ke shuru hone ke baad volume usually decrease hota hai aur jab handle ke breakout point pe price move karti hai, to volume increase hota hai. Yeh volume changes pattern ke completion aur breakout ke potential ko confirm karte hain. Handle ka formation market ke consolidation aur stability ko reflect karta hai, aur iska accurate observation trading decisions ko improve kar sakta hai.

      Handle ke formation ke doran, price range aur consolidation phase ka analysis pattern ke reliability ko determine karta hai. Handle ke upper resistance level ko break karne ke baad, pattern bullish signal generate karta hai aur future price movements ko predict karta hai. Isliye, handle ke formation aur volume changes ka observation trading strategy ke success ke liye zaroori hai.

      5. Volume Ka Role

      Volume Cup and Handle pattern ka aik crucial aspect hai jo pattern ke validity aur reliability ko determine karta hai. Volume ke changes pattern ke formation aur breakout ke potential ko show karte hain. Cup ki formation ke doran volume usually decrease hota hai, jabke handle ke formation ke doran volume phir se increase hota hai. Yeh volume changes market ki stability aur consolidation ko reflect karte hain aur pattern ke authenticity ko confirm karte hain.

      Cup aur handle ke formation ke doran volume ke analysis se traders ko pattern ki accuracy aur reliability ka pata chal sakta hai. Cup ke formation ke doran volume decrease hota hai, jo market ke consolidation aur stability ko show karta hai. Handle ke formation ke doran, volume ka increase pattern ke breakout ke potential ko indicate karta hai. Volume ke changes pattern ke authenticity aur trading signals ko confirm karte hain aur market trends ko accurately predict karne mein madad karte hain.

      Volume analysis Cup and Handle pattern ke trading strategy ka ek important part hai. Traders volume ke changes ko closely monitor karte hain aur pattern ke formation aur breakout ke potential ko assess karte hain. Isliye, volume ka accurate analysis trading decisions aur risk management ke liye zaroori hai.

      6. Pattern Ka Breakout

      Cup and Handle pattern tab complete hota hai jab price handle ke upper resistance level ko break karti hai. Is moment ko "breakout" kehte hain aur yeh bullish signal hota hai jo future price movements ko indicate karta hai. Breakout ke doran volume usually high hota hai, jo pattern ke completion aur market ke bullish trend ko confirm karta hai. Breakout ke point pe price ka movement pattern ke accuracy aur trading signal ki validity ko determine karta hai.

      Breakout ke doran price ka movement handle ke upper resistance level se upar chala jata hai, aur yeh market ke bullish trend ko represent karta hai. Is point pe traders pattern ke signals ko consider karte hain aur trading decisions lete hain. Breakout ke baad price ka movement pattern ko follow karna aur volume ke changes ko monitor karna zaroori hota hai.

      Breakout ke baad, price ka target price calculate karne ke liye cup ki depth ko handle ke breakout level se add kiya jata hai. Yeh calculation future price movements ke expectations ko determine karti hai aur trading strategy ko successful banane mein madad karti hai. Isliye, breakout ke point aur target price calculation ka accurate analysis trading decisions ke liye zaroori hai.

      7. Target Price Calculation

      Cup and Handle pattern ke target price calculate karne ke liye, cup ki depth ko handle ke breakout level se add karna hota hai. Target price calculation traders ko future price movements ke expectations ko determine karne mein madad karti hai aur trading strategy ko successful banane mein help karti hai. Cup ki depth aur handle ke breakout level ka accurate measurement target price ke calculation ke liye zaroori hai.

      Cup ki depth ko handle ke breakout level se add karne se target price ka estimation hota hai jo future price movements ko predict karta hai. Target price calculation market trends aur price movements ko accurately assess karne mein madad karti hai aur trading decisions ko improve karti hai. Isliye, target price calculation ka accurate analysis trading strategy ke success ke liye zaroori hai.

      Traders target price ko set karne ke liye cup ki depth aur handle ke breakout level ke measurement ko closely monitor karte hain. Yeh calculation future price movements ke expectations ko determine karti hai aur market trends ko accurately predict karne mein help karti hai. Target price calculation ka accurate observation trading decisions aur risk management ko improve karne mein madad karta hai.

      8. Risk Management

      Cup and Handle pattern ko use karte waqt risk management zaroori hai taake agar market expected direction mein na chale to losses ko control kiya ja sake. Risk management strategies pattern ke analysis aur trading decisions ke liye zaroori hai. Handle ke neechay aik stop-loss level set karna chahiye jo potential losses ko control karta hai aur trading strategy ko protect karta hai.

      Stop-loss level handle ke low point ke neechay set kiya jata hai taake agar market price handle ke neechay girti hai to losses ko minimize kiya ja sake. Risk management ke liye proper stop-loss level aur position sizing ka use zaroori hai. Yeh strategies trading decisions aur risk management ko improve karti hain aur trading strategy ko successful banane mein help karti hain.

      Risk management ke strategies trading ke potential risks ko identify karne aur control karne mein madad karti hain. Isliye, traders ko risk management ke principles ko samajhna aur unka accurate implementation zaroori hai. Cup and Handle pattern ke analysis aur trading decisions ke liye risk management strategies ka use trading success ko enhance karne mein madad karti hai.

      9. Trading Strategies

      Cup and Handle pattern ko trade karne ke liye specific strategies develop karna zaroori hai. Trading strategies pattern ke analysis aur trading decisions ke liye zaroori hoti hain. Traders pattern ke breakout point ko buy signal ke taur pe use karte hain aur handle ke low point ko stop-loss ke taur pe set karte hain. Yeh strategies trading decisions aur risk management ko improve karti hain aur trading success ko enhance karti hain.

      Trading strategies ke development ke liye pattern ke formation aur volume changes ka accurate observation zaroori hai. Cup and Handle pattern ke trading strategies ko develop karne ke liye market trends aur price movements ko closely monitor karna hota hai. Isliye, traders ko trading strategies ke principles aur techniques ko samajhna aur unka accurate application zaroori hai.

      Traders trading strategies ko pattern ke analysis aur market trends ke observation ke sath develop karte hain. Yeh strategies trading decisions ko improve karne aur trading success ko enhance karne mein madad karti hain. Cup and Handle pattern ke trading strategies ko accurately implement karne ke liye proper analysis aur observation zaroori hai.

      10. Common Mistakes

      Cup and Handle pattern ko use karte waqt kuch common mistakes hoti hain jo trading decisions ko affect kar sakti hain. In mistakes ko avoid karna zaroori hai taake trading strategy successful ho aur losses ko minimize kiya ja sake. Common mistakes mein pattern ko incomplete dekhna, volume changes ko ignore karna, aur trading signals ko accurately identify na karna shamil hai.

      Pattern ko incomplete dekhne se trading decisions aur pattern ke analysis mein errors aa sakte hain. Volume changes ko ignore karne se pattern ke authenticity aur reliability ko assess karna mushkil hota hai. Trading signals ko accurately identify na karne se market trends ko predict karna difficult hota hai. In mistakes ko avoid karne ke liye accurate observation aur analysis zaroori hai.

      Traders ko common mistakes ko identify karna aur unse bachne ke liye pattern ke formation aur volume changes ko closely monitor karna chahiye. Yeh mistakes trading strategy ke success ko affect kar sakti hain aur trading decisions ko improve karne ke liye careful analysis aur observation zaroori hai.

      11. Pattern Ki Limitations

      Har technical pattern ki tarah, Cup and Handle pattern bhi limitations rakhta hai. Yeh pattern market ke short-term movements ko predict karta hai lekin long-term trends ko accurately predict nahi kar sakta. Pattern ki limitations ko samajhna zaroori hai taake trading decisions aur risk management ko effectively manage kiya ja sake.

      Cup and Handle pattern short-term trends aur price movements ko accurately predict karta hai lekin long-term trends ko predict karne mein limitations hoti hain. Pattern ke limitations ko consider karte hue trading decisions aur risk management strategies ko develop karna zaroori hai. Isliye, traders ko pattern ke limitations aur market trends ke long-term analysis ko samajhna aur incorporate karna chahiye.

      Pattern ke limitations ko understand karne se trading decisions aur risk management ko improve kiya ja sakta hai. Cup and Handle pattern ke short-term movements aur long-term trends ke analysis ko balance karna zaroori hai taake trading strategy ko successful banaya ja sake.

      12. Pattern Ka Historical Data

      Cup and Handle pattern ko analyze karne ke liye historical data ka use zaroori hai. Historical data pattern ke accuracy aur reliability ko determine karne mein madad karta hai aur trading decisions ko improve karta hai. Historical patterns aur trends ko study karke traders pattern ki validity aur potential ko assess kar sakte hain.

      Historical data se traders ko past price movements aur market trends ka analysis milta hai jo pattern ke accuracy ko determine karne mein help karta hai. Cup and Handle pattern ke historical data ka use trading strategy aur risk management ko improve karne mein madad karta hai. Isliye, traders ko historical data aur pattern ke analysis ko consider karna chahiye.

      Historical data ka analysis trading decisions aur risk management strategies ke development mein madad karta hai. Cup and Handle pattern ke historical trends aur patterns ko study karke traders pattern ke potential aur reliability ko assess kar sakte hain.

      13. Practical Applications

      Cup and Handle pattern ka practical application stock trading, forex trading aur cryptocurrency trading mein hota hai. Yeh pattern investors aur traders ko market trends aur price movements ko samajhne mein madad karta hai aur trading decisions ko improve karta hai. Practical applications ke liye pattern ke formation aur volume changes ka accurate observation zaroori hai.

      Stock trading, forex trading aur cryptocurrency trading mein Cup and Handle pattern ka use traders ko market trends aur price movements ko accurately predict karne mein madad karta hai. Pattern ke practical applications ko consider karte hue trading strategies aur risk management ko develop karna zaroori hai.

      Practical applications ke liye pattern ke formation aur volume changes ko closely monitor karna zaroori hai taake trading strategy successful ho aur market trends ko accurately predict kiya ja sake. Isliye, Cup and Handle pattern ke practical applications aur analysis ko trading strategy ka part banana zaroori hai.

      14. Conclusion

      Cup and Handle pattern aik useful tool hai jo technical analysis mein market trends ko identify karne aur trading decisions lene mein madad karta hai. Is pattern ko samajhna aur uski proper application traders ko successful trading strategies develop karne mein madadgar sabit ho sakta hai. Pattern ke formation, volume changes aur trading signals ko accurately analyze karna zaroori hai taake trading strategy successful ho aur market trends ko accurately predict kiya ja sake.

      Cup and Handle pattern ki understanding aur application trading strategy ko enhance karti hai aur risk management ko improve karti hai. Pattern ke analysis aur trading decisions ko accurately implement karne se trading success ko achieve kiya ja sakta hai. Isliye, traders ko Cup and Handle pattern ke principles, formation aur practical applications ko samajhna aur unka accurate implementation zaroori hai.
      • #4 Collapse

        Cup and Handle Pattern: Forex Trading Mein Istemaal

        1. Cup and Handle Pattern Kya Hai?

        Cup and Handle Pattern ek popular technical analysis pattern hai jo price charts par dikhayi deta hai. Yeh pattern, jaise ke naam se hi zahir hai, cup aur handle ke do parts par consist karta hai. Cup aur handle pattern aksar bullish trend ki indication hota hai, jisme cup ka formation ek rounded bottom ko dikhata hai aur handle chhoti consolidation phase ko represent karta hai jo cup ke baad aati hai.

        Is pattern ka origin stock market se hai, lekin ab yeh forex aur other financial markets mein bhi use hota hai. Cup aur handle pattern traders ko future price movements ke bare mein forecasts banane mein madad karta hai. Yeh pattern jab price chart par nazar aata hai, toh yeh traders ke liye potential buying opportunities ko identify karne ka ek tool ban jata hai.

        Cup aur handle pattern ki validity ko samajhna zaroori hai, kyunke har pattern same way se work nahi karta. Yeh pattern typically long-term bullish trends ko indicate karta hai, lekin iska short-term performance bhi market conditions par depend karta hai. Cup aur handle pattern ka successful trading strategy ke liye accurate identification aur confirmation zaroori hai.

        Is pattern ki effectiveness ko improve karne ke liye, traders ko iske formation phases ko sahi tarah se samajhna chahiye. Cup aur handle pattern ko accurately identify karna aur uski confirmation signal ko observe karna zaroori hai. Aksar, is pattern ke saath additional technical indicators bhi use kiye jate hain taake trading decisions ko enhance kiya ja sake.

        Cup aur handle pattern ka ek key characteristic yeh hai ke yeh pattern price action ke gradual changes ko reflect karta hai. Yeh pattern traders ko price ke movement ke long-term trends ke baare mein insight provide karta hai. Is pattern ko sahi se samajhkar aur analyze karke, traders better trading decisions le sakte hain.

        2. Cup Aur Handle Ka Formation

        Cup aur handle ka formation price chart par ek distinct shape ke roop mein dikhayi deta hai. Cup ka formation ek rounded bottom ke sath hota hai, jab ke handle ek chhoti consolidation phase hoti hai jo cup ke completion ke baad aati hai. Cup ka shape typically U-shaped hota hai, jisme price ek gradual decline aur phir gradual rise dikhati hai.

        Cup formation ke dauran, price pehle ek peak banati hai, phir decline karti hai aur fir se rise karti hai. Yeh U-shape price ke gradual recovery aur stability ko show karta hai. Cup ke formation ke duration ka bhi role hota hai, kyunki longer cup formations zyada reliable signal provide karte hain.

        Handle formation ke dauran, price ek consolidation phase se guzarti hai, jo cup ke high ke thoda niche hoti hai. Yeh consolidation phase chhoti si correction ko dikhati hai jo price ko handle ke formation ke dauran thoda pullback karti hai. Handle ka shape typically flag ya pennant ke jaisa hota hai aur price ke chhote fluctuations ko reflect karta hai.

        Handle ke duration aur depth bhi pattern ki reliability ko affect karte hain. Agar handle zyada lamba ya deep hota hai, toh yeh pattern ki validity ko kam kar sakta hai. Ideal handle formation short aur shallow hota hai, jo price ke strong bullish trend ko confirm karta hai.

        Cup aur handle pattern ke accurate formation ko observe karne ke liye, traders ko price charts ko bariki se dekhna hota hai. Cup aur handle ka shape aur size pattern ke overall success ko determine karta hai. Yeh pattern technical analysis ke tools aur indicators ke saath combine karke use kiya jata hai taake accurate trading signals mil sakein.

        3. Cup Aur Handle Ka Size

        Cup aur handle pattern ke size ka trading strategy par significant impact hota hai. Cup aur handle pattern ka size traders ko pattern ke potential price movement ke baare mein insight provide karta hai. Large cup aur handle patterns zyada reliable signals provide karte hain, lekin chhoti patterns bhi potential trading opportunities ko indicate kar sakti hain.

        Large cup aur handle patterns ka size typically significant bullish trend ko show karta hai. Yeh patterns market ke strong uptrend aur price ke substantial recovery ko reflect karte hain. Large patterns ka formation usually longer duration ke saath hota hai, jo long-term trading strategies ke liye beneficial hota hai.

        Chhoti cup aur handle patterns bhi important hoti hain, lekin inka size aur duration kam hota hai. Yeh patterns short-term bullish trends ko indicate karte hain aur chhoti trading opportunities ko represent karte hain. Traders chhoti patterns ko short-term trading strategies ke liye use karte hain aur inki reliability ko additional technical indicators ke saath confirm karte hain.

        Cup aur handle pattern ka size ko measure karne ke liye, traders price chart par cup aur handle ke dimensions ko analyze karte hain. Cup ke height aur width aur handle ke length ko measure karke, traders potential price targets aur stop loss levels ko determine karte hain. Yeh size analysis pattern ke effectiveness aur accuracy ko improve karta hai.

        Large aur chhoti cup aur handle patterns ka comparison traders ko different trading strategies adopt karne mein help karta hai. Large patterns long-term trends ke liye suitable hote hain, jab ke chhoti patterns short-term trades ke liye ideal hoti hain. Traders apne trading goals aur market conditions ke hisaab se pattern ke size ko consider karte hain.

        4. Cup Formation Ki Pehchan

        Cup formation ki pehchan ek rounded bottom se hoti hai, jo price chart par gradual decline aur rise ko dikhata hai. Cup formation ke dauran price ek peak banati hai, phir decline karti hai aur fir se rise karti hai. Yeh U-shape price ke gradual recovery aur stability ko show karta hai.

        Cup ki formation ke dauran, price pehle ek peak banati hai, jo uski high point hoti hai. Uske baad, price decline karti hai aur cup ke bottom tak pahuchti hai. Yeh decline gradual hoti hai aur price ko gradually lower levels par le jati hai. Cup ke bottom ke baad, price fir se rise karti hai aur cup ke high ke near pahuchti hai.

        Cup ki depth aur width bhi pattern ki validity ko determine karti hai. Ideal cup formation deep aur broad hoti hai, jo strong bullish trend ko indicate karta hai. Depth aur width ka measurement traders ko pattern ke potential signal ko evaluate karne mein help karta hai.

        Cup formation ke pehchan ke liye, traders ko price chart ko bariki se observe karna hota hai. Cup ke shape aur size ko accurately measure karne ke liye, traders technical analysis tools aur indicators ka use karte hain. Yeh tools pattern ke formation ko validate karne aur trading decisions ko enhance karne mein madad karte hain.

        5. Handle Formation Ka Process

        Handle formation cup ke complete hone ke baad hota hai aur yeh ek consolidation phase ko represent karta hai. Handle formation ke dauran, price chhoti si correction ya pullback se guzarti hai jo cup ke high ke thoda niche hoti hai. Handle ka shape aur length pattern ke accuracy ko affect karte hain.

        Handle formation ke dauran, price typically ek flag ya pennant shape mein consolidate karti hai. Yeh consolidation phase price ke temporary pullback ko show karti hai aur handle ke duration ke sath gradually stabilize hoti hai. Handle ka length aur depth bhi pattern ki validity ko determine karti hai.

        Ideal handle formation short aur shallow hoti hai, jo price ke strong bullish trend ko confirm karti hai. Agar handle zyada lamba ya deep hota hai, toh yeh pattern ki validity ko kam kar sakta hai aur price ke expected movement ko affect kar sakta hai. Handle ka duration bhi important hota hai, aur yeh usually cup ke duration ka 1/3 se 1/2 hota hai.

        Handle formation ke process ko accurately observe karne ke liye, traders ko price chart par handle ke shape aur consolidation phase ko analyze karna hota hai. Handle ka shape aur length pattern ke confirmation ko provide karte hain aur trading decisions ko enhance karte hain. Additional technical indicators bhi handle formation ko validate karne mein madadgar hote hain.

        6. Cup Aur Handle Ki Validity

        Cup aur handle pattern ki validity tab hoti hai jab handle ka high cup ke high se zyada nahi hota. Handle ki formation ka duration bhi important hai; agar handle bahut zyada lamba hota hai, toh yeh pattern ki validity ko kam kar sakta hai. Pattern ki accuracy aur success rate ko validate karne ke liye, traders ko handle ke characteristics ko observe karna zaroori hai.

        Handle ki validation ke liye, traders ko handle ke resistance level ko cup ke resistance level ke saath compare karna hota hai. Agar handle ka high cup ke high se zyada hota hai, toh pattern ki validity ko question kiya ja sakta hai. Handle ki formation ke duration aur depth bhi pattern ki accuracy ko affect karte hain.

        Cup aur handle pattern ki validity ko confirm karne ke liye, traders ko price action aur volume analysis ko combine karna chahiye. Volume analysis handle formation ke dauran volume ke changes ko reflect karta hai aur pattern ke confirmation ko enhance karta hai. Volume ke barhne aur handle ke completion ke baad price ke breakout ko observe karke, traders pattern ki validity ko evaluate karte hain.

        Pattern ke validity ko assess karne ke liye, traders historical data aur past performance ka analysis bhi karte hain. Historical performance traders ko pattern ke success rate aur reliability ke baare mein insights provide karta hai. Yeh analysis traders ko better trading decisions aur strategy development mein help karta hai.

        7. Cup Aur Handle Pattern Ka Entry Signal

        Cup aur handle pattern ka entry signal tab hota hai jab price handle ke resistance level ko break karti hai. Yeh break-out point cup aur handle pattern ka confirmation hota hai aur traders is point par buy order place karte hain, expecting ke price bullish trend continue karegi.

        Entry signal ke dauran, traders ko handle ke resistance level ko accurately identify karna hota hai. Resistance level handle ke high ke level par hota hai aur price ka break-out is point se pattern ke confirmation ko indicate karta hai. Entry signal ke accuracy ko enhance karne ke liye, traders additional technical indicators ka use karte hain.

        Break-out ke baad, price ke movement ko closely monitor karna zaroori hai. Price ke strong upward movement ke sath, traders apne stop loss aur target levels ko adjust karte hain. Entry signal ke accurate timing aur pattern ke confirmation ke liye, traders ko price action aur volume analysis ko consider karna chahiye.

        Entry signal ko validate karne ke liye, traders historical data aur past performance ka analysis bhi karte hain. Yeh analysis traders ko pattern ke successful break-outs aur price movements ke patterns ke baare mein insights provide karta hai. Accurate entry signal ke liye, pattern ke formation aur confirmation ko closely observe karna zaroori hai.

        8. Stop Loss Aur Target Setting

        Cup aur handle pattern ke saath stop loss aur target setting bhi important hoti hai. Stop loss ko handle ke low ke niche place karna chahiye, taake agar price unexpected drop kare toh loss limit ho. Target setting ke liye, traders pattern ke height ko measure karke potential profit estimate karte hain.

        Stop loss ke placement ke liye, handle ke low ko consider karna chahiye, jo price ke temporary pullback ke level ko reflect karta hai. Stop loss ko handle ke low ke thoda niche place karke, traders apne losses ko limit karte hain aur unexpected price movements se protect karte hain.

        Target setting ke liye, traders cup aur handle pattern ke height ko measure karte hain. Yeh height cup ke bottom se handle ke breakout point tak ki distance hoti hai. Target price ko estimate karne ke liye, traders is height ko breakout point se add karte hain aur potential profit calculate karte hain.

        Stop loss aur target setting ke accurate placement ke liye, traders ko market conditions aur price action ko closely monitor karna hota hai. Traders additional technical indicators aur analysis tools ka use karke stop loss aur target levels ko refine karte hain aur trading strategy ko optimize karte hain.

        9. Volume Analysis Ka Role

        Volume analysis bhi cup aur handle pattern ko validate karne mein madadgar hota hai. Volume ka barhna cup ke formation ke dauran bullish trend ko confirm karta hai. Handle ke dauran volume thoda kam hota hai, lekin break-out ke time volume ka barhna pattern ke validity ko confirm karta hai.

        Cup ke formation ke dauran, volume ka increase price ke upward movement ko support karta hai aur bullish trend ko confirm karta hai. Handle ke dauran, volume thoda decrease hota hai, jo price ke consolidation phase ko indicate karta hai. Volume ka decrease handle ke stability aur consolidation ko show karta hai.

        Break-out ke time, volume ka barhna pattern ke confirmation ke liye zaroori hota hai. Increased volume break-out ke signal ko validate karta hai aur price ke upward movement ko support karta hai. Traders volume analysis ko price action ke sath combine karke pattern ke validity ko enhance karte hain.

        Volume analysis ka accurate observation pattern ke success rate ko improve karne mein help karta hai. Traders historical volume data aur past performance ka analysis karke volume ke patterns aur trends ko identify karte hain. Yeh analysis traders ko better trading decisions aur strategy development mein assist karta hai.

        10. Cup Aur Handle Pattern Ki Limitations

        Cup aur handle pattern hamesha successful nahi hota. Kuch cases mein pattern ke baad price expected direction mein move nahi karti. Yeh limitations market conditions aur external factors par depend karti hain. Pattern ki success rate ko improve karne ke liye, traders ko additional technical indicators aur analysis tools ka istemaal karna chahiye.

        Cup aur handle pattern ki limitations ko samajhna zaroori hai, taake traders realistic expectations set kar sakein. Market conditions aur economic factors pattern ke success rate ko affect kar sakte hain. Traders ko market ki volatility aur external events ko consider karna chahiye, jo pattern ke effectiveness ko influence karte hain.

        Pattern ki success rate ko improve karne ke liye, traders ko risk management strategies aur stop loss orders ko implement karna chahiye. Risk management techniques traders ko losses ko limit karne aur unexpected price movements se protect karne mein madad karti hain. Additional technical indicators aur analysis tools pattern ke confirmation ko enhance karte hain.

        Cup aur handle pattern ki limitations ko address karne ke liye, traders ko continuous learning aur market analysis par focus karna chahiye. Market conditions aur pattern ke variations ko samajhkar traders apne trading strategies ko adjust kar sakte hain aur better trading results achieve kar sakte hain.

        11. Cup Aur Handle Pattern Ka Application In Forex

        Forex trading mein cup aur handle pattern ko currency pairs ki price movements ko predict karne ke liye use kiya jata hai. Traders is pattern ko identify karne ke baad entry aur exit points determine karte hain. Forex market ke volatility aur currency pair ke characteristics pattern ki effectiveness ko affect karte hain.

        Cup aur handle pattern ka application forex trading mein traders ko potential buying opportunities identify karne mein help karta hai. Currency pairs ke price movements ko analyze karke, traders pattern ke formation aur confirmation ko detect karte hain. Forex market ke dynamic nature ko samajhkar, traders accurate trading decisions le sakte hain.

        Forex trading mein cup aur handle pattern ka successful application ke liye, traders ko additional technical indicators aur analysis tools ka use karna chahiye. Indicators jaise moving averages aur RSI pattern ke confirmation ko enhance karte hain aur trading signals ko validate karte hain. Forex market ke volatility aur economic factors ko consider karke, traders apne trading strategies ko adjust karte hain.

        Cup aur handle pattern ka application forex trading mein risk management aur trade execution ko bhi impact karta hai. Traders stop loss aur target setting ke accurate placement ke liye, forex market ke conditions aur price action ko closely monitor karte hain. Yeh application forex trading mein effective trading strategies aur profitable outcomes ko achieve karne mein madad karta hai.

        12. Cup Aur Handle Pattern Ki Historical Performance

        Historical performance ke analysis se pata chalta hai ke cup aur handle pattern past mein kis tarah perform kar raha hai. Historical data ko analyse karna traders ko pattern ke reliability aur success rate ke baare mein insights provide karta hai. Yeh historical performance traders ko better decision making mein madad karti hai.

        Historical performance analysis cup aur handle pattern ke effectiveness aur reliability ko assess karne mein help karta hai. Past data ke analysis se traders ko pattern ke successful break-outs aur price movements ke trends ke baare mein information milti hai. Yeh analysis traders ko pattern ke success rate aur trading strategies ko improve karne mein assist karta hai.

        Historical performance ke data ko analyze karte waqt, traders ko different market conditions aur external factors ko consider karna chahiye. Past performance ko current market conditions ke sath compare karke, traders pattern ke accuracy aur success rate ko evaluate karte hain. Yeh analysis traders ko better trading decisions aur strategy development mein assist karta hai.

        Historical performance ke analysis se traders ko cup aur handle pattern ke strengths aur weaknesses ke baare mein insights milti hain. Traders past performance ke basis par apne trading strategies ko adjust karte hain aur pattern ke success rate ko improve karte hain. Yeh analysis trading decisions aur risk management strategies ko enhance karne mein madad karti hai.

        13. Conclusion

        Cup aur handle pattern ek effective technical analysis tool hai jo forex trading mein price movements ko predict karne mein madadgar hota hai. Yeh pattern traders ko entry aur exit points determine karne mein help karta hai, lekin iski effectiveness market conditions aur other technical factors par bhi depend karti hai.

        Cup aur handle pattern ko sahi se identify aur validate karna zaroori hai taake successful trading strategies implement ki ja sakein. Traders ko pattern ke formation phases ko samajhna aur accurate entry aur exit points determine karna chahiye. Additional technical indicators aur analysis tools pattern ke confirmation aur trading decisions ko enhance karte hain.

        Pattern ke effectiveness ko improve karne ke liye, traders ko risk management aur stop loss orders ko implement karna chahiye. Market conditions aur external factors ko consider karke, traders apne trading strategies ko adjust karte hain aur better trading outcomes achieve karte hain. Cup aur handle pattern ka accurate analysis aur application forex trading mein success ke chances ko improve karta hai.
        • #5 Collapse

          Cup and Handle Pattern: Ek Jaiza


          1. Cup and Handle Pattern Kya Hai?

          Cup and Handle Pattern aik technical analysis tool hai jo financial markets mein price movements ko samajhne ke liye use hota hai. Yeh pattern aksar bullish trends ko identify karne ke liye use kiya jata hai. Is pattern ka naam iski shakal se hai: aik cup aur aik handle. Cup aur handle ke beech ka connection market trends aur price action ke signal ko represent karta hai.

          Cup and Handle Pattern ka formation tab hota hai jab aik asset ka price pehle girta hai aur phir dheere dheere upar aata hai, aik cup banate hue. Cup ki formation ke baad, market mein aik handle phase hota hai, jo aik consolidation phase ko represent karta hai. Handle phase ka duration cup ke shape aur market conditions pe depend karta hai. Cup aur handle ka combination ek strong bullish signal ko indicate karta hai, jo traders ko potential buying opportunities ke baray mein batata hai.

          Is pattern ko identify karne ke liye traders ko price chart ko dhyan se dekhna padta hai. Cup ki formation usually aik smooth aur rounded shape mein hoti hai, jabke handle ki shape thodi si flat aur sideways hoti hai. Is pattern ki identification ke baad, traders ko iska potential breakout aur market movement ko samajhna zaroori hota hai. Cup and Handle Pattern ko trading strategy ke sath integrate karna, iske signals aur patterns ko accurately samajhna, aur risk management strategies ko implement karna traders ko market mein success ke liye madadgar hota hai.

          Cup and Handle Pattern ko technical analysis tools ke sath use karna, jaise moving averages aur volume indicators, trading decisions ko enhance kar sakta hai. Yeh pattern long-term aur short-term trading strategies dono mein effective hai. Traders ko is pattern ki formation ko analyze karte waqt market trends aur historical data ko bhi consider karna chahiye taake accurate predictions aur informed decisions le sakain.

          2. Cup Ki Formation

          Cup ki formation aik gradual aur rounded shape mein hoti hai. Jab market aik downtrend se guzarta hai, to cup ka pehla part formation mein aata hai. Yeh downtrend typically ek gradual decline hota hai, jo market ke bearish sentiment ko indicate karta hai. Cup ki formation ke dauran, price gradually niche jati hai, aur phir aik point par stabilize hoti hai. Yeh stabilization market ke equilibrium ko indicate karta hai.

          Cup ka doosra part aik gradual rise hota hai, jo price ke upar aane ki wajah se hota hai. Is phase mein, market gradually apne previous highs ko cross karta hai, jo bullish trend ka signal hota hai. Cup ki shape complete hone ke baad, price aik consolidation phase mein enter karti hai, jo handle formation ka part hota hai. Cup ki formation ko analyze karte waqt traders ko market ke momentum aur volume changes ko bhi monitor karna chahiye.

          Cup ki formation ki duration market conditions pe depend karti hai. Short-term cup formations kuch hafton tak chal sakti hain, jabke long-term cup formations mein mawaafiq saalon lag sakte hain. Traders ko cup ki formation ki duration ko identify karne ke liye price action aur volume trends ko closely monitor karna zaroori hota hai.

          Cup ki formation ko accurately identify karne ke liye technical analysis tools, jaise moving averages aur trendlines, ka use kiya jata hai. Yeh tools market ki price action aur momentum ko analyze karne mein madadgar hote hain. Cup ki formation ka samajh traders ko market trends aur potential buying opportunities ko identify karne mein madad karta hai.

          3. Handle Ki Formation

          Handle ki formation cup ke completion ke baad hoti hai aur yeh typically aik consolidation phase ko represent karti hai. Handle ki formation usually sideways ya slight downward movement mein hoti hai. Handle ka size chhota hota hai aur yeh price action ke consolidation ko show karta hai. Is phase ke dauran, market stability aur choti moti fluctuations ko indicate karta hai.

          Handle ki duration cup ke size aur market conditions pe depend karti hai. Handle ka formation kuch hafton ya mawaafiq mahino tak chal sakta hai. Handle ke phase ko identify karte waqt traders ko market ki volatility aur volume changes ko monitor karna zaroori hota hai. Handle phase ke dauran, price ka movement chhota aur sideways hota hai, jo market ke consolidation aur stability ko reflect karta hai.

          Handle ka formation traders ko potential breakout points ko identify karne mein madad karta hai. Jab price handle phase ke end mein cup ke high se break karti hai, to yeh bullish signal hota hai. Handle phase ka duration aur shape traders ko market ke strength aur potential trend reversal ke signals provide karta hai.

          Handle ki formation ke dauran traders ko stop-loss orders aur risk management strategies ko implement karna zaroori hota hai. Yeh strategies market ki unexpected movements se bachne mein madad deti hain aur trading capital ko protect karti hain. Handle phase ke completion ke baad, traders ko pattern ke breakout point ko monitor karna chahiye, jo potential buying opportunities ko indicate karta hai.

          4. Cup and Handle Pattern Ka Importance

          Cup and Handle Pattern ka importance isme hai ke yeh aik reliable bullish trend reversal pattern hai. Jab yeh pattern complete hota hai, to yeh market mein bullish trend ka indication hota hai. Is pattern ka identification aur analysis traders ko potential buying opportunities aur market trends ko samajhne mein madad karta hai.

          Cup and Handle Pattern ki importance ka ek aspect yeh hai ke yeh long-term aur short-term trading strategies dono mein effective hota hai. Traders is pattern ko long-term investments ke liye use kar sakte hain ya short-term trading ke liye bhi. Is pattern ke signals market ke momentum aur trend direction ko accurately predict karne mein madad karte hain.

          Cup and Handle Pattern ki pehchan aur analysis se traders apne trading decisions ko behtar bana sakte hain. Is pattern ko technical analysis tools ke sath use karke, traders market ki price action aur trend movements ko accurately analyze kar sakte hain. Yeh pattern trading strategies aur risk management practices ko enhance karne mein bhi madadgar hota hai.

          Cup and Handle Pattern ka importance market ke volatility aur fluctuations ko samajhne mein bhi hai. Yeh pattern market ke bullish trends aur potential reversals ko identify karne mein madad karta hai. Is pattern ka effective use traders ko market ke trends aur movements ko better samajhne mein madad deta hai, jo unki trading performance ko improve karta hai.

          5. Pattern Ki Pehchan

          Cup and Handle Pattern ko pehchan na mushkil nahi hota, lekin iske accurate identification ke liye traders ko careful analysis aur market observation zaroori hota hai. Cup ki shape typically aik rounded U-shape mein hoti hai, jabke handle ki shape thodi si flat aur sideways hoti hai. Cup aur handle ke beech ka connection market trends aur price movements ke signals ko reflect karta hai.

          Cup ki pehchan ke liye traders ko price chart ko dekhna hota hai, jo gradual downtrend aur gradual uptrend ko show karta hai. Cup ke formation ke dauran, price ka gradual decline aur phir gradual rise market ke stability aur strength ko indicate karta hai. Handle ki pehchan ke liye, traders ko cup ke completion ke baad aik consolidation phase dekhna hota hai, jo handle ke formation ko show karta hai.

          Pattern ki pehchan ke liye technical analysis tools, jaise trendlines aur moving averages, ka use kiya jata hai. Yeh tools market ki price action aur momentum ko accurately analyze karne mein madadgar hote hain. Cup and Handle Pattern ki pehchan se traders ko potential buying opportunities aur market trends ko accurately identify karne mein madad milti hai.

          Pattern ki pehchan ke liye traders ko patience aur attention to detail zaroori hota hai. Cup and Handle Pattern ki accurate identification se traders apni trading strategies ko enhance kar sakte hain aur market ke trends aur movements ko better samajh sakte hain. Yeh pattern trading decisions ko informed aur accurate banane mein madad karta hai.

          6. Pattern Ka Timing

          Cup and Handle Pattern ka timing identify karna trading decisions ke liye critical hota hai. Cup ki formation ko complete hone mein kuch waqt lag sakta hai, aur handle phase bhi kuch waqt le sakta hai. Cup aur handle ke combination ka timing market conditions aur price movements pe depend karta hai.

          Cup ki formation usually aik gradual process hoti hai, jo market ke downtrend aur uptrend ko represent karti hai. Cup ke formation ke dauran, price gradually niche jati hai aur phir upar aati hai. Is process ko complete hone mein kuch waqt lag sakta hai. Handle phase ke dauran, price aik consolidation phase mein enter karti hai, jo handle ki formation ko show karta hai.

          Pattern ke timing ko accurately identify karne ke liye traders ko market ke trends aur volume changes ko closely monitor karna padta hai. Handle phase ka duration aur timing market ke volatility aur price action pe depend karta hai. Pattern ke timing ko accurately analyze karne se traders ko potential breakout points aur buying opportunities ko identify karne mein madad milti hai.

          Cup and Handle Pattern ke timing ko market conditions aur historical data ke sath integrate karna zaroori hota hai. Traders ko price action aur volume trends ko monitor karte hue pattern ke timing ko adjust karna chahiye. Yeh timing analysis trading decisions ko enhance karne aur market movements ko accurately predict karne mein madad karta hai.

          7. Trading Signals

          Cup and Handle Pattern ko trading signals ke liye use kiya jata hai. Jab handle phase complete hota hai aur price cup ke high se break karti hai, to yeh aik bullish signal hota hai. Yeh signal traders ko potential buying opportunities aur market trends ke baray mein batata hai.

          Trading signals ko accurately interpret karne ke liye, traders ko pattern ki complete formation aur market ke momentum ko analyze karna hota hai. Handle phase ke end mein cup ke high se price ka breakout bullish trend ko indicate karta hai. Yeh signal traders ko entry points aur potential profit targets ko identify karne mein madad karta hai.

          Trading signals ke interpretation mein volume changes bhi important role play karti hai. Cup and Handle Pattern ke breakout ke dauran, volume ka increase bullish trend ko confirm karne mein madad karta hai. Traders ko volume aur price action ke sath pattern ke signals ko analyze karte hue trading decisions lene chahiye.

          Pattern ke trading signals ko risk management strategies ke sath integrate karna bhi zaroori hota hai. Yeh strategies stop-loss orders aur profit targets ko set karne mein madad karti hain aur trading capital ko protect karti hain. Accurate trading signals aur effective risk management strategies traders ko market mein success ke liye madadgar hoti hain.

          8. Risk Management

          Risk management is pattern ke trading mein important role play karta hai. Cup and Handle Pattern ko trading ke waqt stop-loss orders set karna zaroori hai taake unexpected market movements se bach sakain. Risk management strategies traders ke trading capital ko protect karti hain aur potential losses ko minimize karti hain.

          Stop-loss orders ko set karte waqt, traders ko pattern ke breakout points aur market ke volatility ko consider karna chahiye. Yeh orders market ki unexpected movements aur price fluctuations se bachne mein madad deti hain. Risk management ke liye position sizing aur diversification strategies bhi implement ki jati hain.

          Risk management strategies ko market conditions aur pattern ke signals ke sath integrate karna zaroori hota hai. Traders ko pattern ke completion ke baad, market ke momentum aur price action ko monitor karna chahiye. Yeh monitoring trading decisions ko adjust karne aur risk ko manage karne mein madad karti hai.

          Risk management practices trading capital ko protect karne ke liye zaroori hoti hain. Cup and Handle Pattern ke trading mein risk management ke tools aur strategies ko implement karne se traders apne trading performance ko enhance kar sakte hain aur market ke uncertainties se bach sakte hain.

          9. Pattern Ka Target Price

          Cup and Handle Pattern ka target price calculate karne ke liye, traders cup ke depth aur handle ke breakout point ko consider karte hain. Cup ke depth ko measure karke, usko handle ke breakout point se add kiya jata hai, jo target price ko indicate karta hai.

          Target price ka calculation traders ko potential profit aur market trends ke estimation mein madad karta hai. Yeh calculation pattern ke accuracy aur market ke movement ko reflect karta hai. Traders ko target price ko calculate karte waqt market conditions aur historical data ko bhi consider karna chahiye.

          Target price ke calculation mein technical analysis tools, jaise Fibonacci retracements aur trendlines, ka use kiya jata hai. Yeh tools market ke price action aur momentum ko analyze karne mein madadgar hote hain. Target price ka accurate calculation traders ko trading decisions ko informed aur precise banane mein madad karta hai.

          Target price ke calculation ke baad, traders ko market ke movements aur price action ko closely monitor karna chahiye. Yeh monitoring traders ko potential profit aur risk ko manage karne mein madad deti hai. Cup and Handle Pattern ke target price calculation se traders apni trading strategies ko optimize kar sakte hain.

          10. Common Mistakes

          Traders aksar Cup and Handle Pattern ko sahi tarah se identify nahi karte ya phir pattern ki completion ke baad trading signals ko overlook kar dete hain. Yeh mistakes trading losses aur market uncertainties ka sabab ban sakti hain. Accurate pattern identification aur analysis se traders apne trading decisions ko behtar bana sakte hain.

          Common mistakes mein pattern ke incomplete formation ko ignore karna, handle phase ke duration ko overlook karna, aur volume changes ko analyze na karna shamil hai. Yeh mistakes traders ko misleading signals aur incorrect trading decisions tak le ja sakti hain. Traders ko pattern ke accurate identification aur analysis ke liye patience aur attention to detail zaroori hoti hai.

          Pattern ke completion ke baad trading signals ko overlook karna bhi aik common mistake hai. Yeh signals market ke bullish trends aur potential buying opportunities ko indicate karte hain. Traders ko pattern ke completion ke baad trading signals ko carefully analyze karna chahiye taake accurate trading decisions le sakain.

          Traders ko common mistakes se bachne ke liye, technical analysis tools aur risk management strategies ko implement karna chahiye. Yeh tools aur strategies traders ko accurate pattern identification aur trading decisions mein madad karte hain. Common mistakes ko avoid karke, traders apni trading performance ko enhance kar sakte hain.

          11. Practical Applications

          Cup and Handle Pattern ko stocks, forex, aur commodities markets mein use kiya jata hai. Yeh pattern har market mein valid hota hai, lekin iski effectiveness market conditions aur timeframes pe depend karti hai. Traders ko pattern ko apni trading strategy ke sath integrate karna chahiye.

          Stocks market mein Cup and Handle Pattern ko identify karne ke liye, traders ko company ke financials aur market conditions ko bhi consider karna chahiye. Forex markets mein, is pattern ka analysis currency pairs ke trends aur economic indicators ke sath kiya jata hai. Commodities markets mein, pattern ka use raw materials aur commodities ke price movements ko analyze karne ke liye hota hai.

          Cup and Handle Pattern ka practical application long-term aur short-term trading strategies dono mein hota hai. Traders ko pattern ke signals ko apni trading strategies aur risk management practices ke sath integrate karna chahiye. Is pattern ko market conditions ke sath adapt karna traders ko accurate predictions aur successful trades ke liye madad deta hai.

          Pattern ki practical applications ko market ke historical data aur trends ke sath bhi analyze karna chahiye. Yeh analysis traders ko market ke movements aur potential buying opportunities ko better samajhne mein madad karti hai. Cup and Handle Pattern ko trading strategies mein integrate karke, traders apni trading performance ko optimize kar sakte hain.

          12. Conclusion

          Cup and Handle Pattern aik effective technical analysis tool hai jo traders ko bullish trends aur market movements ko identify karne mein madad karta hai. Is pattern ki pehchan aur analysis se traders apni trading decisions ko behtar bana sakte hain aur potential profits achieve kar sakte hain.

          Cup and Handle Pattern ki accurate identification aur analysis se traders ko market ke trends aur movements ko better samajhne mein madad milti hai. Yeh pattern trading strategies aur risk management practices ko enhance karne mein bhi madadgar hota hai. Traders ko pattern ke signals aur analysis ko carefully implement karna chahiye taake successful trading decisions le sakain.

          Pattern ke practical applications aur effective use traders ko market ke bullish trends aur potential buying opportunities ko identify karne mein madad karte hain. Cup and Handle Pattern trading mein discipline aur patience ko develop karne mein bhi madad karta hai. Accurate pattern analysis aur trading strategies se traders apni trading performance ko enhance kar sakte hain aur market mein success achieve kar sakte hain.

          • #6 Collapse

            Cup and Handle Pattern:
            Introduction

            Cup and Handle pattern ek ahem technical analysis pattern hai jo forex, stocks, aur commodities markets mein use hota hai. Yeh pattern bullish continuation ka signal hota hai, yaani market mein trend continue hone ke chances hote hain. Yeh pattern traders ko entry points identify karne mein madad deta hai aur price breakout ke baad market mein significant gains hasil karne ka mauka deta hai.

            1. Cup and Handle Pattern Kya Hai?

            Cup and Handle pattern do parts par mushtamil hota hai: "Cup" aur "Handle". Yeh pattern aksar market mein consolidation period ke baad form hota hai aur uske baad market mein upward breakout hota hai.

            a. Cup Ka Formation

            Cup ka shape ek rounded bottom jaisa hota hai, jo market ke consolidation phase ko represent karta hai. Yeh phase tab hota hai jab market mein selling pressure kum hota hai aur price gradually lower levels se recover hota hai. Cup ke edges symmetric hote hain aur yeh ek "U" shape ka structure form karta hai.

            b. Handle Ka Formation

            Handle cup ke formation ke baad banta hai. Yeh pattern ka chhota hissa hota hai jo cup ke right side par form hota hai. Handle ke formation ke dauran market mein thodi si correction ya pullback dekhi ja sakti hai, lekin yeh temporary hota hai. Handle ke complete hone ke baad, market mein ek breakout hota hai jo bullish trend continuation ko signal karta hai.

            2. Cup and Handle Pattern Ko Identify Karna

            Cup and Handle pattern ko charts par identify karna thoda practice aur concentration ka talabgaar hota hai. Yeh pattern aksar longer timeframes par form hota hai, jese daily ya weekly charts.

            a. Pattern Ki Length Aur Depth

            Cup ki depth aur length kaafi matter karti hai. Agar cup bohot deep ho, toh yeh is baat ki nishani ho sakti hai ke market mein selling pressure zyada tha. Cup ki depth moderate honi chahiye aur yeh ideally ek "U" shape ka pattern form kare.

            b. Handle Ki Positioning

            Handle ki positioning bhi bohot important hoti hai. Handle cup ke right side par form hota hai aur yeh thoda sa downward move karta hai. Lekin, yeh movement ek bullish breakout se pehle ka signal hota hai.

            3. Cup and Handle Pattern Ka Use Trading Mein

            Cup and Handle pattern ko trading mein use karne ke liye, aapko pattern ke sahi formation ka intezar karna hota hai aur phir uske breakout ka wait karna hota hai.

            a. Entry Point

            Jab Cup and Handle pattern form ho jaye aur handle ke baad price breakout kare, toh yeh ek strong buy signal hota hai. Aap apna buy order handle ke breakout ke thoda sa upar place kar sakte hain taake aapka entry point missed na ho.

            b. Stop-Loss Placement

            Stop-loss placement risk management ke liye bohot zaroori hota hai. Cup and Handle pattern ke case mein, aap apna stop-loss handle ke neeche ya phir cup ke low ke neeche place kar sakte hain. Yeh is baat ka ensure karta hai ke agar market aapke against move kare, toh aapka loss limit mein rahe.

            c. Profit Target

            Profit target set karna trading strategy ka ek important hissa hota hai. Cup and Handle pattern ke liye, aap apna profit target cup ki depth ke barabar set kar sakte hain. Agar cup ki depth 50 points hai, toh aapka target bhi handle ke breakout se 50 points upar hona chahiye.

            4. Cup and Handle Pattern Ki Limitations

            Jis tarah har trading pattern ke apne strengths hain, waisi hi iske kuch limitations bhi hain.

            a. False Breakouts

            Kabhi kabhi market mein false breakouts bhi hote hain, jo Cup and Handle pattern ko invalid kar sakte hain. Aise cases mein, market expected direction mein move nahi karti, aur traders ko loss ho sakta hai. Isliye, hamesha doosre indicators ke sath is pattern ko confirm karna chahiye.

            b. Longer Timeframes Required

            Cup and Handle pattern aksar longer timeframes par form hota hai. Iska matlab yeh hai ke short-term traders ke liye is pattern ka use karna mushkil ho sakta hai. Yeh pattern mostly swing traders aur position traders ke liye zyada suitable hota hai.

            Conclusion

            Cup and Handle pattern ek reliable aur powerful bullish continuation pattern hai jo forex aur doosri markets mein frequently dekha jata hai. Yeh pattern traders ko market mein significant price movements ko capture karne ka mauka deta hai. Lekin, is pattern ko sahi tareeke se samajhna aur identify karna zaroori hota hai. Is pattern ko apni trading strategy mein shamil karke aur sahi risk management ke sath use karke, aap apne trading results ko improve kar sakte hain. Lekin, hamesha yaad rakhein ke market unpredictable hoti hai, isliye hamesha apni strategy ko multiple indicators ke sath confirm karna chahiye.
            • <a href="https://www.instaforex.org/ru/?x=ruforum">InstaForex</a>
            • #7 Collapse

              Cup and Handle Pattern: Forex Trading Mein Iska Role


              1. Cup and Handle Pattern Ka Introduction

              Cup and Handle Pattern Forex trading ke technical analysis ka aik aham hissa hai. Ye pattern ek classic chart formation hai jo traders ko price movements ko analyze karne aur future trends ko predict karne mein madad karta hai. Iska asal naam cup aur handle se hai, jo ke pattern ke do mukhya components hain. Ye pattern primarily bullish market scenarios mein dekha jata hai, lekin iska istemal bearish market conditions mein bhi ho sakta hai.

              Cup and Handle Pattern ka structure visually distinct hota hai. Cup ek rounded shape hota hai jo market ke long-term consolidation ko dikhata hai, jabke handle ek short-term consolidation phase hota hai jo cup ke edge ke slightly below hota hai. Is pattern ka purpose market ke stabilization aur strong bullish trends ko identify karna hai. Iske formation ke dauran, price movements generally ek smooth aur gradual progression show karte hain.

              Pattern ka recognition Forex trading mein crucial hota hai, kyunke yeh pattern traders ko entry aur exit points determine karne mein madad karta hai. Cup and Handle Pattern ki understanding se aap better trading decisions le sakte hain aur apne trades ko optimize kar sakte hain. Ye pattern market sentiment aur price trends ke changes ko reflect karta hai, jo traders ko insightful analysis provide karta hai.

              Cup and Handle Pattern ka formation kaafi common hai, lekin is pattern ko correctly identify karna aur analyze karna important hota hai. Market ke different phases ko samajhna aur pattern ke various components ko recognize karna aapko better trading strategies develop karne mein madad karega. Is pattern ko Forex trading mein use karne ke liye aapko iske formation aur characteristics ki detailed understanding hona zaroori hai.

              2. Cup Ka Formation

              Cup ka formation ek rounded shape me hota hai jo ek smooth U-shaped curve ko dikhata hai. Iska formation typically long-term consolidation ko represent karta hai, jahan market pehle girti hai, fir bottom pe consolidate hoti hai, aur phir uhti hai. Cup ki formation price ke gradual movement aur stability ko indicate karti hai, jo ek healthy market correction ko reflect karta hai.

              Cup ki formation ke dauran, market pehle ek significant downtrend dekhti hai, jo usually market ke previous high se start hota hai. Iske baad, market consolidate karti hai aur ek stable bottom formation create karti hai. Ye consolidation phase price ke stability aur long-term trend ke reversal ko signal karta hai. Is phase ke dauran, volume generally kam hota hai, jo market ki calmness aur stability ko dikhata hai.

              Cup ke formation ke baad, price gradually uhti hai aur cup ke upper edge ko test karti hai. Is upward movement ko market ke recovery aur bullish sentiment ko indicate karti hai. Cup ki depth aur shape market ke overall health aur trend ke reversal potential ko reflect karti hai. Ye pattern traders ko ek clear indication deta hai ki market bullish trend ki taraf move kar raha hai.

              Cup ka formation tabhi effective hota hai jab price smooth aur gradual movement show kare. Agar cup ka formation abrupt ya jagged ho, to ye pattern ki validity ko affect kar sakta hai. Isliye, cup ke formation ke dauran price movements ko closely monitor karna aur market trends ko analyze karna zaroori hai. Isse aap accurate predictions aur effective trades execute kar sakte hain.

              3. Handle Ka Formation

              Handle ka formation cup ke upper edge se slightly below hota hai aur generally ek short-term consolidation phase ko represent karta hai. Handle ka shape usually ek small downward drift ya sideways movement me hota hai. Ye consolidation phase price ke stability aur market ke strength ko reflect karta hai. Handle ka formation cup ke bullish trend ke continuation ko confirm karta hai.

              Handle ke formation ke dauran, price thoda sa niche girti hai ya sideway movement show karti hai. Ye phase market ke rest aur consolidation ko indicate karta hai, jo ek strong bullish trend ke continuation ke liye necessary hai. Handle ke formation ke dauran volume usually kam hota hai, jo market ki stability aur consolidation ko dikhata hai.

              Handle ki depth cup ke upper edge se 15% se zyada nahi honi chahiye. Agar handle ka depth excessive ho, to ye pattern ki reliability ko affect kar sakta hai. Handle ke formation ka duration bhi important hota hai; agar handle zyada time tak form hota hai, to ye pattern ke effectiveness ko reduce kar sakta hai. Isliye, handle ke formation ke dauran price movements aur volume ko closely monitor karna zaroori hai.

              Handle ka formation market ke bullish trend ke continuation ko confirm karta hai aur traders ko entry points identify karne me madad karta hai. Handle ke completion ke baad, price ka breakout cup ke upper edge se hota hai, jo market ke bullish sentiment aur trend ke continuation ko indicate karta hai. Handle ke formation ko accurately analyze karne se aap effective trading decisions le sakte hain.

              4. Pattern Ki Validity

              Cup and Handle Pattern ki validity ko pattern ke different components aur market conditions ke hisaab se evaluate kiya jata hai. Handle ki depth aur formation pattern ki validity ko affect karte hain. Handle ka depth cup ke upper edge se 15% se zyada nahi honi chahiye, warna pattern ki reliability reduce ho sakti hai.

              Pattern ki validity ko volume analysis se bhi check kiya jata hai. Cup ke formation ke dauran volume usually low hota hai, aur handle ke formation ke dauran volume increase hota hai. Breakout ke waqt volume ka increase pattern ki strength ko confirm karta hai aur market ke bullish sentiment ko indicate karta hai. Volume analysis se aap pattern ki authenticity aur reliability ko verify kar sakte hain.

              Market conditions bhi pattern ki validity ko affect karti hain. Cup and Handle Pattern strong uptrend me zyada reliable hota hai. Agar market bearish ya sideways hai, to pattern ki effectiveness kam ho sakti hai. Isliye, pattern ko market conditions ke sath align karna zaroori hai. Pattern ki validation ke liye dusre technical indicators ka bhi use karna chahiye.

              Pattern ke formation ke dauran kuch common mistakes ko avoid karna chahiye, jese ki handle ki depth ko excessive samajhna ya pattern ke formation ko ignore karna. Ye mistakes pattern ki validity ko affect kar sakti hain aur trading decisions ko mislead kar sakti hain. Accurate analysis aur careful observation se aap pattern ki validity ko enhance kar sakte hain.

              5. Entry Points

              Cup and Handle Pattern me entry points identify karna crucial hota hai. Entry point usually handle ke formation ke dauran hota hai, jab price cup ke upper edge ko break karti hai. Is breakout ko confirm karne ke liye volume ka increase bhi zaroori hota hai, jo pattern ke strength ko confirm karta hai aur market ke bullish sentiment ko indicate karta hai.

              Entry point ko identify karne ke liye handle ke completion aur breakout ke waqt price movements aur volume ko closely monitor karna chahiye. Handle ke completion ke baad, price ka breakout cup ke upper edge se hota hai, jo market ke bullish trend ke continuation ko signal karta hai. Is waqt entry karna aapko higher probability trades execute karne me madad karta hai.

              Entry points ko accurately identify karne ke liye pattern ke different phases aur market conditions ko consider karna chahiye. Cup and Handle Pattern ko dusre technical indicators ke sath combine karna bhi beneficial hota hai. Isse aap accurate trading signals aur entry points identify kar sakte hain. Market ki volatility aur price movements ko analyze karna bhi zaroori hai.

              Entry points ke determination ke dauran stop-loss aur target price calculation ko bhi consider karna chahiye. Stop-loss ko handle ke niche set karna chahiye, taake agar price handle ke niche girti hai to aapka position minimize ho sake. Yeh risk management ko improve karta hai aur aapko losses se bachata hai.

              6. Stop-Loss Setting

              Stop-loss setting Cup and Handle Pattern me risk management ka important aspect hai. Stop-loss ko handle ke niche set kiya jata hai, taake agar price handle ke niche girti hai to aapka position minimize ho sake. Yeh aapko unexpected price movements aur losses se bachane me madad karta hai.

              Stop-loss setting ke liye handle ke niche ek reasonable distance choose karna chahiye. Agar stop-loss bahut tight hota hai, to price fluctuations ke wajah se aapka position jaldi stop-out ho sakta hai. Agar stop-loss bahut wide hota hai, to potential losses increase ho sakte hain. Isliye, stop-loss ko handle ke niche set karte waqt market conditions aur price volatility ko consider karna chahiye.

              Stop-loss ko set karne ke baad, apne position ko regularly monitor karna chahiye. Agar price handle ke niche girti hai, to aapka stop-loss trigger hoga aur aapka position automatically close ho jayega. Yeh aapko unexpected losses se bachata hai aur risk management ko improve karta hai.

              Stop-loss setting ke liye kuch common mistakes hain, jese ki stop-loss ko ignore karna ya handle ke depth ko excessive samajhna. Ye mistakes aapko significant losses ka samna karwa sakti hain aur aapke trading decisions ko affect kar sakti hain. Accurate stop-loss setting aur regular monitoring se aap apne trades ko protect kar sakte hain.

              7. Target Price Calculation

              Target price calculation Cup and Handle Pattern me profit potential ko estimate karne ke liye important hota hai. Target price ko cup ke depth se calculate kiya jata hai. Cup ke lower part se handle ke breakout point ko subtract karke, aap expected target price ko nikal sakte hain.

              Target price calculation ke liye cup ki depth ko accurately measure karna zaroori hai. Cup ki depth ko handle ke breakout point se subtract karke, aap expected price movement ko estimate kar sakte hain. Yeh calculation aapko potential profit ko predict karne me madad karti hai aur trade ke risk-reward ratio ko assess karti hai.

              Target price ko set karne ke baad, apne trades ko regularly monitor karna chahiye. Agar price target price ko reach karti hai, to aap apne profits book kar sakte hain. Agar price target price ke near nahi aati, to aap apne stop-loss ko adjust kar sakte hain aur risk management ko improve kar sakte hain.

              Target price calculation ke dauran kuch common mistakes hain, jese ki target price ko overly optimistic ya conservative set karna. Yeh mistakes aapke trading decisions ko affect kar sakti hain aur potential profits ko reduce kar sakti hain. Accurate target price calculation aur regular monitoring se aap effective trading decisions le sakte hain.

              8. Volume Analysis

              Volume analysis Cup and Handle Pattern ki validity aur effectiveness ko determine karne ke liye important hota hai. Cup ke formation ke dauran volume usually low hota hai, aur handle ke formation ke dauran volume increase hota hai. Breakout ke waqt volume ka increase pattern ki strength ko confirm karta hai aur market ke bullish sentiment ko indicate karta hai.

              Volume analysis se aap pattern ke different phases ko evaluate kar sakte hain aur pattern ki reliability ko verify kar sakte hain. Volume ka increase handle ke formation ke dauran bullish trend ke continuation ko signal karta hai. Agar volume handle ke completion ke waqt increase hota hai, to ye pattern ki strength ko confirm karta hai aur accurate trading signals provide karta hai.

              Volume analysis ke liye kuch common tools hain, jese ki volume indicators aur volume profile. Yeh tools aapko volume trends aur patterns ko analyze karne me madad karte hain. Volume indicators ko Cup and Handle Pattern ke sath combine karna aapko better trading decisions lene me madad kar sakta hai.

              Volume analysis ke dauran kuch mistakes hain, jese ki volume trends ko ignore karna ya volume ke changes ko overestimate karna. Yeh mistakes pattern ke validity ko affect kar sakti hain aur trading decisions ko mislead kar sakti hain. Accurate volume analysis aur careful observation se aap pattern ki strength ko evaluate kar sakte hain.

              9. Market Conditions Ka Asar

              Cup and Handle Pattern ki effectiveness market conditions ke hisaab se vary karti hai. Ye pattern strong uptrend me zyada reliable hota hai, kyunke is case me pattern bullish trend ke continuation ko indicate karta hai. Agar market bearish ya sideways hai, to pattern ki effectiveness kam ho sakti hai aur false signals generate ho sakte hain.

              Market conditions ko analyze karne ke liye aapko market ke overall trends aur sentiment ko samajhna zaroori hai. Market ke different phases aur trends ko consider karna aapko pattern ki validity ko evaluate karne me madad karta hai. Market conditions ke hisaab se Cup and Handle Pattern ko adjust karna zaroori hai, taake aap accurate trading signals aur effective trades execute kar sakein.

              Market conditions ke analysis ke liye kuch common tools hain, jese ki trend indicators aur market sentiment analysis. Yeh tools aapko market ke overall trends aur sentiment ko evaluate karne me madad karte hain. Market conditions ko Cup and Handle Pattern ke sath combine karna aapko better trading decisions lene me madad kar sakta hai.

              Market conditions ke dauran kuch common mistakes hain, jese ki market trends ko ignore karna ya pattern ko market conditions ke hisaab se adjust na karna. Yeh mistakes pattern ki effectiveness ko affect kar sakti hain aur trading decisions ko mislead kar sakti hain. Accurate market conditions analysis aur careful observation se aap pattern ki effectiveness ko evaluate kar sakte hain.

              10. Common Mistakes

              Cup and Handle Pattern me kuch common mistakes hain jo pattern ki effectiveness ko affect kar sakti hain. In mistakes ko identify karna aur avoid karna zaroori hai, taake aap accurate trading decisions le sakte hain aur potential losses se bach sakte hain.

              Ek common mistake handle ki depth ko excessive samajhna hai. Agar handle ka depth cup ke upper edge se zyada hota hai, to pattern ki reliability reduce ho sakti hai. Handle ke formation ke dauran price movements aur volume ko closely monitor karna chahiye, taake aap accurate pattern formation identify kar sakein.

              Dusri common mistake pattern ke formation ko ignore karna hai. Cup and Handle Pattern ka accurate formation market ke reliable signals ko provide karta hai. Agar pattern ke components ko correctly identify nahi kiya jata, to aap misleading signals aur ineffective trades execute kar sakte hain. Pattern ke formation ko carefully observe karna zaroori hai.

              Common mistakes ko avoid karne ke liye, aapko pattern ke different phases aur market conditions ko consider karna chahiye. Accurate analysis aur careful observation se aap pattern ki validity aur effectiveness ko enhance kar sakte hain. Yeh mistakes ko identify karne ke liye, pattern ke formation aur market trends ko closely monitor karna chahiye.

              11. Pattern Ki Limitations

              Cup and Handle Pattern ki kuch limitations bhi hain jo pattern ki effectiveness ko affect kar sakti hain. Ye limitations pattern ke formation aur market conditions ke hisaab se vary karti hain. Isliye, pattern ki limitations ko samajhna aur consider karna zaroori hai.

              Ek limitation ye hai ki Cup and Handle Pattern har market condition me kaam nahi karta. Ye pattern zyada reliable hota hai jab market strong uptrend me hota hai. Agar market bearish ya sideways hai, to pattern ki effectiveness kam ho sakti hai aur false signals generate ho sakte hain.

              Dusri limitation ye hai ki Cup and Handle Pattern sometimes misleading signals bhi generate kar sakta hai. Agar pattern ke components ko correctly identify nahi kiya jata, to aapko inaccurate signals mil sakte hain. Isliye, pattern ko dusre technical indicators ke sath combine karna zaroori hai, taake aap accurate trading decisions le sakein.

              Pattern ki limitations ko overcome karne ke liye, aapko market conditions aur pattern ke components ko carefully analyze karna chahiye. Accurate analysis aur careful observation se aap pattern ki effectiveness ko enhance kar sakte hain aur effective trades execute kar sakte hain.

              12. Real-World Examples

              Forex market me Cup and Handle Pattern ki kuch successful examples hain jo pattern ki effectiveness aur reliability ko demonstrate karte hain. In examples ko analyze karne se aap pattern ki real-world application aur trading strategies ko samajh sakte hain.

              Ek example EUR/USD currency pair me dekha ja sakta hai. Is pair me Cup and Handle Pattern ka formation strong bullish trends ko indicate karta hai. Cup ke formation ke dauran price consolidation aur handle ke formation ke dauran volume increase hota hai. Breakout ke waqt price ka movement strong bullish trend ko confirm karta hai.

              Dusra example GBP/USD currency pair me dekha ja sakta hai. Is pair me Cup and Handle Pattern ka formation market ke bullish sentiment aur trend ke continuation ko signal karta hai. Cup ke formation ke dauran price smooth aur gradual movement show karti hai, aur handle ke formation ke dauran volume increase hota hai. Breakout ke waqt price ke strong movement pattern ki effectiveness ko confirm karta hai.

              Real-world examples ko analyze karne ke liye, aapko market trends aur pattern ke components ko closely observe karna chahiye. Accurate analysis aur careful observation se aap pattern ki effectiveness aur reliability ko evaluate kar sakte hain aur effective trading strategies develop kar sakte hain.

              13. Conclusion

              Cup and Handle Pattern ek powerful technical analysis tool hai jo Forex traders ko market trends ko samajhne aur effective trades execute karne me madad karta hai. Is pattern ke different components aur formation ko accurately analyze karna zaroori hai, taake aap accurate trading signals aur effective trades identify kar sakein.

              Pattern ki validity aur effectiveness ko volume analysis, market conditions, aur common mistakes ke through evaluate kiya jata hai. Is pattern ko dusre technical indicators ke sath combine karna bhi beneficial hota hai, taake aap accurate trading decisions le sakein. Cup and Handle Pattern ka accurate analysis aur effective use aapko successful trades execute karne me madad karega.

              Forex market me Cup and Handle Pattern ki real-world application aur examples se aap pattern ke effectiveness aur reliability ko samajh sakte hain. Accurate analysis aur careful observation se aap pattern ko effectively use kar sakte hain aur apne trading strategies ko enhance kar sakte hain.

              اب آن لائن

              Working...
              X