Tower Bottom candlestick pattern
X
  • وقت
  • دکھائیں
Clear All
new posts
  • #1 Collapse

    Tower Bottom candlestick pattern
    Tower Bottom Candlestick Pattern

    Tower Bottom candlestick pattern forex market mein bullish trend reversal candlestick pattern hota hey forex market kay es kesam kay chart pattern mein 2 bare opposite rang ke hote or 3 candlestick central mein chote hote hey total 5 candlestick hote hein
    yeh forex market mein price chart kay nechay ka pattern hota hey trend bearish ka bhe hota hey or forex market mein trend bullish ka bhe hota hey forex market mein crop up rally kay sath he meltay jultay patte hotay hein or basic tor parjadeed technical analysis ka he estamal karta hey
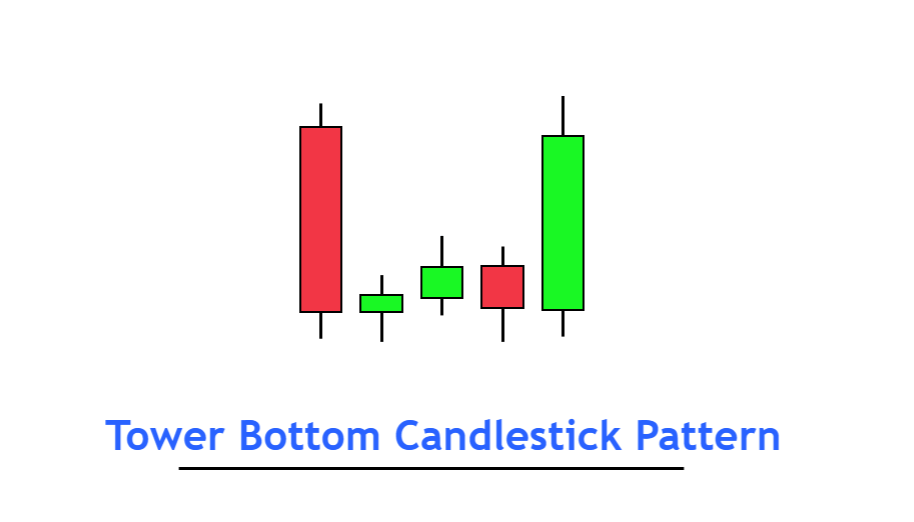

    Pehchan Tower Bottom Candlestick Pattern

    forex market mein pehle candlestick bearish candlestick hote hey or es candlestick say pehlay trend bearish ka he hota hey
    pehle bearish candlestick kaybad teen say 5 base candlestick hote hein s kay bad forex markeet mein chote doji spinning wale candlestick he hote hey body say wick ke ratio 25% he ho sakte hey es ka matlab yeh hota hey keh forex market mein body small ho sakte hey o forex market kay shadow zyada hota hein
    forex market ke end mein candlestick bare bearish candlestick hote hey es candlestick ke 50% bod Fibonacci kay ope ja kar close ho jate hey
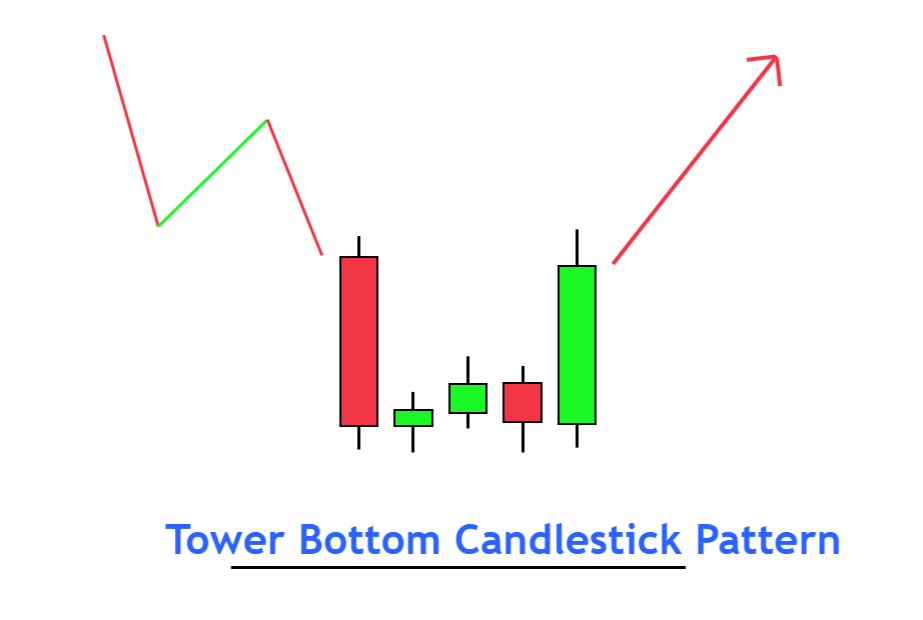


    Understanding Tower Bottom Candlestick Pattern

    forex market mein bearish trend kay bad end mein bare he bearish candlestick ban jay ge jes say zahair hotay hein keh forex market mein seller control mein he hotay hein or price ko kam karnay kay ley apni total raftar ko he kam kar saktay hein
    forex market mein selle nay apni total raftar stamal kar le hote hey buyer nay ab bhe apni seller ke raftar kay ley shakest daynay kay ley kafe nahi hotay hein yeh he wajah hey keh price aik limit mein price kay structure ke taraf he hota hey
    side way market kaybad aik bare bullish candlestick ban jay ge jes say yeh zahair hota hey keh buyer he control mein hotay hein or forex market ka trend badal jay ga
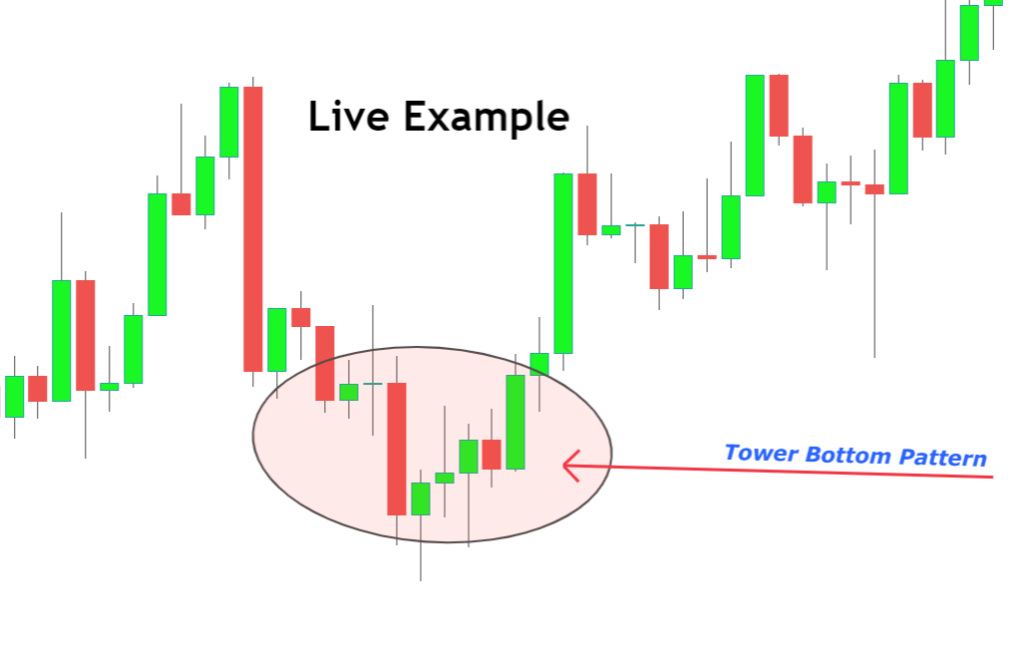

    Best Working with Tower Bottom Candlestick Pattern

    foex market mein zyada imkane trading set up hasel karnay kay ley hum forex market mein dosray technical allat or indicator ka he estamal kar saktay hein trading strategy ke winning ke ratio ko he increase kar saktay hein

    Demand zone ya support zone

    tower bottom candlestick kay sath he en key levels or indicator ko he shamel karna chihay jo keh bullish trend reversal kay imkan ko he behtar kar saktay hein

    Oversold Condition

    forex market mein RSI indicator kay sath shamel kar kay estamal kartay hein karkardge ko behtar kartay hein
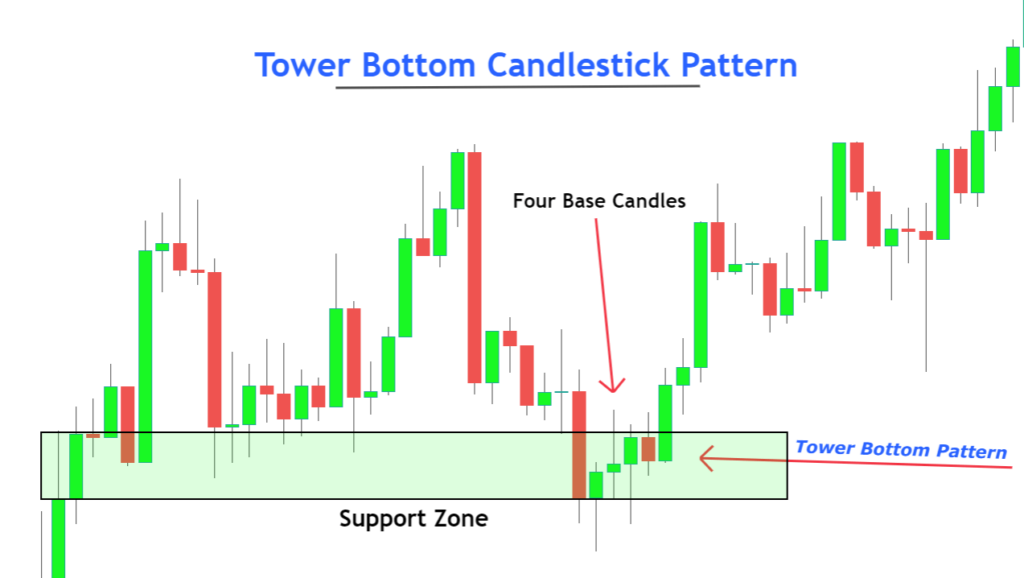
    bhali kay badlay bhali
  • <a href="https://www.instaforex.org/ru/?x=ruforum">InstaForex</a>
  • #2 Collapse

    Tower Bottom candlestick pattern aik reversal pattern hai jo aksar market ke bottom par bantay hai. Is pattern ka naam "Tower" is liye rakha gaya hai kyun ke yeh pattern aik uncha aur mustaqil structure banata hai, jo market ke niche se uper jane ka ishara hota hai. Jab yeh pattern banay, to is ka matlab yeh hota hai ke market ke sellers ab weak ho chuke hain aur buyers ne control le liya hai. Is pattern ko samajhna aur is par amal karna traders ke liye kafi faida mand sabit ho sakta hai.

    Buying Signal ka Pehla Indication

    Tower Bottom pattern ka sabse bara faida yeh hai ke yeh traders ko market mein buying signal ka pehla indication de sakta hai. Jab yeh pattern dikhayi day, to iska matlab yeh hai ke market ab bullish trend mein enter ho sakti hai. Is se pehle ke market mein buying pressure ziada ho, traders is pattern ke zariye achi entry kar sakte hain. Yeh pattern aksar do se teen candles ka hota hai, jisme pehli candle bearish aur doosri candle bullish hoti hai, aur phir market uper ki taraf move karti hai.

    Trend Reversal ki Pehchan

    Aik aur bara faida Tower Bottom pattern ka yeh hai ke yeh trend reversal ki pehchan hai. Jab market mein bearish trend chal raha hota hai aur yeh pattern banay, to yeh indicate karta hai ke ab market mein reversal aane wala hai.

    Click image for larger version

Name:	images (9).jpeg
Views:	23
Size:	18.1 کلوبائٹ
ID:	13108667

    Yeh pattern aksar long-term trend changes ka indicator hota hai. Traders is pattern ka istimaal karke apne positions ko adjust kar sakte hain aur apni trading strategy ko accordingly modify kar sakte hain.

    Risk Management mein Madad

    Tower Bottom pattern ka aik aur ahm faida yeh hai ke yeh traders ko risk management mein madad karta hai. Kyun ke yeh pattern reversal ka indication deta hai, traders is pattern ke zariye apne stop-loss ko properly set kar sakte hain. Is se yeh hota hai ke agar market unki expectations ke mutabiq nahi chali, to unko ziada nuksan nahi hoga. Risk management trading mein intehai zaroori hota hai, aur Tower Bottom pattern is mein kafi madadgar sabit ho sakta hai.

    Market Sentiment ko Samajhna

    Akhir mein, Tower Bottom pattern traders ko market sentiment ko samajhne mein madad deta hai. Jab yeh pattern banta hai, to iska matlab yeh hota hai ke market mein bearish sentiment ab khatam ho raha hai aur bullish sentiment ka aghaz ho raha hai. Iska matlab yeh hai ke ab market ke players zyada confident hain aur market ke uper jane ke chances barh gaye hain. Is pattern ka istimaal karke traders market ke overall sentiment ko achi tarah samajh sakte hain aur apne trades ko accordingly place kar sakte hain.

    • #3 Collapse

      Tower bottom candlestick pattern ek mukhsoos technical analysis tool hai jo market reversal ko identify karne mein madad karta hai. Ye pattern aksar ek downtrend ke baad develop hota hai aur yeh signal deta hai ke market niche ke point par hai aur agle phase mein bullish trend shuru ho sakta hai.
      Is pattern ki shakal ko samajhna zaroori hai. Tower bottom pattern do candlesticks se milkar bana hota hai. Pehli candlestick ek long bearish candlestick hoti hai jo market mein zyada girawat ko darshati hai. Iske baad ek second candlestick aati hai jo ek chhoti bullish candlestick hoti hai. Ye chhoti bullish candlestick pehli candlestick ke nishaan se neeche banayi jaati hai. Iske baad, agar market mein ek achhi bullish candlestick develop hoti hai, toh ye pattern confirm hota hai aur isse market ke bullish trend ke shuru hone ki ummeed hoti hai.

      Tower bottom pattern ko samajhne ke liye, hume ye dekhna hota hai ke pehli candlestick ke baad market kis tarah se react kar rahi hai. Agar market ki reaction positive hoti hai aur price levels improve hote hain, toh ye pattern bullish reversal ko darshata hai. Is pattern ke confirmation ke liye, traders ko ye dekhna hota hai ke second candlestick ke baad market mein buying pressure barh raha hai ya nahi.

      Is pattern ke trading strategy mein, traders aksar is pattern ko ek buying signal ke roop mein dekhte hain. Jab pattern confirm hota hai, toh traders market mein entry point dhoondte hain aur apni buying positions ko open karte hain. Iske sath hi, stop loss levels bhi set kiye jaate hain taake agar market expected direction mein move na kare, toh losses ko minimize kiya ja sake.

      Tower bottom pattern ko analyse karte waqt, volume bhi important hota hai. Acha trading volume pattern ke confirmation ko majbooti deta hai. Jab volume high hota hai aur price increase hoti hai, toh ye pattern aur bhi zyada reliable ban jata hai. Volume analysis ke bina, pattern ke signals accurate nahi ho sakte aur traders ko galat decisions lene ka risk hota hai.

      Ye bhi zaroori hai ke tower bottom pattern ko other technical indicators ke sath combine kiya jaye. Moving averages, RSI (Relative Strength Index), aur MACD (Moving Average Convergence Divergence) jaise indicators is pattern ke signal ko confirm karne mein madadgar sabit ho sakte hain. In indicators ke sath pattern ki analysis karne se traders ko better insights milte hain aur unki trading decisions aur bhi informed aur accurate ban jaati hain.

      Is pattern ke saath patience bhi zaroori hoti hai. Market ko react karne aur bullish trend ko establish karne mein waqt lag sakta hai. Traders ko chahiye ke wo market movements ko closely monitor karein aur pattern ke signals ko samajhne ki koshish karein. Agar pattern ke confirmation signals clear hain, toh trading strategy ko apply karna beneficial ho sakta hai. Lekin hamesha yaad rakhein ke kisi bhi trading strategy ko follow karte waqt risk management ko priority deni chahiye.
      • #4 Collapse

        Tower bottom candlestick pattern aik bullish reversal pattern hota hai jo market ke downtrend ke end par ban'ta hai. Yeh pattern usually do phases par mushtamil hota hai: pehla phase strong bearish candles ka hota hai, aur doosra phase bullish reversal candles ka. Tower bottom pattern ka aim yeh hota hai ke market ke downtrend ke baad ek reversal signal dena. Yani jab yeh pattern ban'ta hai, to yeh suggest karta hai ke price neechey jane ke baad ab upar janay wali hai.
        Is pattern ka pehla part kaafi aggressive selling ka hota hai. Market mein sellers dominate karte hain aur price rapidly neechey girti hai. Yeh downfall kuch consecutive bearish candles se represent hota hai jo ke ek straight downward movement ko dikhata hai. Yeh portion ek tower ke base ki tarah lagta hai, jo ke is pattern ka naam bhi justify karta hai.

        Iske baad, market mein ek consolidation phase aata hai jismein price kisi specific range mein ghoomti rehti hai, aur selling pressure dheere dheere kam hota hai. Buyers market mein interest lena shuru karte hain aur buying ka pressure barh jata hai. Yeh turning point hota hai, jahan se market mein reversal ki umeed hoti hai.

        Doosra phase bullish reversal candles ka hota hai. Jab market downtrend ke baad stabilize hoti hai, to ek strong bullish candle banti hai jo ke market mein naye buyers ki entry ko dikhati hai. Yeh candle kaafi important hoti hai kyun ke yeh confirm karta hai ke selling khatam ho gayi hai aur ab buyers dominate karenge. Price rapid upar ki taraf move karna shuru karti hai aur market mein bullish momentum wapis aata hai.

        Tower bottom pattern kaafi reliable hota hai jab yeh strong support level par banta hai. Support level woh zone hota hai jahan se price pehle bhi bounce back karti rahi hoti hai. Jab is pattern ke saath volume bhi increase hota hai, to yeh ek aur confirmation hota hai ke market mein reversal honay wala hai.

        Yeh pattern trading mein kaafi use hota hai, khas tor par un traders ke liye jo bottom pe buy karna chahte hain. Magar zaroori hai ke traders proper analysis karein aur doosri confirmations ko bhi dekhein, jese ke volume, moving averages, aur technical indicators jaise RSI (Relative Strength Index) ya MACD (Moving Average Convergence Divergence) ko dekhein. Yeh indicators additional confirmation dete hain ke trend reversal genuine hai.

        Tower bottom pattern hamesha successful nahi hota, aur kabhi kabhi false signals bhi de sakta hai, is liye risk management ka hona bhi zaroori hai. Stop loss ka istemal karna chahiye takay agar market unexpected direction mein jaye to losses control mein rahein. Iske ilawa, profit-taking strategy bhi zaroori hai takay jab market upward move kare to profits ko secure kiya ja sake.

        Is pattern ko dekh kar traders yeh andaza laga sakte hain ke downtrend ka end nazdeek hai, lekin hamesha yeh zaroori nahi ke price immediately upar chale jaye. Kabhi kabhi market consolidation ke baad phir se neeche bhi ja sakti hai. Is liye patience aur market ka barabar analysis karna kaafi important hota hai.

        Tower bottom pattern trading ka ek important tool hai, magar isko effectively use karna tabhi mumkin hai jab aap market ka proper analysis karein aur other confirmations ka intezar karein. Yeh pattern batata hai ke market mein downtrend end ho raha hai aur buyers ab dominate karenge, lekin hamesha apni strategy mein risk aur money management ko zaroor shamil karna chahiye.
        • #5 Collapse

          Tower Bottom Candlestick Pattern

          Tower Bottom Candlestick Pattern ek reversal pattern hai jo forex trading mein use hota hai. Ye pattern market ke bearish trend ke baad banta hai aur isse bullish reversal ka indication mana jata hai. Yeh pattern tab banta hai jab price ek downtrend mein hoti hai aur uske baad ek strong upward move aata hai, jo market mein trend reversal ki nishani hoti hai.

          Pattern Formation:
          1. Bearish Phase:
            • Pattern ki shuruaat ek strong bearish trend se hoti hai jahan candles consistently lower lows aur lower highs banati hain. Yeh phase market mein selling pressure ko dikhata hai.
          2. Consolidation Phase:
            • Iske baad, market consolidate hoti hai jahan price movement narrow ho jata hai aur small-bodied candles banti hain. Yeh consolidation phase ek base banata hai jo market mein selling pressure ke kam hone ka indication hota hai.
          3. Bullish Reversal:
            • Pattern ka last phase ek strong bullish candle se hota hai jo previous consolidation phase ko engulf karti hai. Yeh candle is baat ka indication hoti hai ke market mein buying pressure wapas aa gaya hai aur trend reverse ho raha hai.

          Click image for larger version

Name:	images (27).png
Views:	21
Size:	2.8 کلوبائٹ
ID:	13108831

          Key Characteristics:
          • Downtrend: Tower Bottom pattern tabhi banta hai jab market ek established downtrend mein hoti hai.
          • Base Formation: Pattern ke beech mein small candles se ek base banta hai jo selling pressure ke khatam hone ko dikhata hai.
          • Bullish Breakout: Pattern ka end ek bullish breakout se hota hai jo trend reversal ko confirm karta hai.

          Click image for larger version

Name:	images (28).png
Views:	19
Size:	8.0 کلوبائٹ
ID:	13108830

          How to Trade the Tower Bottom Pattern:
          1. Identification: Pattern ko identify karte waqt pehle downtrend ka hona zaroori hai. Iske baad small-bodied candles ke cluster ko observe karna hota hai jo base formation dikhata hai.
          2. Confirmation: Jab ek strong bullish candle previous consolidation ko break karte hue close hoti hai, to ye pattern ka confirmation hota hai.
          3. Entry Point: Bullish candle ke close hone ke baad next candle ke open par buy position le sakte hain.
          4. Stop Loss: Stop-loss ko previous low ke just niche set karna chahiye taake risk management ensure ho sake.
          5. Take Profit: Take-profit level ko apni trading strategy ke mutabiq set karna chahiye, lekin ye zaroori hai ke aap ek favorable risk-reward ratio maintain karein.
          Click image for larger version

Name:	images (29).png
Views:	26
Size:	22.3 کلوبائٹ
ID:	13108829

          Conclusion:

          Tower Bottom Candlestick Pattern ek reliable bullish reversal pattern hai jo market ke bearish trend ke baad banta hai. Is pattern ka sahi istemal karke traders apni trading strategy ko enhance kar sakte hain aur potential profits hasil kar sakte hain. Lekin, har trading pattern ki tarah, Tower Bottom pattern ko bhi doosre technical indicators ke sath combine karna chahiye taake aapke decisions aur bhi strong aur confirm ho sakein.
          • #6 Collapse

            **Tower Bottom Candlestick Pattern**
            Tower Bottom candlestick pattern ek reversal pattern hai jo market ke niche se upar ki taraf shift ko indicate karta hai. Yeh pattern bearish trend ke baad banta hai, jab market apni low point tak pohanch jata hai aur uske baad ek bullish trend shuru hota hai. Is pattern ka naam "Tower Bottom" is liye diya gaya hai kyun ke yeh market ke bottom par ek tower jaisa structure banata hai, jahan price pehle girti hai aur phir wapas upar chali jati hai.

            Tower Bottom pattern do phases mein divide hota hai. Pehla phase bearish candles ka hota hai jo price ko consistently niche le jati hain. Yeh phase tab tak chalta hai jab tak market apni low point tak nahi pohanch jata. Is phase mein market mein selling pressure zyada hota hai aur buyers ki interest kam hoti hai.

            Dusra phase bullish candles ka hota hai jo price ko wapas upar le jati hain. Yeh phase tab shuru hota hai jab buyers market mein wapas aate hain aur selling pressure kum ho jata hai. Is phase mein bullish candles kaafi strong hoti hain jo market mein positive sentiment ko reflect karti hain.

            Tower Bottom pattern ko identify karne ke liye traders ko market ke low point par ek series of bearish candles dekhni chahiye, jo ke pehle phase ka indication hoti hai. Iske baad, jab bullish candles shuru hoti hain aur price wapas upar jata hai, to yeh dusra phase hota hai. Yeh pattern usually tab banta hai jab market mein overselling ho chuki hoti hai aur buyers ka interest wapas badh raha hota hai.

            Is pattern ke banne ke baad, traders ko confirmatory signals ka intezar karna chahiye jaise ke volume increase ya kisi aur technical indicator ka bullish signal. Agar yeh confirmation mil jaye, to yeh ek strong indication hoti hai ke market mein bullish reversal ho raha hai aur yeh ek achha entry point ho sakta hai.

            Tower Bottom candlestick pattern ka use karke traders market ke trend reversals ko identify kar sakte hain aur unke basis par apne trades plan kar sakte hain. Yeh pattern specially un traders ke liye beneficial hai jo market ke bottoms pe buying opportunities dhoondte hain. Lekin, hamesha yaad rakhein ke koi bhi pattern 100% accurate nahi hota, isliye risk management aur proper analysis zaroori hai.
            • #7 Collapse

              **Tower Bottom Candlestick Pattern**
              1. **Ta'aruf:**
              - Tower Bottom candlestick pattern ek bullish reversal pattern hai jo market ke bottom me banta hai. Yeh pattern downtrend ke baad price ke reversal ka signal deta hai aur trend ke badalne ki nishani hota hai.

              2. **Pattern Ki Shakal:**
              - Tower Bottom pattern me aksar 4 ya 5 candlesticks shamil hoti hain:
              1. **Pehli Phase (Bearish Candles):** Pattern ke shuruat me lagatar bearish candles banti hain jo market me downtrend ko continue karti hain.
              2. **Doosri Phase (Bullish Candles):** Bearish candles ke baad bullish candles ka silsila shuru hota hai jo previous bearish candles ke range ko engulf karti hain.

              3. **Formation:**
              - Yeh pattern tab banta hai jab market ek strong downtrend me hota hai aur bearish candles continuously banti hain. Uske baad market suddenly reverse hota hai aur bullish candles form hoti hain jo pehle ki bearish candles ko engulf kar leti hain.

              4. **Signal:**
              - Tower Bottom pattern ka signal bullish reversal hota hai. Jab yeh pattern form hota hai, to yeh indicate karta hai ke market me selling pressure khatam ho raha hai aur buying pressure badhne wala hai. Is signal ke baad market me upward move expected hota hai.

              5. **Confirmation:**
              - Is pattern ki confirmation tab hoti hai jab bullish candles pehli bearish candles ki range ko engulf kar leti hain aur market uske baad upar ki taraf move karta hai. Confirmation ke liye higher trading volume bhi dekha jata hai.

              6. **Risk Management:**
              - Is pattern ko trade karte waqt risk management important hota hai. Stop loss ko previous low ya bearish candle ke niche lagaya jata hai taake market ke against move karne ki surat me loss control ho sake.

              7. **Trading Strategy:**
              - Tower Bottom pattern ke baad buying positions ko open karna best strategy hota hai, lekin ensure karein ke pattern clear ho aur uske baad ek solid bullish move aaye. Entry points ke liye pattern ki confirmation ka wait karna zaroori hai.

              8. **Example:**
              - Agar market ek prolonged downtrend me hai aur ek point par bearish candles ke baad lagatar bullish candles banni shuru ho jati hain jo previous bearish candles ki range ko engulf kar rahi hain, to yeh Tower Bottom pattern ho sakta hai.

              9. **Importance:**
              - Tower Bottom pattern aksar market ke bottoms par dekha jata hai, aur yeh ek strong reversal signal ke tor par use hota hai. Yeh pattern long-term trends me significant hote hain aur major price reversals indicate karte hain.

              10. **Limitations:**
              - Har candlestick pattern ki tarah, Tower Bottom pattern bhi 100% accurate nahi hota. Is pattern ko doosre technical indicators ke sath combine karke use karna chahiye taake zyada reliable trading decisions liye ja sakein.

              Tower Bottom candlestick pattern ko sahi tareeqe se pehchanna aur uska jaiza lena trading me faidemand ho sakta hai, khaaskar jab aap market ke bottom se entry points dhundh rahe hon.
              • #8 Collapse

                Tower bottom candlestick pattern:
                As salam o alaikum dosto, Tower Bottom, ik bullish reversal candlestick pattern hy jo market ke trend ko indicate karta hy. Is pattern main, ik bearish trend ke baad price main sharp decline hota hy or phir ik lambi bullish candle aati hy jo indicate karta hy ke bearish trend khatam ho sakta hy or ab bull market shuru ho sakti hy.Yeh price ke chart ke bottom Banega Yah market ke trend Main Bearish se bullish trend Main slow change ki indicate karta hy drop base rally se similar structure ki vajah se ik high probability trading set up hy and Mainly advanced technical analysis Main used Hota Hy Bearish ke Trend ke bad Ik last big bearish candlestick ban Jayegi jisse zahar Hota Hy ke sellers complete control main hy and price per decrease karne ke liye aapni total momentum ka used kar sakte hein supply and demand se Relevance ki vajah se yah ik high probability candlestick pattern hy is pattern ki trading psychology price ko janne ki try Karen sellers ne apni total Momentum use kar li hy and buyers market main aaenge ab, buyers ke pass Momentum nahi hy ke vah sellers ko beat De saken yahi vajah hy ke price ab Ik ranging Tak price ke structure Main Ik Taraf Chali Jayegi.

                Important information of Tower bottom candlestick pattern:
                1. Downward Trend: Pehle, market main ik clear bearish trend hona chahiye.
                2. Sharp Decline: Bearish trend ke doran, ik sharp decline hota hy jiska result main ik ya ik se zyada bearish candles aati hein. Ye decline market ke weakness ko darust karti hy.
                3. Lambi Bullish Candle: Tower Bottom pattern ka sabse ahem hissa ik lambi bullish candle hoti hy jo downward trend ke baad aati hy. Is candle main market main strong buying activity hoti hy, jisse ke price main significant increase hota hy.
                4. Confirmation Candles: Tower Bottom pattern ko confirm karne ke liye, traders doosre bullish candles ya technical indicators ka istemal karte hein. Agar doosre bullish candles bhi aati hein or market main volume bhi badh raha hy, to ye pattern strong hota hy.

                Main Features of tower bottom candlestick pattern:
                1. Reversal Signal: Tower Bottom pattern bearish trend ko indicate karta hy or bullish reversal ka signal deta hy.
                2. Strong Buying Interest: Is pattern main dikhaye gaye lambi bullish candle main strong buying interest ka pata chalta hy, jo market sentiment ko badal sakta hy.
                3. Volume Confirmation: Traders volume ko bhi dikhte hein pattern ko confirm karne ke liye. Agar pattern ke sath high volume hota hy, to uska impact zyada hota hy.
                4. Price Confirmation: Doosre bullish candles ya price action patterns ke sath combine karke Tower Bottom pattern ko confirm karna important hy.

                Click image for larger version

Name:	tw.png
Views:	19
Size:	10.4 کلوبائٹ
ID:	13114142
                • #9 Collapse

                  Tower Bottom Candlestick Pattern in Forex Trading

                  Forex trading mein kai aise candlestick patterns hain jo market ki direction ko samajhne mein madadgar sabit hote hain. In mein se ek important pattern hai Tower Bottom Candlestick Pattern, jo market ke reversal ko indicate karta hai. Is article mein hum is pattern ko tafseel se discuss karenge aur iske istemal aur signal ko samajhne ki koshish karenge.
                  1. Tower Bottom Candlestick Pattern Kya Hai?


                  Tower Bottom ek reversal candlestick pattern hai jo downtrend ke baad aata hai aur market ke bullish hone ka signal deta hai. Is pattern ko dekh kar trader samajh sakte hain ke ab market neeche se uthkar upar jaane wala hai, yani bearish se bullish ho raha hai.
                  2. Pattern Ban'ne Ka Tareeqa


                  Ye pattern tab banta hai jab ek lambe bearish trend ke baad market mein sudden bullish movement hoti hai. Yeh do phases par mushtamil hota hai; pehla bearish phase jo market ke niche jaane ko reflect karta hai, aur doosra bullish phase jo market ke upar jaane ki nishani hota hai.
                  3. Is Pattern Ka Strukture


                  Tower Bottom pattern do ya zyada candlesticks se milkar banta hai. Pehle kuch candles bearish hoti hain jo market ke downward trend ko dikhati hain, lekin baad mein bullish candles is trend ko reverse kar deti hain. Is pattern ka overall structure ek tower jaisa hota hai, is liye isay "Tower Bottom" kaha jata hai.
                  4. Market Psychology Behind the Pattern


                  Market psychology ke mutabiq, jab bearish phase apni peak par hota hai, toh sellers dominate karte hain. Lekin ek point aata hai jab buyers market mein wapas aate hain aur prices ko upar dhakel dete hain. Yeh tab hota hai jab market oversold hoti hai aur buyers ko lagta hai ke yeh buying ka achha mauka hai.
                  5. Pattern Ki Importance


                  Tower Bottom pattern ki importance is liye bhi hai ke yeh market mein potential trend reversal ko pehchan'ne mein madad karta hai. Yeh ek strong bullish reversal signal deta hai aur trader ko market mein position enter karne ka mauka faraham karta hai jab market upward trend mein shuru ho rahi ho.
                  6. Pattern Ki Shanakht Kaise Karein?


                  Tower Bottom pattern ko shanakht karna mushkil nahi hai. Pehle bearish candles ko dekhna hota hai jo lower lows bana rahi hoti hain. Iske baad ek ya zyada bullish candles aati hain jo market ko reverse kar deti hain. In bullish candles ka size aur volume zyada hota hai jo is baat ki nishani hai ke buyers market mein aagaye hain.
                  7. Pattern Ka Timeframe


                  Tower Bottom pattern ko different timeframes par observe kiya ja sakta hai, lekin yeh zyada effective long-term charts, jaise ke daily ya weekly charts par hota hai. Short-term timeframes par yeh pattern kaafi signals de sakta hai, lekin inki reliability utni nahi hoti jitni ke lambe timeframes par.
                  8. Entry Aur Exit Points


                  Is pattern ko dekh kar trader apni entry aur exit strategy ko tay kar sakte hain. Jab bullish candle close hoti hai, toh yeh ek strong signal hota hai entry ka. Is pattern ke baad market mein bullish momentum hota hai, toh trader ko apne targets ko accordingly set karna chahiye.
                  9. Stop Loss Strategy


                  Jab bhi aap Tower Bottom pattern ke basis par trade karte hain, stop loss lagana buhat zaroori hai. Stop loss ko bearish candles ke niche lagana chahiye taake agar market wapas bearish ho jaye toh aapka risk limited rahe. Yeh ek important risk management tool hai jo aapki capital ko protect karta hai.
                  10. Pattern Ki Success Rate


                  Is pattern ki success rate kaafi high hoti hai jab yeh strong support zone mein banta hai. Lekin, har pattern ki tarah, yeh bhi 100% accurate nahi hota. Is liye traders ko doosre indicators aur analysis ke sath mil kar is pattern ko use karna chahiye taake confirmation mile aur false signals se bacha ja sake.
                  11. Tower Bottom Pattern Ka Combination Dusre Indicators Ke Sath


                  Aksar traders Tower Bottom pattern ko doosre technical indicators ke sath use karte hain jaise ke RSI (Relative Strength Index) ya Moving Averages. Yeh indicators market ki strength aur momentum ko confirm karte hain, jo is pattern ke signal ko aur zyada strong bana dete hain.
                  12. Tower Bottom Pattern Aur Volume


                  Volume ka bhi is pattern mein aham kirdar hota hai. Jab bullish candles ke sath volume increase hoti hai, toh yeh strong confirmation hota hai ke buyers market mein dominate kar rahe hain. Agar bullish movement ke sath volume kaafi zyada ho, toh yeh pattern zyada reliable ho jata hai.
                  13. Is Pattern Ko Kaise Trade Karein?


                  Tower Bottom pattern ko trade karne ke liye sabse pehle is pattern ka intizaar karna hota hai. Jab yeh pattern confirm ho jata hai, toh entry bullish candle ke close hone ke baad leni chahiye. Stop loss ko bearish phase ke niche set karen aur target market ke previous resistance level tak rakhain. Iske ilawa, risk management ka bhi khayal rakhein aur apni strategy ko strictly follow karein.
                  Conclusion


                  Tower Bottom candlestick pattern forex trading mein ek important reversal signal hai jo bearish trend ke baad bullish movement ko indicate karta hai. Yeh pattern traders ko market mein ek profitable entry dene mein madadgar sabit ho sakta hai agar isay theek tareeqe se pehchana jaye aur use kiya jaye.
                  • #10 Collapse

                    Tower Bottom Candlestick Pattern
                    Tower Bottom candlestick pattern ek bullish reversal pattern hai jo aksar bearish market ke end par banta hai. Ye pattern traders ke liye ek achi opportunity ka sign hota hai, kyunki ye price ki potential reversal ki taraf ishara karta hai. Is pattern ki pehchaan karna aur samajhna aasan hai, lekin iska asar samajhne ke liye kuch important points jaanana zaroori hai.

                    Tower Bottom pattern do ya zyada candlesticks se milkar bana hota hai, jismein pehli candlestick ek lambi bearish candlestick hoti hai jo price ko neeche le jaati hai. Iske baad ek ya do chhoti bullish candlesticks banti hain jo market mein kuch recovery dikhati hain. Ye chhoti candlesticks aksar do ya teen baar price ko neeche push karti hain, lekin phir bhi market mein strong buying ka sign dikhati hain.

                    Is pattern ka structure aise hota hai:

                    1. Pehli Candlestick: Ye lambi bearish candle hoti hai jo market ki bearish sentiment ko dikhati hai. Is candle ka close price pehle ke high se kaafi neeche hota hai.


                    2. Chhoti Candlestick: Ye chhoti bullish candlestick ya do chhoti candlesticks hoti hain jo price ko thodi upar le jaati hain. Inka close price pehle se kaafi upar hota hai, jo market mein buying pressure ki taraf ishara karta hai.


                    3. Confirmation: Tower Bottom pattern ka asar tabhi tab hota hai jab market is pattern ke baad ek lambi bullish candlestick banata hai. Ye confirmation bullish trend ke shuru hone ka signal hai.


                    Ye pattern aksar psychological levels ke aas paas banta hai, jahan traders sell positions ko close karte hain, jis se buying pressure badh jata hai. Is pattern ko identify karte waqt volume ka bhi khayal rakhna chahiye. Agar volume badh raha ho to ye pattern zyada reliable hota hai.

                    Tower Bottom pattern ki khasiyat ye hai ke ye sirf price movement se nahi balki market ke sentiments se bhi related hota hai. Jab bhi aap is pattern ko dekhein, to ensure karein ke aapke analysis mein fundamental aur technical factors bhi shamil hon.

                    Is pattern ko samajhne ke baad, aap isse trading decisions mein istamal kar sakte hain. Aapko ye yaad rakhna hoga ke koi bhi trading strategy 100% accurate nahi hoti, isliye hamesha risk management ko apne trading plan ka hissa banayein. Tower Bottom pattern ek valuable tool hai, lekin iska istemal soch samajh kar karna chahiye.


                    • #11 Collapse

                      # Tower Bottom Candlestick Pattern
                      ## Introduction

                      Tower Bottom candlestick pattern, jo ke technical analysis ka aik aham hissa hai, share bazaar ya forex trading mein market reversal ki nishani deta hai. Ye pattern khas tor par downtrend ke baad banata hai aur traders ko ye signal deta hai ke market ab upar ki taraf badhne wala hai. Is article mein hum Tower Bottom pattern ke tamam pehluon ko samjhenge, jise aap apne trading strategies mein istemal kar sakte hain.

                      ## Tower Bottom Ka Tasavvur

                      Tower Bottom pattern do mukhtalif candlesticks par mabni hota hai. Pehli candlestick aksar lambi red body hoti hai, jo ke downtrend ko darust karti hai. Doosri candlestick ka rang green ya bullish hota hai, jo ke market reversal ko darust karta hai. Ye do candlesticks mil kar aik tower ki shakal banati hain, jise is pattern ka naam diya gaya hai.

                      ## Pattern Ki Pehchan

                      Is pattern ko pehchanne ke liye, traders ko do specific criteria ko dekhna hota hai: pehli candlestick ka lamba red hona aur doosri candlestick ka bullish hona. Doosri candlestick ke doraan, agar market ki volatility barh jaye, to ye pattern aur bhi mazid taqatwar ho jata hai.

                      ## Tower Bottom Ka Timeline

                      Tower Bottom pattern ka timeframe bhi buhat ahem hota hai. Ye pattern aksar daily ya weekly charts par nazar aata hai. Jab aap kisi bhi timeframe ka istemal karte hain, to ye ensure karna zaroori hai ke pattern ki clarity aur significant price movement ho.

                      ## Volume Ka Aham Role

                      Trading volume bhi Tower Bottom pattern ko samajhne mein madadgar hota hai. Jab doosri candlestick banti hai, to agar volume zyada hota hai, to ye bullish reversal ki tasdiq karta hai. Acha volume pattern ki mazid tasdiq karta hai, aur traders ko is par amal karne ke liye confident banata hai.

                      ## Trading Strategy

                      Tower Bottom pattern ko istemal karte waqt trading strategy banate waqt kuch aham baaton ka khayal rakhna chahiye. Pehle, entry point ko pehchanne ke liye doosri candlestick ke high ko target karna chahiye. Stop-loss ko pehli candlestick ke low ke neeche rakhna chahiye taake losses ko minimize kiya ja sake.

                      ## Risk Management

                      Har trading strategy mein risk management ki ahemiyat hoti hai. Tower Bottom pattern ke liye, stop-loss ka istemal karke aap apne risks ko control kar sakte hain. Is pattern ko istemal karne wale traders ko chahiye ke wo apne risk-to-reward ratio ko samjhein taake unka trading portfolio safe rahe.

                      ## Market Sentiment

                      Market sentiment bhi Tower Bottom pattern ko samajhne mein madad karta hai. Jab ye pattern banta hai, to traders ko market ki mood ko samajhna chahiye. Agar market bullish hoti hai, to is pattern ka impact zyada hota hai. Isliye, market ki general trend aur sentiment ka khayal rakhna zaroori hai.

                      ## Timeframe Selection

                      Timeframe ka chunaav bhi Tower Bottom pattern ki effectiveness ko badha sakta hai. Agar aap longer timeframe par trade kar rahe hain, to ye pattern zyada significant hota hai. Choti timeframes par patterns ke false signals bhi aasani se mil sakte hain, jo traders ke liye mushkilat paida karte hain.

                      ## Psychological Factors

                      Traders ke psychological factors bhi Tower Bottom pattern ko samajhne mein important role ada karte hain. Jab traders dekhtay hain ke market downtrend mein hai, to wo psychologically bearish ho jate hain. Lekin, jab Tower Bottom pattern nazar aata hai, to ye traders ko bullish banata hai, jo market ki direction ko badal sakta hai.

                      ## Confirmatory Signals

                      Tower Bottom pattern ko confirm karne ke liye doosri technical indicators ka istemal bhi kiya ja sakta hai. Jaise ke RSI, MACD, ya Moving Averages. Ye indicators aapko ye batate hain ke kya market ka momentum bullish hai ya nahi, aur aapko trading decisions lene mein madad karte hain.

                      ## Common Mistakes

                      Traders aksar Tower Bottom pattern ko samajhne mein kuch ghaltiyan karte hain. Aksar log is pattern ko bina kisi confirmatory signals ke trade karte hain, jo ke galat ho sakta hai. Isliye, hamesha dusre indicators ko dekhna zaroori hai aur emotional trading se bachna chahiye.

                      ## Conclusion

                      Tower Bottom candlestick pattern ek ahem tool hai jo traders ko market ki reversal ki pehchan karne mein madad karta hai. Is pattern ko samajhne se traders ko bullish trends ko pehchanne ka mauqa milta hai. Lekin, is pattern ko trade karne se pehle, risk management aur psychological factors ka khayal rakhna zaroori hai. Aakhir mein, trading mein sab kuch analysis par mabni hota hai, aur Tower Bottom pattern bhi is rule ka istisna nahi hai. Trading mein hamesha tayyari aur soch samajh kar chalna zaroori hai.
                      • #12 Collapse

                        Tower Bottom Candlestick Pattern
                        Tower Bottom candlestick pattern ek bullish reversal pattern hai jo market ki bearish trend ke baad banta hai. Yeh pattern do ya zyada candlesticks par mabni hota hai, jisme pehli candlestick lambi bearish hoti hai, jabke doosri candlestick chhoti aur bullish hoti hai. Is pattern ka maqsad market ke sentiment ko samajhna hai, jo ke bearish se bullish mein tabdeel hota hai.

                        Tower Bottom ka pehla element lambi bearish candlestick hoti hai. Yeh candlestick market ke andar maujood bearish pressure ko dikhati hai. Is candlestick ke baad, ek chhoti bullish candlestick aati hai, jo ke bearish trend ki thakan aur reversal ki nishani hoti hai. Agar yeh pattern support level par banta hai, to yeh bullish reversal ki zyada tasdeeq karta hai.

                        Jab aap Tower Bottom pattern ko dekhein, to iski confirmation ke liye kuch cheezon par dhyan dena zaroori hai. Sab se pehla, volume ka dekhna. Agar doosri bullish candlestick ki trading volume zyada hai, to yeh bullish reversal ki tasdeeq karta hai. Iske ilawa, agar market support level par hai, to yeh pattern aur bhi mazid mazboot ho jata hai.

                        Yeh pattern trading ke liye behad faida mand hai. Jab aap is pattern ko samajh lete hain, to aap is se entry point nikaal sakte hain. Jaise hi aap ko Tower Bottom pattern nazar aaye, aap buy order place kar sakte hain. Iske ilawa, stop loss ko pehli bearish candlestick ke low par set karna chahiye, taake agar market is direction mein nahi jata to aapka nuksan kum se kum ho.

                        Tower Bottom candlestick pattern ko samajhne ka ek aur tarika hai ki isse technical analysis ke saath mila kar dekha jaye. Aap is pattern ko other indicators, jaise moving averages ya RSI ke sath mila kar confirm kar sakte hain. Yeh aapko entry aur exit points ko behtar tarike se samajhne mein madad dega.

                        Aakhir mein, Tower Bottom pattern ek ahem trading signal hai jo bullish reversal ko darshata hai. Isse sahi tarike se samajh kar, traders market ke downturns ka faida utha sakte hain aur profit kama sakte hain. Har trader ko is pattern ki pehchaan karni chahiye taake wo apni trading strategy ko behtar bana sake.


                        • #13 Collapse

                          Tower Bottom Candlestick Pattern in Forex Trading

                          1. Tower Bottom Candlestick Pattern ka Ta'aruf
                          Tower Bottom candlestick pattern ek reversal pattern hota hai jo downtrend ke baad market me bullish reversal ka ishara deta hai. Ye pattern aksar forex traders ke liye ahmiyat rakhta hai, kyun ke is se unhein market ke trend ke palatne ka pta chal sakta hai. Is pattern ka zikar trading strategies me bohot zyada hota hai aur iska barhawa technical analysis ke doran diya jata hai.

                          2. Tower Bottom Pattern Ki Pehchan
                          Is pattern ki pehchan karna thoda challenging ho sakta hai lekin jab ek trader is pattern ka structure samajh le to unke liye analysis asan ho jata hai. Tower Bottom pattern do mukhtalif phases me bantta hai; ek extended bearish trend aur phir uske baad bullish reversal ka tasalsul. Jab market me is tarah ke candlesticks nazar aayein jo bottom banayen, to ye ek strong reversal signal hota hai.

                          3. Pattern Ka Structure Aur Formation
                          Tower Bottom pattern ki formation ke doran pehle extended bearish candles banti hain, jo is baat ka ishara deti hain ke market me selling ka pressure hai. Iske baad market me consolidation ya sideways movement hoti hai. Phir achanak se bullish candles banti hain jo indicate karti hain ke buyers market me wapis aa rahe hain. Yehi moment traders ke liye entry signal hota hai.

                          4. Tower Bottom Ka Role Market Reversals Mein
                          Ye pattern aksar bearish market ke baad ubharta hai aur bullish reversal ka zikar karta hai. Jab koi trader is pattern ko pehchan leta hai to wo market ke against sell karne ke bajaye buying ki taraf dhyan de sakta hai. Ye pattern ek reliable signal provide karta hai ke market ka trend badalne wala hai, jo traders ke liye profitable ho sakta hai.

                          5. Pattern Ka Timeframe
                          Is pattern ko dekhne ke liye aapko mukhtalif timeframes ka analysis karna hota hai. Ye pattern chhote aur bare timeframes dono me ban sakta hai. Magar, hamesha higher timeframes par iski importance aur reliability zyada hoti hai. Agar aap is pattern ko daily ya weekly chart par dekhte hain to ye aur bhi powerful signal provide karega.

                          6. Entry Points Ka Tayiun
                          Jab Tower Bottom pattern form hota hai to entry points ka tayyun bohot ahmiyat rakhta hai. Aapko us waqt entry leni chahiye jab bearish trend ke baad consolidation phase khatam ho aur bullish candles dikhai dene lag jayein. Entry ka waqt dekh kar aap apna risk minimize kar sakte hain aur profit potential barha sakte hain.

                          7. Stop Loss Aur Risk Management
                          Is pattern ke doran stop loss lagana zaroori hai taake agar market wapis bearish ho jaye to aapko ziada nuksan na ho. Aap apna stop loss usually last bearish candle ke neeche lagate hain, jahan se market ka reversal expected hota hai. Risk management ke bagair trading karna hamesha nuqsan de ho sakta hai, isliye hamesha apna stop loss define karna chahiye.

                          8. Profit Targets Aur Exit Strategy
                          Tower Bottom candlestick pattern ke baad aapko apne profit targets ka bhi tayyun karna hota hai. Aksar traders fibonacci retracement levels ya previous resistance levels ko apne profit targets ke liye use karte hain. Exit strategy define karna zaroori hota hai, taake aap waqt par profit lock kar sakein.

                          9. Pattern Ki Confirmation Indicators Ke Saath
                          Is pattern ki confirmation ke liye aap kuch additional technical indicators ka bhi istemal kar sakte hain. Moving averages, RSI, aur MACD indicators aksar is pattern ke saath use kiye jate hain taake reversal ki strength ko samjha ja sake. Jab in indicators se bhi bullish reversal ka signal mile to aapka pattern aur bhi zyada reliable ban jata hai.

                          10. Tower Bottom Pattern Aur Volume Analysis
                          Volume analysis bhi is pattern ki confirmation ke liye important hoti hai. Jab market me bearish trend ke baad consolidation phase hoti hai aur bullish reversal ke waqt volume me izafa hota hai, to ye strong indication hota hai ke market ka trend palatne wala hai. High volume ke saath Tower Bottom pattern ka ban-na ek reliable signal deta hai.

                          11. Common Mistakes Jo Traders Kartay Hain
                          Aksar traders Tower Bottom pattern ke doran kuch common galtiyan karte hain, jese ke entry points ko miss karna ya bina stop loss ke trade karna. Is pattern me patience zaroori hoti hai, kyun ke market ko consolidation phase me waqt lag sakta hai. Agar aap jaldbazi me entry lete hain to nuksan ka khatra barh jata hai.

                          12. Tower Bottom Pattern Vs. Other Reversal Patterns
                          Tower Bottom pattern ka comparison agar doosre reversal patterns ke sath kiya jaye to ye kaafi reliable signal hai, lekin har reversal pattern ki tarah isme bhi ek consolidation phase hoti hai jo doosre patterns se ise distinct banata hai. Doosre reversal patterns me bhi consolidation hoti hai lekin Tower Bottom me consolidation ka dor lamba hota hai jo iski khasiyat hai.

                          13. Real-Life Example Aur Application
                          Real-life market charts me is pattern ko dekh kar traders apne liye profitable trades kar sakte hain. Agar aap history me jayen to aapko kayi forex pairs me Tower Bottom pattern ke baad major market reversals milenge. Trading ke doran hamesha chart history ka study karna aur patterns ko pehchan-na important hota hai.

                          14. Final Thoughts Aur Conclusion
                          Tower Bottom candlestick pattern ek strong reversal pattern hai jo forex trading me aksar dekhne ko milta hai. Is pattern ko samajh kar aur indicators ke sath confirm kar ke aap profitable trades kar sakte hain. Risk management aur patience is pattern me bohot important role play karte hain. Har trader ko is pattern ko apne trading strategy ka hissa banana chahiye taake wo market reversals ka faida utha sakein aur apne profits ko barha sakei.
                          • #14 Collapse

                            ### Tower Bottom Candlestick Pattern
                            #### 1. Tower Bottom Kya Hai?
                            Tower Bottom ek candlestick pattern hai jo market ke reversal ki taraf ishara karta hai. Yeh pattern aksar downtrend ke doran banta hai aur yeh dikhaata hai ke selling pressure kam ho raha hai. Is pattern ka pehla candlestick long bearish hota hai, jis ke baad ek do bullish candlesticks aate hain jo market ki upar ki taraf movement ko darshate hain.

                            #### 2. Pattern Ka Banawat
                            Tower Bottom ka pattern do main candlesticks par mabni hota hai. Pehla candlestick downtrend ke dauran banta hai aur iski length zyada hoti hai, jo market mein bearish sentiment ko darshata hai. Dosra candlestick pehla se chota hota hai lekin bullish hota hai. Yeh pattern market ke reversal ko darshata hai, jahan buyers market ko control karne lagte hain.

                            #### 3. Pehla Candlestick
                            Is pattern ka pehla candlestick bohot zyada bearish hota hai. Iski closure price pichlay din ki closure price se kaafi neeche hoti hai, jo market ke momentum ki taqat ko darshata hai. Yeh candlestick market mein selling pressure ko darshata hai aur investor ko is baat ka ehsaas dilata hai ke abhi bhi market ke andar kamzor log hain.

                            #### 4. Dosra Candlestick
                            Dosra candlestick tower bottom ka part hai aur yeh bullish hota hai. Yeh pehla candlestick se chota hota hai, lekin iska closure price pehle candlestick ke closure se upar hota hai. Iska matlab yeh hai ke buyers market mein ghus rahe hain aur selling pressure kum hota ja raha hai.

                            #### 5. Pattern Ki Pehchaan
                            Tower Bottom pattern ko pehchanne ke liye aapko candlestick charts par nazar rakhni hogi. Pehle candlestick ka long bearish hona aur doosra candlestick ka bullish hona zaroori hai. Iske alawa, aakhri candlestick ki body bhi zyada lambi nahi honi chahiye, is se bullish trend ki tasveer aur mazid mazboot hoti hai.

                            #### 6. Volume Ki Ahmiyat
                            Tower Bottom pattern ka volume bhi kafi ahmiyat rakhta hai. Jab yeh pattern banta hai to volume ka badhna is baat ka ishaara hai ke market mein interest badh raha hai. Is volume ki barhoti bullish sentiment ko darshati hai, jo traders ko ye samajhne mein madad karti hai ke ab buyers dominate kar rahe hain.

                            #### 7. Target Aur Stop Loss
                            Is pattern ko istemal karte waqt target aur stop loss ka tayun karna zaroori hai. Aam tor par aap pehle candlestick ke low se thoda upar stop loss rakhte hain. Target ka tayun karne ke liye aap bullish candlestick ke height ko nazar mein rakhte hain. Yeh aapko ek realistic target dene mein madad karega.

                            #### 8. Time Frame Ka Istemal
                            Tower Bottom pattern ko kisi bhi time frame par dekha ja sakta hai, lekin daily ya weekly charts par iska asar zyada hota hai. Aam tor par lower time frames par yeh pattern fake signals de sakta hai, isliye hamesha higher time frames par focus karna behtar hota hai.

                            #### 9. Risk Management
                            Har trading strategy ki tarah, Tower Bottom pattern ka istemal karte waqt risk management par focus karna zaroori hai. Aapko apne account ka chhota hissa ek trade par risk karna chahiye. Is tarah aap apne losses ko control mein rakh sakte hain aur market ke volatile nature se bach sakte hain.

                            #### 10. Market Sentiment Ka Jaiza
                            Tower Bottom pattern ka istemal karte waqt market sentiment ka jaiza lena bhi zaroori hai. Agar overall market bearish hai lekin aapko Tower Bottom pattern nazar aata hai, to aapko apne analysis ko mazid mazboot karna chahiye. Market ke general trend se alag chalna risky ho sakta hai.

                            #### 11. Example Trading Scenario
                            Misaal ke taur par, agar aapko kisi stock ka Tower Bottom pattern nazar aata hai jo pichlay kuch dinon se gir raha hai, to aap pehle candlestick ko dekhein. Agar iska volume badh raha hai aur doosra candlestick bullish hai, to aap trade enter karne ka soch sakte hain. Iske liye stop loss ka tayun zaroor karein.

                            #### 12. Conclusion
                            Tower Bottom candlestick pattern ek powerful tool hai jo traders ko market ke reversal points par entry dene mein madad karta hai. Is pattern ko sahi tareeqe se samajhkar, aap apne trading decisions ko behtar bana sakte hain. Hamesha yaad rahe ke market mein koi bhi strategy 100% kaam nahi karti, lekin sahi analysis se aap apni success ki chances badha sakte hain.

                            #### 13. Aakhri Baat
                            Trading mein patience aur discipline bohot zaroori hain. Tower Bottom pattern ko samajhna aur uska sahi istemal karna aapko profitable trades tak le ja sakta hai. Is pattern ka istemal karte waqt apne emotions par control rakhna na bhoolain aur market ki halat ko samajhne ki koshish karein. Aakhir mein, consistent learning aur practice se hi aap ek successful trader ban sakte hain.
                            • <a href="https://www.instaforex.org/ru/?x=ruforum">InstaForex</a>
                            • #15 Collapse

                              Tower Bottom Candlestick Pattern

                              Candlestick patterns trading mein bohat important role play karti hain, kyunki ye market ke sentiments aur price action ko samajhne mein madad deti hain. Aaj hum aik aise candlestick pattern ka review karain ge jo k bullish trend ka indication deta hai aur market reversal ko predict karta hai. Ye pattern hai "Tower Bottom Candlestick Pattern."

                              Tower Bottom Candlestick Pattern Kya Hai?

                              Tower Bottom aik bullish reversal pattern hai jo downtrend ke baad market mein reversal ka ishara deta hai. Ye pattern dikhata hai ke pehle market mein bears dominate karte hain, lekin aik point par bulls control hasil kar lete hain aur market ko upar le jate hain. Is pattern mein kuch specific candlesticks ka combination hota hai jo ye indicate karta hai ke market ab niche se wapis upar jaane wala hai.

                              Tower Bottom Pattern ki Pehchan

                              Is pattern ko pehchan’na itna mushkil nahi hota agar aap kuch khas cheezon par focus karain. Tower Bottom usually do main parts mein divide hota hai:
                              1. Downtrend Phase
                                Ye phase un candlesticks par مشتمل hota hai jo negative sentiment ko show karti hain, yaani ke market mein price neeche gir rahi hoti hai. Is phase mein multiple bearish candlesticks hoti hain jo downtrend ko confirm karti hain.
                              2. Reversal Phase
                                Reversal phase mein ek ya do bullish candlesticks banti hain jo market ke direction mein change ko indicate karti hain. Ye candlesticks significant hoti hain kyunki ye price ko neeche se wapis upar le jati hain.

                              Is pattern ka naam "Tower Bottom" is liye rakha gaya hai kyunki ye aise lagta hai jaise aik tower ka bottom ho jahan price neeche tak gir kar wapis uthti hai.

                              Pattern ki Structure

                              Tower Bottom pattern ki structure kuch steps par مشتمل hoti hai jo ke following hain:
                              1. Bearish Candlesticks:
                                Pehle multiple bearish candlesticks ka silsila hota hai jo downward movement ko dikhati hain. Ye candlesticks larger size ki bhi ho sakti hain aur small bodied candles bhi is silsile ka hissa ho sakti hain. Is phase mein price consistent downward movement mein hota hai.
                              2. Doji Candlestick (Optional):
                                Kabhi kabhi is phase mein aik "Doji" candle bhi banti hai jo market mein confusion aur indecision ko show karti hai. Doji aik important indicator ho sakti hai jo market ke sentiments mein change ko show karti hai.
                              3. Bullish Candlestick:
                                Uske baad aik strong bullish candlestick banti hai jo market mein bulls ke wapas aane ka signal hoti hai. Ye candlestick larger size ki hoti hai aur downtrend ko rokne mein madad karti hai. Ye bullish candle price ke reverse hone ka clear sign hoti hai.
                              4. Trend Reversal:
                                Jab bullish candlestick confirm ho jati hai, to iske baad price ka trend reversal start ho jata hai. Price bullish direction mein move karta hai aur pehle ka downtrend khatam ho jata hai.

                              Pattern ki Ahmiyat aur Reliability

                              Tower Bottom pattern aik highly reliable bullish reversal pattern mana jata hai, magar isse istemal karte waqt kuch cheezon ka khayal rakhna zaroori hota hai:
                              1. Trend Confirmation:
                                Tower Bottom ka pattern tabhi kaam karta hai jab pehle se aik clear downtrend ho. Agar market mein already sideways movement ya consolidation ho raha ho, to ye pattern effective nahi hoga. Is liye is pattern ko sirf downtrend ke baad dekhna zaroori hota hai.
                              2. Volume Analysis:
                                Volume analysis bhi pattern ki confirmation ke liye bohat zaroori hai. Jab bullish reversal candlestick banti hai, to is waqt market ka volume increase hona chahiye. High volume ke saath bullish candle pattern ko strong banata hai aur reversal ke chances ko barhata hai.
                              3. Timeframe:
                                Different timeframes par ye pattern banta hai, lekin longer timeframes (jaise daily aur weekly charts) par is pattern ki reliability zyada hoti hai. Choti timeframes (15-minute ya hourly) par bhi ye kaam kar sakta hai, magar longer timeframes par iska impact stronger hota hai.

                              Trading Strategy ke Liye Tips

                              Agar aap Tower Bottom pattern ko apni trading strategy mein include karna chahte hain, to kuch tips ka dhyan rakhna chahiye:
                              1. Entry Point:
                                Jab bullish candlestick confirm ho jaye aur volume bhi high ho, to aap is point par market mein entry le sakte hain. Ye entry point ideal hota hai reversal ko capture karne ke liye.
                              2. Stop Loss:
                                Apni trade ko protect karne ke liye stop loss ka istemal zaroor karein. Stop loss usually last bearish candlestick ke niche lagaya jata hai taake agar trade aapke against jaye to zyada loss na ho.
                              3. Profit Target:
                                Profit target set karte waqt market ke pehle resistance levels ka dhyan rakhein. Reversal ke baad price resistances ko touch kar sakti hai, is liye apna profit target realistic rakhein.

                              Conclusion

                              Tower Bottom candlestick pattern aik bohat valuable tool hai traders ke liye jo market mein reversals ko pehchan’na chahte hain. Is pattern ko sahi tareeqay se samajh kar aur uske sath volume analysis aur trend confirmation ko include kar ke aap apni trading strategies ko better bana sakte hain. Trading mein patience aur discipline bhi zaroori hote hain, to hamesha calculated decisions lein aur over-trading se bachne ki koshish karein.

                              اب آن لائن

                              Working...
                              X