Matching Low Candlestick Pattern
Forex Trading Main Iska Kirdar
Forex trading duniya bhar ke traders ke liye ek badi interesting aur challenging market hai. Is market main technical analysis ka bht bara kirdar hai, jismein candlestick patterns bohot zyada istimaal hotay hain. Aaj hum ek khas candlestick pattern ke baray mein baat karenge, jise "Matching Low" kehte hain. Yeh pattern, khas tor par bearish market ke doran, ek bohot ahem signal hota hai jo traders ko potential reversal ka ishara deta hai. Is article mein, hum "Matching Low" candlestick pattern ko detail se samjhenge aur jaanenge ke yeh Forex trading main kis tarah se istimaal hota hai.
1. Candlestick Patterns Ka Taaruf
Candlestick patterns Forex trading mein technical analysis ke tor par market trends aur price movements ko samajhne ka aik ahm zariya hain. In patterns ke zariye, traders market ke bullish ya bearish mood ko samajh sakte hain aur is hisaab se apni strategy tayyar karte hain. "Matching Low" bhi inhi patterns mein se aik hai jo khud mein kaafi khas importance rakhta hai.
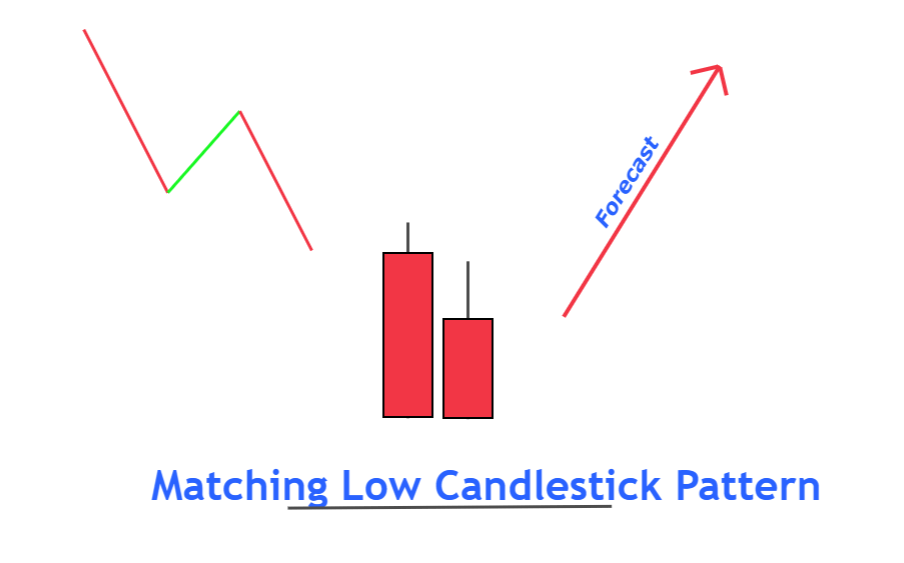
2. Matching Low Candlestick Pattern Kya Hai?
"Matching Low" candlestick pattern do consecutive candles par mabni hota hai jismein dono candles ke low prices ek jaisay hotay hain. Yeh pattern aksar downtrend mein nazar aata hai aur yeh ishara hota hai ke market ka bearish trend apni intaha ko pohoch raha hai aur reversal ka waqat qareeb hai. Jab dono candles ka low price ek hi level par hota hai to yeh samjha jata hai ke sellers ki momentum kamzor ho rahi hai aur buyers ab wapas market mein entry le rahe hain.
3. Is Pattern Ka Waqt Kya Hai?
Matching Low candlestick pattern ka zahoor zyada tar market ke bearish phase ke baad hota hai. Yeh pattern tab samajhna bohot zaroori hota hai jab market consistently lower lows banata ja raha ho aur phir achanak do candles ke low prices ek jaisay ban jayein. Is pattern ka signal market ke potential reversal ka hota hai.
4. Is Pattern Ko Pehchan'nay Ka Tareeqa
Is pattern ko pehchan'nay ka tareeqa kaafi simple hai. Aapko price chart pe do consecutive bearish candles dekhni hoti hain jinka low point ek hi level pe ho. Iska matlab hai ke pehle din aur dusray din dono candles ka low price barabar ho aur yeh situation indicate karti hai ke sellers apni momentum kho rahe hain.
5. Buyers Ki Shamiliyat Ka Ishara
Matching Low candlestick pattern ka aik important aspect yeh hai ke yeh buyers ki shamiliyat ka pehla ishara hota hai. Jab do din tak market ka low price ek jaisa ho jata hai, to yeh batata hai ke buyers ab zyada interested hain aur unka asar market par parhna shuru ho gaya hai.
6. Market Reversal Ka Strong Indication
Matching Low pattern ka sabse bara fayda yeh hai ke yeh market reversal ka strong indication deta hai. Jab downtrend mein do candles ka low price barabar ho jata hai, to yeh ek clear signal hota hai ke market ab apne bearish phase se bullish phase ki taraf jane ke liye tayar hai. Is waqt traders ko apni positions ko adjust karna hota hai.
7. Is Pattern Ki Confirmation
Is pattern ki confirmation ke liye aapko next candle ka intazar karna hota hai. Agar tisri candle bullish ban jaye aur price upar ki taraf move kare to yeh confirmation hoti hai ke matching low pattern apni jaga bana chuka hai aur market ab reversal ki taraf barh raha hai. Yeh waqt hota hai jab aggressive traders apni buying positions ko initiate karte hain.
8. Risk Management Ka Ahmiyat
Forex trading mein risk management kaafi ahmiyat rakhta hai, aur Matching Low pattern ke case mein bhi yeh asar-andaz hota hai. Is pattern ke baad trading karna risky ho sakta hai agar market ne clear direction na di ho. Is liye, stop loss levels ka tayyun zaroori hai taake unexpected price movements se bacha ja sake.
9. Trading Strategy Ka Hissa
Matching Low candlestick pattern ko apni trading strategy mein shamil karna bohot mufeed ho sakta hai. Yeh pattern downtrend ke end par strong signals deta hai jo trading decisions ko influence karte hain. Agar aap ek conservative trader hain to aap is pattern ko confirmation ke liye doosray indicators ke saath bhi istimaal kar sakte hain jaise ke RSI ya Moving Averages.
10. Market Sentiment Ko Samajhna
Is pattern ko samajhne ke liye market sentiment ka samajhna bhi zaroori hai. Jab market bohot zyada bearish ho jata hai aur phir matching low ka pattern samne aata hai, to yeh indication hoti hai ke ab market ka sentiment shift ho raha hai. Yeh shift buyers ke market mein entry se hota hai jo ke price ko upar ki taraf dhakel sakte hain.
11. Matching Low Vs Double Bottom
Matching Low pattern ko aksar double bottom ke sath confuse kiya jata hai, magar in dono mein farq hota hai. Matching Low mein do candles ke low prices barabar hote hain, jab ke double bottom mein price do martaba ek level tak girta hai lekin price action alag hota hai. Yeh dono reversal signals dete hain magar unka structure mukhtalif hota hai.
12. Is Pattern Ki Limitations
Har candlestick pattern ki tarah, Matching Low ki bhi kuch limitations hain. Yeh zaroori nahi ke har martaba yeh pattern 100% accurate results de. Market mein bohot si cheezen simultaneously ho rahi hoti hain jo price ko affect karti hain. Is liye, sirf is pattern par bharosa karna thoda risky ho sakta hai. Isko doosray analysis tools ke sath mila kar use karna behtareen strategy ho sakti hai.
13. Conclusion
Forex trading mein Matching Low candlestick pattern ek powerful reversal signal hai, jo ke bearish market mein buyers ki wapsi ka pehla ishara deta hai. Is pattern ko samajhna aur iske sahi waqt par istimaal karna traders ko profitable trades dene mein madadgar ho sakta hai. Lekin hamesha yaad rakhein ke har pattern ke sath risk management ka hona zaroori hai. Trading mein koi bhi strategy fail-safe nahi hoti, is liye diversification aur proper analysis kaafi ahmiyat rakhta hai.
Forex Trading Main Iska Kirdar
Forex trading duniya bhar ke traders ke liye ek badi interesting aur challenging market hai. Is market main technical analysis ka bht bara kirdar hai, jismein candlestick patterns bohot zyada istimaal hotay hain. Aaj hum ek khas candlestick pattern ke baray mein baat karenge, jise "Matching Low" kehte hain. Yeh pattern, khas tor par bearish market ke doran, ek bohot ahem signal hota hai jo traders ko potential reversal ka ishara deta hai. Is article mein, hum "Matching Low" candlestick pattern ko detail se samjhenge aur jaanenge ke yeh Forex trading main kis tarah se istimaal hota hai.
1. Candlestick Patterns Ka Taaruf
Candlestick patterns Forex trading mein technical analysis ke tor par market trends aur price movements ko samajhne ka aik ahm zariya hain. In patterns ke zariye, traders market ke bullish ya bearish mood ko samajh sakte hain aur is hisaab se apni strategy tayyar karte hain. "Matching Low" bhi inhi patterns mein se aik hai jo khud mein kaafi khas importance rakhta hai.
2. Matching Low Candlestick Pattern Kya Hai?
"Matching Low" candlestick pattern do consecutive candles par mabni hota hai jismein dono candles ke low prices ek jaisay hotay hain. Yeh pattern aksar downtrend mein nazar aata hai aur yeh ishara hota hai ke market ka bearish trend apni intaha ko pohoch raha hai aur reversal ka waqat qareeb hai. Jab dono candles ka low price ek hi level par hota hai to yeh samjha jata hai ke sellers ki momentum kamzor ho rahi hai aur buyers ab wapas market mein entry le rahe hain.
3. Is Pattern Ka Waqt Kya Hai?
Matching Low candlestick pattern ka zahoor zyada tar market ke bearish phase ke baad hota hai. Yeh pattern tab samajhna bohot zaroori hota hai jab market consistently lower lows banata ja raha ho aur phir achanak do candles ke low prices ek jaisay ban jayein. Is pattern ka signal market ke potential reversal ka hota hai.
4. Is Pattern Ko Pehchan'nay Ka Tareeqa
Is pattern ko pehchan'nay ka tareeqa kaafi simple hai. Aapko price chart pe do consecutive bearish candles dekhni hoti hain jinka low point ek hi level pe ho. Iska matlab hai ke pehle din aur dusray din dono candles ka low price barabar ho aur yeh situation indicate karti hai ke sellers apni momentum kho rahe hain.
5. Buyers Ki Shamiliyat Ka Ishara
Matching Low candlestick pattern ka aik important aspect yeh hai ke yeh buyers ki shamiliyat ka pehla ishara hota hai. Jab do din tak market ka low price ek jaisa ho jata hai, to yeh batata hai ke buyers ab zyada interested hain aur unka asar market par parhna shuru ho gaya hai.
6. Market Reversal Ka Strong Indication
Matching Low pattern ka sabse bara fayda yeh hai ke yeh market reversal ka strong indication deta hai. Jab downtrend mein do candles ka low price barabar ho jata hai, to yeh ek clear signal hota hai ke market ab apne bearish phase se bullish phase ki taraf jane ke liye tayar hai. Is waqt traders ko apni positions ko adjust karna hota hai.
7. Is Pattern Ki Confirmation
Is pattern ki confirmation ke liye aapko next candle ka intazar karna hota hai. Agar tisri candle bullish ban jaye aur price upar ki taraf move kare to yeh confirmation hoti hai ke matching low pattern apni jaga bana chuka hai aur market ab reversal ki taraf barh raha hai. Yeh waqt hota hai jab aggressive traders apni buying positions ko initiate karte hain.
8. Risk Management Ka Ahmiyat
Forex trading mein risk management kaafi ahmiyat rakhta hai, aur Matching Low pattern ke case mein bhi yeh asar-andaz hota hai. Is pattern ke baad trading karna risky ho sakta hai agar market ne clear direction na di ho. Is liye, stop loss levels ka tayyun zaroori hai taake unexpected price movements se bacha ja sake.
9. Trading Strategy Ka Hissa
Matching Low candlestick pattern ko apni trading strategy mein shamil karna bohot mufeed ho sakta hai. Yeh pattern downtrend ke end par strong signals deta hai jo trading decisions ko influence karte hain. Agar aap ek conservative trader hain to aap is pattern ko confirmation ke liye doosray indicators ke saath bhi istimaal kar sakte hain jaise ke RSI ya Moving Averages.
10. Market Sentiment Ko Samajhna
Is pattern ko samajhne ke liye market sentiment ka samajhna bhi zaroori hai. Jab market bohot zyada bearish ho jata hai aur phir matching low ka pattern samne aata hai, to yeh indication hoti hai ke ab market ka sentiment shift ho raha hai. Yeh shift buyers ke market mein entry se hota hai jo ke price ko upar ki taraf dhakel sakte hain.
11. Matching Low Vs Double Bottom
Matching Low pattern ko aksar double bottom ke sath confuse kiya jata hai, magar in dono mein farq hota hai. Matching Low mein do candles ke low prices barabar hote hain, jab ke double bottom mein price do martaba ek level tak girta hai lekin price action alag hota hai. Yeh dono reversal signals dete hain magar unka structure mukhtalif hota hai.
12. Is Pattern Ki Limitations
Har candlestick pattern ki tarah, Matching Low ki bhi kuch limitations hain. Yeh zaroori nahi ke har martaba yeh pattern 100% accurate results de. Market mein bohot si cheezen simultaneously ho rahi hoti hain jo price ko affect karti hain. Is liye, sirf is pattern par bharosa karna thoda risky ho sakta hai. Isko doosray analysis tools ke sath mila kar use karna behtareen strategy ho sakti hai.
13. Conclusion
Forex trading mein Matching Low candlestick pattern ek powerful reversal signal hai, jo ke bearish market mein buyers ki wapsi ka pehla ishara deta hai. Is pattern ko samajhna aur iske sahi waqt par istimaal karna traders ko profitable trades dene mein madadgar ho sakta hai. Lekin hamesha yaad rakhein ke har pattern ke sath risk management ka hona zaroori hai. Trading mein koi bhi strategy fail-safe nahi hoti, is liye diversification aur proper analysis kaafi ahmiyat rakhta hai.


تبصرہ
Расширенный режим Обычный режим