Technical Analysis

No announcement yet.
`
X
  • وقت
  • دکھائیں
Clear All
new posts
  • #1 Collapse

    Technical Analysis
    What is Technical analysis?

    forex chart mein technical analysis ke paish raft ke badolat forex market mein taize say maqbol honay wala yeh tareka kar hota hey tahu forex market mein aik now amoz trade kay ley best tareka kar hota hey yeh kese bhe tarah forex market kay trend ke paish goi kar sakta hey jo keh moshkel or chalenging bhe ho sakta hey
    technical indicator forex market ke movement ko identify karnay mein bhe madad kar sakta hey jes kay tahat tradr anay walay trend kaybaray mein paish goi karnay mein bhe madad kar sakta hey or forex market kay History kay chart pattern or indicator ka he estamal keyaja sakta hey takeh forex trade kay baray mein anay wale trade or paish raft ka analysis keya ja sakay

    Understanding Technical Analysis

    technical analysis forex market mein price ke movement ka analysis keyaja sakta hey jes kay tahat tradr anay walay trend kay baray mein paish goi kar saktay hein or history kay chart pattern kay ley indicator ka estamal keyaja sakta hey yeh forex market kaymaze or history ke pemaish kay bad basre pemaish ka analysis keya ja sakta hey en malomat ko price action ke shape mein analysis karnay kay ley estamal keya ja sakta hey takeh forex trade mein anay walay trend ke paish goi ke ja sakte hey
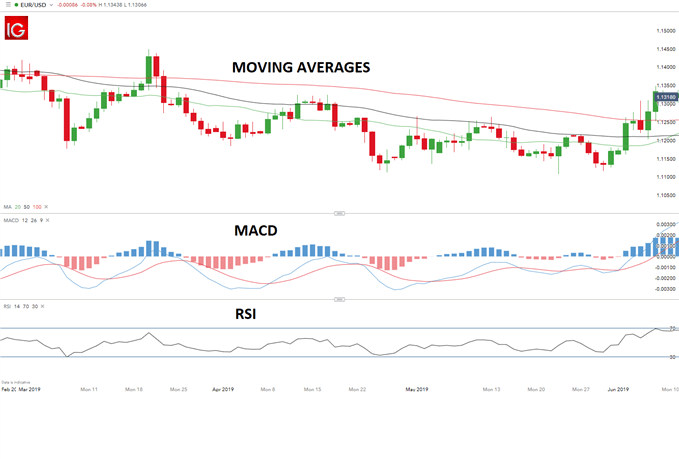
    nechay dey gay chart mein MACD or RSI indicator ka estamal keya geya hey


    Technical analysis ka forex market mei estamal


    oper deya geya EUR/USD ka currency pair ka chart hey jo keh market mein technical analysis ka estamal kay baray mein he hey jes kay tahat trader market mein anay walay trend ke direction kay baray mein malomat frahm kar saktay hein History kay chart pattern mein indicator estamal key jatay hein yeh forex market kay maze majodah karkardge kay baray mein basree pemaish ko zahair kar saktay hein takeh trend mein enter honay say pehlay anay alay trend paish goi ke ja sakte hey
    forex market ka yeh chart overall trend ka tayon karnay kay ley he estamal keyaja sakta hey yeh forex market mein oper ke taraf trend karnay ya nechay ke taraf trend karnay mein he forex market ke madad kar sakta hey technical analysis mein bar chart line chart or candlestick chart he hotay hein

    Example

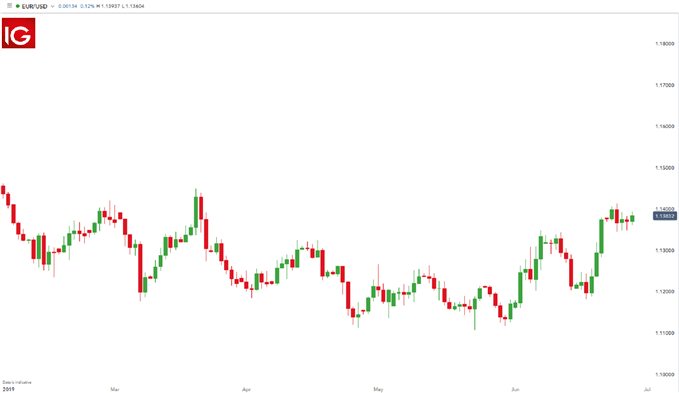
    nechay de gay EUR/USD ke example mein MACD or RSI indicator ka estamal keya ja sakta hey yeh forex market ke entry or exit kay raston ka tayon keya ja sakta hey yeh indicator forex market kay trader ka analysis karnay kay ley estamal keya ja sakta hey trader kay point of view ka tayon karnay or entry ka analysis karnay kay ley bhe estamal keya ja sakta hey
    Click image for larger version

Name:	basics-of-technical-analysis_body_EURUSDwithindicators.png
Views:	50
Size:	20.4 کلوبائٹ
ID:	13099523
    bhali kay badlay bhali
  • <a href="https://www.instaforex.org/ru/?x=ruforum">InstaForex</a>
  • #2 Collapse

    Forex Trading Mein Technical Analysis: Ek Mukammal Guide

    1. Technical Analysis Ka Taaruf


    Technical analysis ka mqsad market ke past price movements aur trading volumes ko analyze karke future price trends ko predict karna hai. Isme traders charts aur indicators ka use karte hain taake wo market ki mood aur potential reversals ko samajh saken. Yeh analysis mostly historical data par base hota hai aur isme fundamental factors ko include nahi kiya jata.

    Technical analysis ka basic principle yeh hai ke market trends aur patterns time ke sath repeat hotay hain. Agar hum market ke historical data ko study karein to humein kuch patterns aur trends nazar aate hain jo future mein bhi repeat ho sakte hain. Is tarah, traders past patterns ki madad se future price movements ka andaza laga sakte hain.

    Technical analysis mein ek aur important concept hai ke price, time, aur volume ke darmiyan ka relationship samajhna. Price movements aur volume ka analysis market ki strength aur weaknesses ko identify karne mein madad karta hai. Iske alawa, technical analysis traders ko entry aur exit points ko identify karne mein bhi madadgar hota hai.

    Technical analysis ke tools aur techniques traders ko market trends aur potential reversals ko detect karne mein help karte hain. Ye tools alag-alag patterns aur indicators ko use karte hain jo traders ko buy aur sell signals provide karte hain. Ye signals decision-making process ko simplify karte hain.

    Aakhir mein, technical analysis market ke complex behavior ko samajhne mein madadgar hota hai, lekin iska istemaal wisely aur complementary tools ke saath karna chahiye. Fundamental analysis aur risk management techniques bhi equally important hain jo traders ko zyada accurate decisions lene mein madad karte hain.
    2. Forex Market Ki Pehchaan


    Forex market, jo ke foreign exchange market bhi kehlata hai, duniya ka sabse bara financial market hai. Is market mein currencies ko buy aur sell kiya jata hai aur iska daily trading volume 6 trillion dollars se zyada hai. Forex market 24 ghante open rehta hai, jo ke traders ko flexible trading opportunities provide karta hai.

    Forex market ki volatility high hoti hai, jo ke technical analysis ko zyada effective banata hai. Market ki movements ka analysis karne se traders ko currency pairs ke future movements ke baare mein insight milti hai. Is market ki liquidity bhi high hoti hai, jo ke large trades ko easily execute karne mein madad karti hai.

    Forex market mein currencies ke price movements economic indicators, geopolitical events, aur market sentiment ke basis par hoti hain. Technical analysis in factors ko consider nahi karta lekin historical price patterns aur volume ko analyze karta hai. Is tarah, traders market ke past trends ko samajh kar future movements ka andaza laga sakte hain.

    Market ki geographical distribution aur time zones bhi Forex trading ko interesting banate hain. Asia, Europe, aur North America ke financial centers Forex market ki major players hain. In financial centers ke opening aur closing times market ki volatility aur trading opportunities ko influence karte hain.

    Forex market ke complexity ko samajhna aur trading strategies ko adapt karna traders ko zyada successful bana sakta hai. Technical analysis ek ahem tool hai jo traders ko market trends aur price movements ko samajhne mein madad karta hai. Lekin, iske sath-sath market ki fundamental factors ko bhi consider karna zaroori hai.
    3. Chart Types: Line, Bar, Aur Candlestick


    Charts technical analysis ke fundamental tools hain jo price movements ko visualize karne mein madad karte hain. Line charts, bar charts, aur candlestick charts teen primary types hain jo trading decisions ko guide karte hain. Har chart type apne unique features aur benefits provide karta hai.

    Line charts sabse simple aur basic chart type hai. Ye ek continuous line hoti hai jo closing prices ko connect karti hai. Line charts market ki overall trend ko easily visualize karne mein madad karte hain, lekin inmein details kam hoti hain. Yeh charts short-term traders aur beginners ke liye useful ho sakte hain.

    Bar charts, jo ke OHLC (Open, High, Low, Close) data ko show karte hain, line charts se zyada detailed hote hain. Bar charts mein har bar ek trading period ke high, low, open, aur close prices ko represent karta hai. In charts ko use karke traders price fluctuations aur trends ko zyada accurately analyze kar sakte hain.

    Candlestick charts sabse zyada popular aur detailed charts hain. Ye charts individual candlesticks ko use karke price movements ko show karte hain. Har candlestick ek specific time period ke price action ko represent karti hai aur isme open, high, low, aur close prices ki information hoti hai. Candlestick patterns price trends aur market sentiment ko identify karne mein madadgar hote hain.

    Candlestick patterns ko samajhne ke liye traders ko alag-alag patterns jese ki doji, hammer, aur engulfing patterns ko analyze karna padta hai. Ye patterns price reversals aur continuations ko indicate karte hain aur trading decisions ko guide karte hain. Har pattern ka apna significance aur interpretation hota hai.

    Charts ko use karte waqt traders ko apne trading strategy ke mutabiq chart type ka selection karna chahiye. Line charts short-term trends ko identify karne ke liye useful hain, bar charts price details ko analyze karne ke liye, aur candlestick charts market sentiment aur reversals ko detect karne ke liye.
    4. Support Aur Resistance Levels


    Support aur resistance levels technical analysis ke core concepts hain jo market ke potential reversal points ko identify karte hain. Support level woh point hai jahan price girti hai aur rukti hai, jabke resistance level woh point hai jahan price barhti hai aur ruk jati hai.

    Support level wo point hota hai jahan buyers market me entry karte hain aur price ko niche girne se rok dete hain. Yeh level market ke bearish trend ko absorb karta hai aur buyers ke strong presence ko show karta hai. Jab price support level ko test karti hai, to traders ko expect hota hai ke price wahan se bounce kar sakti hai.

    Resistance level wo point hota hai jahan sellers market me entry karte hain aur price ko barhne se rok dete hain. Yeh level market ke bullish trend ko resist karta hai aur sellers ke strong presence ko show karta hai. Jab price resistance level ko test karti hai, to traders ko expect hota hai ke price wahan se reverse ho sakti hai.

    Support aur resistance levels ko identify karne ke liye traders ko historical price data ka analysis karna padta hai. Yeh levels market ke past data aur price movements ko dekh kar identify kiye jaate hain. Iske alawa, support aur resistance levels dynamic ho sakte hain aur time ke sath change ho sakte hain.

    Support aur resistance levels ko break karna bhi important hota hai. Jab price in levels ko break karti hai, to yeh market ke trend ko indicate kar sakta hai. For example, agar price support level ko break karti hai to market bearish ho sakta hai, aur agar resistance level ko break karti hai to market bullish ho sakta hai.
    5. Trend Lines Ka Istemaal


    Trend lines technical analysis mein ek essential tool hain jo market ke trends ko identify karne mein madad karte hain. Trend lines price points ko connect karke ek line draw karte hain jo market ke trend ko represent karti hai. Ye lines uptrend aur downtrend ko identify karne mein useful hoti hain.

    Uptrend line woh hoti hai jo higher lows ko connect karti hai. Jab market me higher lows bante hain aur price gradually upar jaati hai, to uptrend line ko draw kiya jata hai. Is line ka use traders ko bullish market conditions aur buying opportunities identify karne mein madad karta hai.

    Downtrend line woh hoti hai jo lower highs ko connect karti hai. Jab market me lower highs bante hain aur price gradually niche jaati hai, to downtrend line ko draw kiya jata hai. Is line ka use traders ko bearish market conditions aur selling opportunities identify karne mein madad karta hai.

    Trend lines ko draw karte waqt traders ko price points ke saath alignment aur accuracy ka khayal rakhna chahiye. Agar trend line properly draw nahi ki gayi to iski effectiveness kam ho sakti hai. Isliye, trend lines ko accurate aur well-defined points par draw karna zaroori hai.

    Trend lines ki breakouts aur bounces ko bhi monitor karna zaroori hai. Jab price trend line ko break karti hai, to yeh market ke trend reversal ka indication ho sakta hai. Agar price trend line ke saath bounce karti hai to yeh trend continuation ka indication ho sakta hai.
    6. Moving Averages


    Moving averages technical analysis ka ek important tool hain jo market trends ko smooth aur identify karne mein madad karte hain. Moving averages price ke average ko ek specific time period ke liye calculate karte hain. Yeh averages market ke noise ko reduce karte hain aur clear trend ko highlight karte hain.

    Simple Moving Average (SMA) sabse basic type ka moving average hai. SMA price ke closing prices ka average nikalta hai ek specific time period ke liye. For example, 50-day SMA price ke last 50 days ke closing prices ka average hota hai. SMA market trends ko identify karne mein useful hota hai lekin iska response time slow hota hai.

    Exponential Moving Average (EMA) ek aur popular moving average hai jo price movements ko zyada effectively track karta hai. EMA recent prices ko zyada weightage deta hai aur isliye ye moving average zyada responsive hota hai. EMA ki help se traders short-term aur long-term trends ko accurately identify kar sakte hain.

    Moving averages ke crossovers bhi important trading signals provide karte hain. Jab short-term moving average long-term moving average ko cross karta hai, to yeh buy ya sell signal generate kar sakta hai. For example, agar 50-day EMA 200-day EMA ko cross karti hai to yeh bullish signal hota hai.

    Moving averages ka use trading strategy ke hisaab se kiya jata hai. Different time periods aur types ke moving averages ko combine karke traders market trends ko zyada accurately analyze kar sakte hain. Iske alawa, moving averages ko other technical indicators ke saath combine karke trading decisions ko enhance kiya ja sakta hai.
    7. RSI (Relative Strength Index)


    Relative Strength Index (RSI) ek momentum oscillator hai jo market ke overbought aur oversold conditions ko identify karta hai. RSI 0 se 100 tak ke scale par hota hai aur traders ko market ke potential reversal points ke baare mein information provide karta hai. RSI ko calculate karne ka method complex hota hai lekin iska interpretation simple hai.

    RSI ki value 70 se upar overbought condition ko indicate karti hai. Jab RSI 70 se zyada hota hai to market ki strength high hoti hai aur price potentially reversal ke liye ready ho sakti hai. Overbought condition ka matlab yeh nahi hota ke market turant reverse ho jayegi, lekin yeh ek warning sign ho sakta hai.

    RSI ki value 30 se neeche oversold condition ko indicate karti hai. Jab RSI 30 se kam hota hai to market ki weakness high hoti hai aur price potentially reversal ke liye ready ho sakti hai. Oversold condition bhi market ki immediate reversal ko indicate nahi karti lekin yeh traders ko potential buying opportunity provide karti hai.

    RSI ko use karte waqt traders ko divergence aur convergence ko bhi monitor karna chahiye. Positive divergence tab hoti hai jab price lower lows banati hai lekin RSI higher lows banata hai. Negative divergence tab hoti hai jab price higher highs banati hai lekin RSI lower highs banata hai.

    RSI ko other indicators aur technical tools ke saath combine karke trading strategy ko enhance kiya ja sakta hai. For example, agar RSI overbought condition show kar raha hai aur price resistance level ko test kar rahi hai, to yeh ek strong sell signal ban sakta hai.
    8. MACD (Moving Average Convergence Divergence)


    Moving Average Convergence Divergence (MACD) ek trend-following momentum indicator hai jo moving averages ki convergence aur divergence ko measure karta hai. MACD ki calculation do moving averages ke beech ke difference ko track karti hai aur isse buy aur sell signals generate hoti hain.

    MACD line aur signal line ko use kar ke trading signals identify kiye jate hain. MACD line, jo ke short-term aur long-term moving averages ke beech ka difference hoti hai, signal line ke saath crossover karke trading signals provide karti hai. Jab MACD line signal line ko upar se cross karti hai to yeh buy signal hota hai, aur jab neeche se cross karti hai to yeh sell signal hota hai.

    MACD histogram bhi ek important component hai jo MACD line aur signal line ke beech ke difference ko visualize karta hai. Histogram positive hota hai jab MACD line signal line ke upar hoti hai aur negative hota hai jab MACD line signal line ke neeche hoti hai. Histogram ki length aur direction market ke momentum ko indicate karti hai.

    MACD ko trend-following aur momentum indicators ke combination ke sath use karna effective hota hai. For example, agar MACD buy signal generate kar raha hai aur price support level ko test kar rahi hai, to yeh ek strong buy opportunity indicate kar sakta hai.

    MACD ke signals ko overbought aur oversold conditions ke saath combine karna bhi zaroori hota hai. MACD signals ko market ke broader context aur other technical tools ke sath align kar ke trading decisions ko zyada accurate banaya ja sakta hai.
    9. Bollinger Bands


    Bollinger Bands price volatility ko measure karne aur market ke potential reversals ko identify karne ke liye use kiye jate hain. Bollinger Bands teen lines ko use karti hain: ek middle line jo ke moving average hoti hai, aur do outer lines jo ke standard deviations par based hoti hain.

    Upper aur lower bands price ki volatility ko show karte hain. Jab market ki volatility high hoti hai, to bands widen ho jati hain, aur jab volatility low hoti hai, to bands narrow ho jati hain. Is tarah, traders market ke potential breakout aur breakdown points ko identify kar sakte hain.

    Bollinger Bands ke trading signals ko bands ke breakouts aur bounces se identify kiya jata hai. Agar price upper band ko break karti hai to yeh overbought condition ko indicate karta hai, aur agar price lower band ko break karti hai to yeh oversold condition ko indicate karta hai. Isse traders ko potential reversal points ka idea milta hai.

    Bands ke bounces bhi important signals provide karte hain. Agar price bands ke saath bounce karti hai to yeh market ke current trend ko continue karne ka indication ho sakta hai. For example, agar price lower band ke saath bounce karti hai to yeh bullish signal ho sakta hai.

    Bollinger Bands ko other technical indicators ke saath combine karke trading signals ko confirm karna zaroori hota hai. Isse traders ko zyada reliable signals milte hain aur trading decisions ko enhance kiya ja sakta hai. Bollinger Bands ki interpretation market conditions aur price trends ke hisaab se change hoti hai.
    10. Fibonacci Retracement Levels


    Fibonacci retracement levels market ke potential reversal points ko identify karne aur price retracement phases ko measure karne ke liye use kiye jate hain. Fibonacci levels 23.6%, 38.2%, 50%, 61.8%, aur 76.4% ke levels par base hote hain jo price ke pullbacks ko identify karte hain.

    Fibonacci retracement levels ko draw karne ke liye traders ko major price swings ko identify karna padta hai. Yeh levels market ke support aur resistance points ko determine karne mein madadgar hote hain. For example, agar price ek strong uptrend mein hai aur retracement levels ko test karti hai to yeh market ke potential reversal points ko indicate karta hai.

    Fibonacci levels ke trading signals ko price ke level se bounce aur breakouts se identify kiya jata hai. Agar price retracement level ko bounce karti hai to yeh trend continuation ka indication ho sakta hai. Agar price level ko break karti hai to yeh potential trend reversal ko indicate kar sakta hai.

    Fibonacci levels ko combine kar ke trading strategy ko enhance karna bhi zaroori hota hai. Traders ko in levels ko other technical indicators ke sath align karna chahiye taake trading signals zyada reliable ho sakein. For example, agar Fibonacci level ko support aur moving average ke sath combine karte hain to yeh stronger trading signal ban sakta hai.

    Fibonacci retracement levels ko use karte waqt traders ko market ki overall trend aur price action ko bhi consider karna chahiye. Yeh levels ek potential guide hote hain lekin market ki actual movements aur broader context ko samajhna bhi zaroori hota hai.
    11. Volume Analysis


    Volume analysis trading volume ko study karke price movements ke strength aur weaknesses ko identify karne mein madad karta hai. Volume market ki activity aur liquidity ko measure karta hai, aur high volume strong trends ko indicate karta hai jabke low volume weak trends ko indicate karta hai.

    Volume analysis ko price movements ke saath combine karke trading signals ko identify kiya jata hai. For example, agar price ek strong uptrend mein hai aur volume bhi increase ho raha hai to yeh trend ke strong continuation ka indication ho sakta hai. Is tarah, volume analysis traders ko market ke momentum aur strength ke baare mein information provide karta hai.

    Volume aur price trends ke beech ka relationship bhi important hota hai. Agar price higher highs banati hai lekin volume decrease hota hai to yeh trend ke weakness ko indicate karta hai. Is tarah, volume divergence aur convergence ko monitor karke traders market ke potential reversals aur trend strength ko analyze kar sakte hain.

    Volume indicators, jaise ki On-Balance Volume (OBV) aur Chaikin Money Flow (CMF), volume analysis ko enhance karte hain. Ye indicators volume aur price ke beech ke relationship ko measure karte hain aur trading decisions ko guide karte hain. OBV aur CMF ko market ke momentum aur strength ke baare mein insight provide karne ke liye use kiya jata hai.

    Volume analysis ko technical indicators aur chart patterns ke sath combine karke trading strategy ko improve kiya ja sakta hai. High volume ke saath strong technical signals ko combine kar ke traders zyada reliable trading opportunities identify kar sakte hain. Isse trading decisions ko zyada effective aur accurate banaya ja sakta hai.
    12. Divergence Analysis


    Divergence analysis price aur technical indicators ke beech ka difference observe karta hai aur market ke potential reversals ko identify karne mein madad karta hai. Divergence positive aur negative types mein hoti hai aur ye market ke trend aur momentum ko indicate karti hai.

    Positive divergence tab hoti hai jab price lower lows banati hai lekin technical indicator, jaise RSI ya MACD, higher lows banata hai. Yeh signal market ke potential bullish reversal ko indicate karta hai. Positive divergence market ke bearish trend ki strength ko kam karti hai aur buying opportunities provide karti hai.

    Negative divergence tab hoti hai jab price higher highs banati hai lekin technical indicator lower highs banata hai. Yeh signal market ke potential bearish reversal ko indicate karta hai. Negative divergence market ke bullish trend ki strength ko kam karti hai aur selling opportunities provide karti hai.

    Divergence analysis ko accurate trading signals ke liye combine kiya jata hai. Traders technical indicators, price patterns, aur other analysis tools ko divergence signals ke saath use karte hain taake zyada reliable trading opportunities identify ki ja sakein. Divergence signals ko market ke broader context ke sath align karna bhi zaroori hota hai.

    Divergence analysis ko trading strategy ke hisaab se adapt karna chahiye. Har indicator aur pattern ki interpretation different ho sakti hai aur market conditions ke hisaab se signals ko analyze karna zaroori hai. Isse traders ko potential market reversals aur trading opportunities ko accurately detect karne mein madad milti hai.
    13. Risk Management Aur Stop-Loss


    Risk management trading ke important aspects hain jo trading positions ko protect aur losses ko minimize karne mein madad karte hain. Risk management strategies, jaise stop-loss orders, trading ko controlled aur disciplined rakhne mein madad karti hain. Stop-loss orders automatically sell (ya buy) orders ko execute karte hain jab price ek certain level par pohnchti hai.

    Stop-loss orders ko set karte waqt traders ko apne risk tolerance aur market conditions ko consider karna chahiye. Stop-loss level ko price volatility aur trading strategy ke hisaab se adjust kiya jana chahiye. Agar stop-loss level zyada tight hota hai to yeh frequent stops aur losses generate kar sakta hai, aur agar zyada loose hota hai to yeh potential losses ko increase kar sakta hai.

    Risk management mein position sizing bhi important role ada karti hai. Traders ko apne capital ko effectively allocate karna chahiye aur har trade ke liye proper position size determine karni chahiye. Position sizing ko risk-reward ratio aur market conditions ke hisaab se adjust karna zaroori hai.

    Risk management techniques ke sath-sath trading plan ko bhi follow karna chahiye. Trading plan market analysis, entry aur exit strategies, aur risk management rules ko include karta hai. Trading plan ko follow kar ke traders disciplined aur consistent trading decisions le sakte hain.

    Effective risk management aur stop-loss strategies ko implement kar ke traders apne trading performance ko improve kar sakte hain. Yeh techniques traders ko unnecessary losses se bachati hain aur trading capital ko protect karti hain. Is tarah, risk management trading ko safe aur profitable banane mein madad karta hai.
    14. Technical Analysis Ki Limitation


    Technical analysis ka use trading decisions ko guide karne ke liye hota hai, lekin iski kuch limitations bhi hain. Technical analysis primarily historical price data aur trading volumes par base hota hai aur future market movements ko accurately predict nahi kar sakta. Market ki volatility aur unexpected events bhi technical analysis ko influence kar sakte hain.

    Technical analysis fundamental factors, jaise economic indicators aur geopolitical events, ko consider nahi karta. Ye factors market ki price movements ko significantly affect kar sakte hain aur technical analysis ke predictions ko inaccurate bana sakte hain. Isliye, fundamental analysis ko bhi consider karna zaroori hai.

    Technical analysis ke indicators aur patterns kabhi-kabhi misleading signals generate kar sakte hain. Indicators ki sensitivity aur patterns ki accuracy market conditions ke hisaab se change hoti hai. Traders ko technical signals ko broader market context aur other analysis tools ke sath combine karke use karna chahiye.

    Market sentiment aur news events bhi technical analysis ko impact kar sakte hain. Market news aur events price movements ko unexpected directions mein le ja sakte hain jo technical analysis ke predictions ko contradict kar sakte hain. Isliye, news aur events analysis ko bhi trading decisions mein include karna zaroori hai.

    Technical analysis ko use karte waqt traders ko apne limitations aur market ke unpredictable nature ko samajhna chahiye. Technical analysis ek valuable tool hai lekin iske sath-sath risk management aur fundamental analysis bhi equally important hain. Is tarah, trading decisions ko zyada balanced aur informed banaya ja sakta hai.
    • #3 Collapse

      **Technical Analysis**
      Technical analysis ek aisi methodology hai jo market trends aur price movements ko samajhne ke liye charts aur indicators ka istemal karti hai. Iska maqsad ye hota hai ke past price movements aur trading volumes ke zariye future price trends ko predict kiya ja sake.

      Technical analysis ka asaas ye hai ke market ki price movements history se repeat hoti hain. Traders aur analysts charts par historical data dekh kar market ki current aur future condition ko evaluate karte hain. Ye analysis primarily price patterns aur trading volumes par focus karti hai, aur fundamental factors ko zyada importance nahi deti.

      Is analysis mein different types ke charts aur indicators use kiye jate hain. Sabse common chart types mein line charts, bar charts, aur candlestick charts shamil hain. Candlestick charts, for example, market ke price movements ko visualize karte hain aur har candlestick ek specific time period ki price action ko represent karti hai. Har candlestick ka body aur wicks market ke open, close, high, aur low prices ko show karte hain, jo traders ko market ki momentum aur sentiment ka idea dete hain.

      Indicators bhi technical analysis ka ek important part hain. Indicators jese ke Moving Averages, Relative Strength Index (RSI), aur Moving Average Convergence Divergence (MACD) market trends aur potential reversal points ko identify karne mein madad karte hain. Moving Averages market ki smoothed price trend ko show karte hain, jab ke RSI overbought ya oversold conditions ko signal karta hai. MACD do moving averages ke beech ke relationship ko show karta hai, jo trend strength aur potential trend reversals ko indicate karta hai.

      Technical analysis ke tools aur techniques traders ko market trends aur price movements ke baare mein valuable insights provide karte hain. Lekin, ye bhi zaroori hai ke technical analysis ko other analysis methods ke sath combine kiya jaye aur trading decisions ko market ki overall conditions aur fundamentals ke context mein dekha jaye.

      In summary, technical analysis ek powerful tool hai jo traders ko market ki past aur present data ko analyze karne mein madad karta hai, lekin isse ek holistic trading strategy ke part ke tor par use karna chahiye.
      • #4 Collapse

        Technical Analysis in Forex Trading


        1. Ta'aruf

        Forex trading mein technical analysis ka maqsad hai market ki past price movements aur volume data ko analyse karke future price movements ko predict karna. Technical analysis ek aisa method hai jo price data aur market patterns ko study karke trading decisions ko enhance karne mein madad karta hai. Is technique ka istemal karne se traders ko market ke trends aur potential reversals ko samajhne mein madad milti hai.

        Technical analysis ki buniyad price action aur volume data par hoti hai. Ismein charts aur indicators ka use karke market trends ko identify kiya jata hai. Ye analysis market ke past data ko dekh kar future trends aur price levels ko predict karta hai. Technical analysis ke zariye traders price movements, trends, aur patterns ko samajh kar apne trading strategies ko improve karte hain.

        Technical analysis ki ek khas baat yeh hai ke yeh market ki fundamentals par depend nahi karta. Iska focus sirf price movements aur trading volume par hota hai. Yeh method yeh maan ke chalta hai ke market ki saari information already price mein shamil hai, isliye price movements hi sabse important factors hain. Isliye technical analysis market ki real-time movements ko track karne aur future predictions karne mein madadgar hai.

        Technical analysis ko use karte waqt traders ko kuch basic concepts samajhna zaroori hota hai. Charts, indicators, aur patterns ki understanding ke bina technical analysis ka faida nahi uthaya ja sakta. Charts market ki visual representation provide karte hain, jabke indicators aur patterns trading signals aur trends ko identify karne mein madad karte hain. In sab factors ko samajhna aur unhein effectively use karna technical analysis ke key aspects hain.

        2. Technical Analysis Ka Maqsad

        Technical analysis ka maqsad market trends aur price movements ko samajhna aur future predictions karna hai. Iska basic concept yeh hai ke market ki past price movements aur volume data ko analyze karke traders ko trading decisions mein madad mile. Is technique ke zariye traders market ke behavior aur trends ko track karte hain aur unke basis par trading strategies develop karte hain.

        Technical analysis traders ko price movements ke patterns aur trends ko identify karne mein madad karta hai. Yeh analysis ke zariye traders yeh samajhte hain ke market bullish hai ya bearish, aur kis tarah ke price movements expect kiye ja sakte hain. Is analysis ke zariye traders market ki fluctuations aur reversals ko anticipate karte hain aur apni trading decisions ko accordingly adjust karte hain.

        Technical analysis ka maqsad trading signals aur trends ko identify karna bhi hai. Is technique ke zariye traders ko market ke potential entry aur exit points ka pata chal sakta hai. Indicators aur patterns ke use se traders market ki volatility aur momentum ko measure karte hain aur iske basis par trading decisions lete hain.

        Technical analysis ka maqsad market ke sentiment aur behavior ko samajhna bhi hai. Traders technical analysis ke zariye market ke psychological aspects ko analyze karte hain aur market ke participants ke behavior ko predict karte hain. Yeh analysis traders ko market ke overall mood aur sentiment ko understand karne mein madad karta hai.

        3. Charts Ka Istamal

        Forex trading mein technical analysis ke liye charts ka istemal ek fundamental practice hai. Charts price movements ko visually represent karte hain aur traders ko market ke trends aur patterns ko identify karne mein madad dete hain. Different types ke charts hain, jese line charts, bar charts, aur candlestick charts, jo har ek apne unique format aur information provide karte hain.

        Line charts simple aur easy-to-read hote hain, jo price movements ko ek continuous line ke zariye represent karte hain. Yeh charts price ke closing points ko connect karte hain aur market ke overall trend ko dikhate hain. Line charts ko use karte waqt traders ko basic price trends aur levels dekhne mein madad milti hai, lekin yeh charts detailed information nahi provide karte.

        Bar charts thoda complex hote hain aur har bar price ke open, high, low, aur close (OHLC) points ko represent karti hai. Bar charts traders ko price ke fluctuations aur volatility ko track karne mein madad karte hain. Har bar market ke different phases ko dikhati hai, jo price movements ke analysis ke liye useful hoti hai.

        Candlestick charts technical analysis mein sabse zyada popular hain. Yeh charts price movements ko candlesticks ke zariye represent karte hain, jahan har candlestick ek specific time period ki price action ko show karti hai. Candlestick patterns traders ko market ke sentiment aur potential reversals ke baare mein insight dete hain. Yeh charts trend reversal patterns aur market sentiment ko identify karne ke liye effective hote hain.

        Charts ka analysis karte waqt traders ko patterns aur formations ko samajhna hota hai. Patterns jaise head and shoulders, double tops aur bottoms, aur triangles market ke trends aur reversals ko identify karte hain. In patterns ko dekh kar traders future price movements ke baare mein predictions kar sakte hain aur apne trading decisions ko accordingly plan kar sakte hain.

        4. Candlestick Patterns

        Candlestick patterns technical analysis ka ek aham hissa hain jo market ki price action aur sentiment ko visually represent karte hain. Har candlestick market ke open, high, low, aur close prices ko show karti hai aur traders ko market ke sentiment aur potential reversals ke baare mein information deti hai. Candlestick patterns ko samajhna aur identify karna trading decisions ke liye crucial hota hai.

        Candlestick patterns ko do main types mein categorize kiya ja sakta hai: single candlestick patterns aur multiple candlestick patterns. Single candlestick patterns ek hi candlestick ke basis par market ki price action ko represent karte hain. Examples mein Doji, Hammer, aur Engulfing Patterns shamil hain. Yeh patterns market ke indecision aur potential reversals ko indicate karte hain.

        Multiple candlestick patterns do ya zyada candlesticks ke combination se bante hain aur yeh market ke overall sentiment aur trend reversal ko represent karte hain. Examples mein Morning Star, Evening Star, aur Three Black Crows shamil hain. Yeh patterns market ke trends aur potential reversals ko identify karne mein madadgar hote hain aur traders ko trading decisions lete waqt guidance provide karte hain.

        Candlestick patterns ko interpret karne ke liye traders ko inke formations aur patterns ko detail se samajhna hota hai. Har pattern ka apna significance hota hai aur yeh market ke different phases aur sentiment ko represent karta hai. For example, Hammer aur Hanging Man patterns market ke potential reversals ko indicate karte hain, jabke Engulfing Patterns market ke trend continuation ya reversal ko show karte hain.

        Candlestick patterns ke analysis ko indicators aur other technical tools ke sath combine karna bhi zaroori hota hai. Yeh combination trading decisions ko aur accurate aur effective bana sakta hai. Candlestick patterns ko market ke context aur other factors ke sath mila kar interpret karna traders ko better trading opportunities identify karne mein madad karta hai.

        5. Moving Averages

        Moving averages Forex trading mein ek common aur effective technical indicator hain. Yeh indicators price trends ko smooth out karte hain aur traders ko market ke overall direction aur trends ko identify karne mein madad karte hain. Moving averages ko do main types mein divide kiya ja sakta hai: Simple Moving Average (SMA) aur Exponential Moving Average (EMA).

        Simple Moving Average (SMA) ek average price calculation hai jo ek specified period ke price points ko consider karta hai. For example, 50-day SMA price ke last 50 days ke average price ko represent karta hai. SMA price trends ko smooth out karte hain aur market ke long-term trends ko identify karne mein madad karte hain. Lekin, SMA lagging indicator hai aur yeh price movements ko track karne mein thoda delay kar sakta hai.

        Exponential Moving Average (EMA) ek advanced version hai jo recent price movements ko zyada weightage deta hai. EMA price trends ko zyada quickly reflect karta hai aur short-term trends ko identify karne mein madad karta hai. EMA ke zariye traders market ke rapid changes aur trends ko track kar sakte hain aur timely trading decisions le sakte hain.

        Moving averages ko trading strategies mein use karte waqt traders ko crossovers aur divergences par nazar rakhni hoti hai. Moving average crossovers tab hote hain jab short-term moving average long-term moving average ko cross karta hai. Yeh crossovers market ke trend changes ko indicate karte hain aur trading signals generate karte hain. Divergences tab hoti hain jab price aur moving average ke beech differences hote hain, jo market ke potential reversals ko indicate karte hain.

        Moving averages ko technical analysis ke other indicators aur tools ke sath combine karna bhi zaroori hota hai. Is combination se traders ko market ke trends aur potential trading opportunities ko identify karne mein madad milti hai. Moving averages ko price action aur other technical factors ke sath use karke trading decisions ko refine kiya ja sakta hai.

        6. Relative Strength Index (RSI)

        Relative Strength Index (RSI) ek popular momentum oscillator hai jo price ke speed aur change ko measure karta hai. Yeh indicator overbought aur oversold conditions ko identify karne mein madad karta hai aur traders ko potential reversals aur trend changes ke baare mein information provide karta hai. RSI 0 se 100 ke scale par measure hota hai aur iska typical threshold 70 aur 30 hota hai.

        RSI ka calculation price ke average gains aur losses ke basis par kiya jata hai. Yeh indicator recent price changes ko consider karta hai aur unka ratio measure karta hai. RSI value jab 70 se zyada hoti hai to market ko overbought consider kiya jata hai, jabke 30 se kam value ko oversold consider kiya jata hai. Yeh thresholds traders ko market ke potential reversals aur trading opportunities ke baare mein alert karte hain.

        RSI ke signals ko interpret karte waqt traders ko divergence aur convergence par bhi nazar rakhni hoti hai. Divergence tab hoti hai jab RSI aur price movements ke beech differences hoti hain, jo market ke potential reversals ko indicate karte hain. Convergence tab hoti hai jab RSI aur price movements align karte hain, jo trend continuation ko indicate karta hai.

        RSI ko use karte waqt traders ko iske overbought aur oversold conditions ko market ke context aur other indicators ke sath combine karna zaroori hota hai. Yeh combination traders ko accurate aur reliable trading signals provide karne mein madad karta hai. RSI ko other technical tools ke sath use karke traders ko better trading decisions lene mein madad milti hai.

        RSI ek lagging indicator hai aur yeh price movements ke past data ko analyze karta hai. Isliye, RSI ke signals ko market ke real-time conditions aur other factors ke sath mila kar interpret karna zaroori hota hai. Yeh analysis trading decisions ko enhance karne aur market ke trends ko accurately predict karne mein madad karta hai.

        7. MACD Indicator

        Moving Average Convergence Divergence (MACD) ek trend-following indicator hai jo market ke trend strength aur potential reversals ko identify karne mein madad karta hai. MACD ek combination hai do moving averages ka: the MACD line aur the Signal line. MACD line 12-day aur 26-day EMAs ka difference hoti hai, jabke Signal line 9-day EMA hoti hai.

        MACD line aur Signal line ke crossovers trading signals generate karte hain. Jab MACD line Signal line ko cross karti hai, to yeh bullish signal hota hai aur jab MACD line Signal line ko niche cross karti hai, to yeh bearish signal hota hai. Yeh crossovers market ke trend changes ko indicate karte hain aur traders ko buy ya sell signals provide karte hain.

        MACD histogram bhi ek important part hai jo MACD line aur Signal line ke beech ke difference ko visually represent karta hai. Histogram bars positive ya negative value ke saath hote hain aur yeh market ke trend strength aur momentum ko show karte hain. Histogram ki increasing aur decreasing bars trend strength aur potential reversals ko indicate karte hain.

        MACD ko other technical indicators aur tools ke sath combine karna bhi zaroori hota hai. Yeh combination traders ko accurate aur reliable trading signals provide karta hai. MACD ke signals ko price action aur market ke context ke sath mila kar analyze karna zaroori hota hai taake trading decisions ko refine kiya ja sake.

        MACD indicator ko use karte waqt traders ko iske lagging nature aur potential delays ko bhi samajhna hota hai. MACD ke signals price movements ke past data par based hote hain aur market ke real-time changes ko timely reflect nahi karte. Isliye, MACD ke signals ko dusre factors ke sath mila kar interpret karna zaroori hota hai.

        8. Support Aur Resistance Levels

        Support aur resistance levels Forex trading mein technical analysis ke key components hain. Support level woh price point hota hai jahan market ke niche girne par price stability dikhati hai aur resistance level woh price point hota hai jahan price uthane par market resistance dikhata hai. Yeh levels market ke critical points hote hain aur price movements ko predict karne mein madadgar hote hain.

        Support level market ke demand aur buying pressure ko indicate karta hai. Jab price support level tak pohnchti hai, to buyers ka interest increase hota hai aur price stability dikhati hai. Support level price ke fall hone par ek barrier ke roop mein act karta hai aur traders ko potential buying opportunities provide karta hai.

        Resistance level market ke supply aur selling pressure ko indicate karta hai. Jab price resistance level tak pohnchti hai, to sellers ka interest increase hota hai aur price upward movement ko rok deta hai. Resistance level price ke rise hone par ek barrier ke roop mein act karta hai aur traders ko potential selling opportunities provide karta hai.

        Support aur resistance levels ko identify karne ke liye traders ko price action aur market trends ko analyze karna hota hai. Yeh levels dynamic ho sakte hain aur market ke changing conditions ke sath adjust ho sakte hain. Traders ko market ke historical price data aur chart patterns ko dekh kar support aur resistance levels ko accurately identify karna hota hai.

        Support aur resistance levels ko combine karke traders trendlines aur channels bhi draw kar sakte hain. Trendlines market ke highs aur lows ko connect karke price trends ko track karne mein madad karti hain. Channels parallel trendlines ke form mein hote hain jo price movements ko confine karte hain aur trading opportunities ko identify karne mein madad karte hain.

        9. Trendlines Aur Channels

        Trendlines aur channels technical analysis mein market trends ko track karne ke liye use kiye jate hain. Trendlines ek straight line hoti hai jo market ke highs aur lows ko connect karti hai aur price movements ko visualise karne mein madad karti hai. Channels parallel trendlines ke form mein hoti hain jo price movements ko confine karte hain aur market ke trends ko define karte hain.

        Trendlines ko draw karte waqt traders ko price ke significant highs aur lows ko identify karna hota hai. Trendlines ko connect karne se market ke trend direction aur price movements ko track kiya jata hai. Trendlines ke breakouts aur bounces market ke trend changes aur potential trading opportunities ko indicate karte hain.

        Channels price movements ke range ko define karte hain aur trend ke continuation aur reversals ko identify karne mein madad karte hain. Channels ko draw karte waqt upper aur lower trendlines ko parallel rakha jata hai jo price movements ko confine karti hain. Channels ke breakouts aur bounces traders ko market ke potential reversals aur continuation signals provide karte hain.

        Trendlines aur channels ko use karte waqt traders ko market ke context aur other technical indicators ko bhi consider karna zaroori hota hai. Yeh combination trading signals ko accurate aur reliable bana sakta hai. Trendlines aur channels ko combine karke traders ko better trading decisions lene mein madad milti hai.

        Trendlines aur channels ke analysis ko market ke historical price data aur current conditions ke sath combine karna bhi zaroori hota hai. Yeh analysis trading decisions ko enhance karne aur market ke trends ko accurately predict karne mein madad karta hai. Traders ko trendlines aur channels ko market ke context aur other factors ke sath mila kar interpret karna hota hai.

        10. Fibonacci Retracement

        Fibonacci retracement levels Forex trading mein price corrections aur potential reversal points ko identify karne ke liye use kiye jate hain. Fibonacci retracement levels market ke past price movements ko analyze karke future support aur resistance levels ko predict karte hain. Yeh levels market ke critical points ko identify karne aur trading decisions ko enhance karne mein madadgar hote hain.

        Fibonacci retracement levels Fibonacci sequence ke basis par calculate kiye jate hain. Yeh levels 23.6%, 38.2%, 50%, 61.8%, aur 100% ke hote hain aur price movements ke retracement points ko identify karte hain. Traders in levels ko use karke market ke potential reversal aur correction points ko predict karte hain aur apni trading strategies ko accordingly adjust karte hain.

        Fibonacci retracement levels ko draw karte waqt traders ko market ke significant highs aur lows ko identify karna hota hai. Yeh levels price corrections aur retracement points ko visualise karne mein madad karte hain. Traders in levels ko dekh kar support aur resistance levels ko identify karte hain aur trading decisions ko refine karte hain.

        Fibonacci retracement levels ko combine karke traders other technical indicators aur tools ke sath use kar sakte hain. Yeh combination trading signals ko accurate aur reliable bana sakta hai. Fibonacci retracement levels ke sath moving averages aur other indicators ke use se traders ko better trading decisions lene mein madad milti hai.

        Fibonacci retracement levels ko market ke historical price data aur current trends ke sath mila kar analyze karna bhi zaroori hota hai. Yeh analysis market ke potential reversals aur corrections ko accurately predict karne mein madad karta hai. Traders ko Fibonacci retracement levels ko market ke context aur other factors ke sath combine karna hota hai.

        11. Bollinger Bands

        Bollinger Bands ek volatility indicator hain jo price movements ke fluctuations aur volatility ko measure karte hain. Yeh indicator price ke standard deviations ke basis par set kiye jate hain aur market ki volatility aur potential reversals ko identify karne mein madad karte hain. Bollinger Bands ke teen main components hote hain: middle band, upper band, aur lower band.

        Middle band ek moving average hota hai jo price trends ko smooth out karta hai. Upper aur lower bands price ke standard deviations ke basis par set kiye jate hain aur price movements ke volatility ko represent karte hain. Jab price upper band ke close hoti hai, to market ko overbought consider kiya jata hai, jabke lower band ke close hoti hai to market ko oversold consider kiya jata hai.

        Bollinger Bands ke breakouts aur squeezes market ke potential reversals aur trading opportunities ko indicate karte hain. Jab price bands ko breakout karti hai, to market ke volatility increase hoti hai aur trading opportunities create hoti hain. Squeeze ke waqt bands ke narrow ho jaane se market ki volatility low hoti hai aur potential breakouts ke signals generate hote hain.

        Bollinger Bands ko other technical indicators aur tools ke sath combine karke traders ko accurate trading signals milte hain. Yeh combination trading decisions ko enhance karne aur market ke trends ko accurately predict karne mein madad karta hai. Traders ko Bollinger Bands ko market ke context aur other factors ke sath mila kar analyze karna hota hai.

        Bollinger Bands ko use karte waqt traders ko iske limitations aur potential signals ke false positives ko bhi samajhna hota hai. Bollinger Bands price movements ke past data par based hote hain aur market ke real-time changes ko timely reflect nahi karte. Isliye, Bollinger Bands ke signals ko dusre factors ke sath mila kar interpret karna zaroori hota hai.

        12. Moving Average Convergence Divergence (MACD)

        MACD ek trend-following aur momentum indicator hai jo market ke trend strength aur potential reversals ko identify karne mein madad karta hai. MACD indicator ke do main components hote hain: MACD line aur Signal line. MACD line short-term aur long-term moving averages ka difference hota hai aur Signal line ek moving average hoti hai jo MACD line ko smooth out karti hai.

        MACD line aur Signal line ke crossovers trading signals generate karte hain. Jab MACD line Signal line ko upar ki taraf cross karti hai, to yeh bullish signal hota hai aur jab MACD line Signal line ko niche cross karti hai, to yeh bearish signal hota hai. Yeh crossovers market ke trend changes aur potential trading opportunities ko indicate karte hain.

        MACD histogram bhi ek important component hai jo MACD line aur Signal line ke beech ke difference ko visually represent karta hai. Histogram ke bars positive ya negative value ke sath hote hain aur market ke trend strength aur momentum ko show karte hain. Histogram ki increasing aur decreasing bars market ke trend strength aur potential reversals ko indicate karte hain.

        MACD ko use karte waqt traders ko iske lagging nature aur potential delays ko bhi samajhna hota hai. MACD indicator price movements ke past data ko analyze karta hai aur market ke real-time changes ko timely reflect nahi karta. Isliye, MACD ke signals ko dusre factors aur technical indicators ke sath combine karna zaroori hota hai.

        MACD ko use karte waqt traders ko iske signals ko market ke context aur price action ke sath mila kar interpret karna zaroori hota hai. Yeh combination trading decisions ko enhance karne aur market ke trends ko accurately predict karne mein madad karta hai. MACD ke signals ko other technical tools ke sath use karke traders ko better trading decisions lene mein madad milti hai.

        13. Volume Analysis

        Volume analysis Forex trading mein market ke activity aur liquidity ko understand karne ke liye use kiya jata hai. Volume indicators price movements ke sath trading volume ke relationship ko analyze karte hain aur market ke strength aur potential reversals ko identify karne mein madad karte hain. Volume analysis trading decisions ko enhance karne aur market ke trends ko accurately predict karne mein madadgar hota hai.

        Volume indicators price movements ke volume data ko track karte hain aur market ke activity levels ko represent karte hain. High trading volume market ke strong trends aur momentum ko indicate karta hai, jabke low trading volume market ke weak trends aur potential reversals ko signal karta hai. Traders volume analysis ko price action aur other technical indicators ke sath combine karke trading decisions lete hain.

        Volume analysis ke kuch popular tools mein On-Balance Volume (OBV) aur Chaikin Money Flow (CMF) shamil hain. OBV trading volume aur price movements ke beech ke relationship ko analyze karta hai aur market ke trends aur potential reversals ko identify karta hai. CMF trading volume aur price movements ke combined analysis se market ke liquidity aur buying/selling pressure ko measure karta hai.

        Volume analysis ko other technical indicators aur tools ke sath combine karna bhi zaroori hota hai. Yeh combination traders ko accurate aur reliable trading signals provide karta hai aur trading decisions ko enhance karta hai. Volume analysis ke signals ko price action aur market ke context ke sath mila kar interpret karna zaroori hota hai.

        Volume analysis ko market ke historical data aur current conditions ke sath combine karke traders market ke trends aur potential reversals ko accurately predict kar sakte hain. Yeh analysis trading decisions ko refine karne aur market ke activity levels ko understand karne mein madad karta hai. Traders ko volume analysis ko market ke context aur other factors ke sath mila kar interpret karna hota hai.

        14. Risk Management

        Risk management Forex trading ka ek ahem component hai jo trading decisions ko protect aur enhance karne ke liye use kiya jata hai. Risk management strategies trading capital ko protect karne aur market ke potential losses ko minimize karne mein madad karti hain. Effective risk management trading success aur long-term profitability ke liye zaroori hoti hai.

        Risk management strategies mein stop-loss orders aur take-profit orders shamil hote hain. Stop-loss orders trading positions ko predetermined loss limits par close karne ke liye use kiye jate hain aur take-profit orders profits ko lock karne ke liye use kiye jate hain. Yeh orders trading capital ko protect karne aur potential losses ko control karne mein madad karte hain.

        Position sizing aur leverage management bhi risk management ka important aspect hai. Position sizing traders ko trading capital ke according positions ko determine karne mein madad karta hai aur leverage management traders ko risk ko control karne mein madad karta hai. Effective position sizing aur leverage management trading decisions ko optimize karne aur market ke potential risks ko manage karne mein madad karte hain.

        Risk-reward ratio trading decisions ko evaluate karne aur trading strategies ko optimize karne mein madad karta hai. Risk-reward ratio traders ko potential profits aur potential losses ke beech ka balance dekhne mein madad karta hai aur trading decisions ko refine karne mein help karta hai. Traders ko risk-reward ratio ko market ke context aur trading strategies ke sath mila kar evaluate karna hota hai.

        Risk management strategies ko continuously review aur update karna bhi zaroori hota hai. Market ke changing conditions aur trading performance ke basis par risk management strategies ko adjust karna traders ko better trading decisions lene aur trading capital ko protect karne mein madad karta hai. Effective risk management trading success aur long-term profitability ke liye critical hai.

        • #5 Collapse

          1. Technical Analysis kya hai?


          Technical Analysis aik aisa tajziya ka tareeqa hai jo kisi bhi asset ki past price movements aur trading volumes ka ghor se mutaala karne par mabni hota hai. Is analysis ka maqsad future price trends ko predict karna hota hai. Ye methodology traders aur investors dono ke liye kaam aati hai, magar yeh khas taur par short-term aur medium-term trading ke liye zyada mufeed hai. Ye approach us assumption par mabni hoti hai ke market price saari relevant information ko reflect karti hai aur price movements random nahi hoti, balke unke piche kuch patterns aur trends hote hain.

          Is tajziya mein istimaal hone wale tools aur techniques ka taluq price charts, indicators, aur patterns se hota hai. Technical analysts ka ye maanna hai ke market price data ka tajziya kar ke future price movements ka andaza lagaya ja sakta hai. Iske liye unhon ne kuch distinct tools develop kiye hain, jo price aur volume data ka istemal kar ke market ki trends ko dekhte hain. Yeh tools charts, moving averages, indicators jese ke RSI aur MACD ko shamil karte hain.

          Technical Analysis ki ek ahm baat yeh hai ke yeh analysis market psychology ko bhi samajhne ki koshish karta hai. Market participants ke behavioral patterns, jese ke greed, fear, aur herd behavior, price movements par asar andaz hote hain. Technical Analysis is psychological aspect ko bhi apne analysis mein shamil karta hai. Yeh analysis pure price action par focus karta hai, bina kisi external factors ko madde nazar rakhe.

          Yeh approach un logon ke liye bhi bohot mufeed hoti hai jo daily trading ya scalping jese strategies ko follow karte hain. Technical Analysis ka ek aur bara faida yeh hai ke yeh analysis koi bhi asset class mein apply kiya ja sakta hai, chahe woh stocks ho, commodities ho, currencies ho, ya phir cryptocurrencies ho. Yeh analysis universal hai aur isi liye har qism ke traders ke liye faida mand hai.

          Lekin yeh zaroor yaad rakha jaye ke Technical Analysis ka nateeja hamesha accurate nahi hota. Yeh ek probabilistic approach hai, jisme hamesha uncertainty shamil hoti hai. Isliye risk management strategies ko zaroor apnana chahiye taake kisi bhi unexpected price movement se bacha ja sake. Yeh analysis agar Fundamental Analysis ke sath combine kar diya jaye to bohot powerful results de sakta hai.
          2. Technical Analysis aur Fundamental Analysis ka Farq


          Jab hum Technical Analysis aur Fundamental Analysis ka mutaala karte hain, to humein in donon approaches ke darmiyan bara farq nazar aata hai. Fundamental Analysis aik aisa approach hai jo kisi bhi company ya asset ki asli value ko determine karne par focus karta hai. Yeh analysis company ke financial statements, industry trends, economic indicators, aur other qualitative factors ka tajziya karta hai. Iska maqsad yeh hota hai ke yeh dekha jaye ke kisi bhi asset ki current market price uski intrinsic value se match karti hai ya nahi. Agar current price intrinsic value se kam ho, to yeh buy signal ho sakta hai, aur agar current price intrinsic value se zyada ho, to yeh sell signal ho sakta hai.

          Dousri taraf, Technical Analysis bilkul mukhtalif approach ko follow karta hai. Yeh analysis sirf price aur volume data ka ghor se mutaala karta hai. Technical analysts ka maanna hai ke market price har qism ki information ko reflect karti hai, isliye yeh zaroori nahi ke kisi company ke financials ka tajziya kiya jaye. Technical Analysis ka maqsad price patterns aur trends ko dekhna hota hai taake future price movements ka andaza lagaya ja sake. Yeh analysis short-term aur medium-term trading ke liye zyada relevant hota hai, jabke Fundamental Analysis long-term investing ke liye behtar hota hai.

          Fundamental Analysis investors ke liye zyada mufeed hoti hai jo kisi company ke shares ko lambe arsay ke liye hold karna chahte hain. Is analysis mein investors company ke balance sheet, income statement, aur cash flow statement ka ghor se tajziya karte hain. Yeh analysis economic cycles aur industry trends ko bhi madde nazar rakhta hai. Iske baraks, Technical Analysis traders ke liye zyada mufeed hoti hai jo price movements se fayda uthana chahte hain. Yeh analysis intraday, daily, aur weekly trading ke liye zyada istimaal hoti hai.

          Yeh dono approaches apni jagah par important hain aur aksar investors in dono ko combine karte hain taake zyada behtar results hasil ho sakein. Maslan, koi investor kisi stock ke fundamental analysis se uski intrinsic value ko determine kar sakta hai, aur phir technical analysis ke zariye us stock mein entry aur exit points ko identify kar sakta hai. Is combination se investor apne risk ko kam kar sakta hai aur zyada profitable trades kar sakta hai.

          Lekin yeh yaad rakha jaye ke dono approaches ke apne apne limitations hain. Fundamental Analysis hamesha short-term price movements ko predict nahi kar sakta, aur Technical Analysis hamesha long-term trends ko sahi tarah se identify nahi kar sakta. Isliye dono approaches ke positives aur negatives ko samajhna zaroori hai taake inka sahi istimaal kiya ja sake.
          3. Charts ka Ahmiyat


          Technical Analysis mein charts ka qaleedi kirdar hai, aur yeh kehna ghalat na hoga ke charts Technical Analysis ka backbone hain. Charts prices aur volume data ko visually represent karte hain, aur yeh traders ko trends, patterns, aur price movements ko dekhne mein madad karte hain. Alag alag qism ke charts hain jo mukhtalif types ke data ko represent karte hain, jese ke line charts, bar charts, aur candlestick charts. Yeh sab charts apni jagah par ahmiyat rakhte hain aur traders inko apni zarurat ke mutabiq use karte hain.

          Line charts sabse basic aur simple type ka chart hota hai. Yeh chart sirf closing prices ko show karta hai aur inko line se connect karta hai. Line charts long-term trends ko dekhne ke liye zyada use hote hain, magar yeh short-term price movements ko accurately represent nahi karte. Isliye, jab kisi trader ko short-term trading karni hoti hai, to woh bar charts ya candlestick charts ka istimaal karta hai.

          Bar charts price ke open, high, low, aur close ko show karte hain. Yeh chart zyada information provide karta hai aur isliye zyada advanced traders ke liye useful hota hai. Ismein har bar ek specific time period ko represent karta hai, aur har bar ke upar aur neeche lines high aur low prices ko dikhate hain. Bar charts mein jo information milti hai, woh traders ko price movements ko zyada achi tarah samajhne mein madad deti hai.

          Candlestick charts sabse zyada popular aur istimaal hone wale charts mein se hain. Yeh charts Japanese traders ne 18th century mein develop kiye the, aur ab yeh Technical Analysis ka integral hissa ban chuke hain. Candlestick charts bar charts se milte julte hain, magar yeh visual representation zyada clear hoti hai. Har candlestick ek time period ko represent karta hai, aur iski body price ke open aur close ko dikhati hai, jabke shadows (wicks) price ke high aur low ko represent karte hain. Candlestick charts se price movements ka tajziya karna zyada asaan hota hai, isliye yeh traders ke darmiyan bohot popular hain.

          Charts ka istemal sirf price movements ko dekhne ke liye nahi hota, balke inke zariye traders alag alag indicators aur tools ko bhi apply karte hain jese ke moving averages, Bollinger Bands, aur Fibonacci retracement. Yeh indicators aur tools charts ke sath integrate hote hain aur traders ko price trends aur potential reversal points ko identify karne mein madad karte hain. Charts ka istemal isliye bhi ahmiyat rakhta hai ke yeh historical data ko visually represent karte hain, jisse traders ko price patterns ko identify karna asaan ho jata hai.

          Charts ka ek aur bara faida yeh hai ke yeh traders ko kisi bhi asset ke price data ko instantly analyze karne ka moqa dete hain. Ismein koi bhi complex calculation ya formulas apply nahi karne parte, sirf charts ko dekh kar hi traders ko idea ho jata hai ke market ka trend kya hai. Isliye, charts Technical Analysis mein sabse zyada istimaal hone wale tools hain aur inko samajhna har trader ke liye zaroori hai.
          4. Candlestick Patterns


          Candlestick patterns Technical Analysis mein aik bohot ahm aur popular tool hain. Yeh patterns price movements ko visually represent karte hain aur inke zariye traders ko market ke potential reversals ya continuation signals ka andaza lagane mein madad milti hai. Candlestick patterns ki ek khas baat yeh hai ke yeh price ke open, high, low, aur close ko ek single candlestick mein dikhate hain, jisse traders ko market ka current sentiment samajhne mein asaani hoti hai.

          Candlestick patterns bohot se different types ke hote hain, lekin kuch common patterns jese ke Doji, Hammer, aur Engulfing Pattern zyada mashhoor hain. Doji pattern tab banta hai jab price ka open aur close almost barabar hota hai, aur is pattern se market mein uncertainty ya indecision ka signal milta hai. Doji pattern akser ek potential reversal signal hota hai, jisme market apni direction change karne ke liye tayar hoti hai.

          Hammer pattern aik bullish reversal pattern hai, jo tab banta hai jab price neeche jati hai magar phir recover karke high close hoti hai. Yeh pattern market mein buyers ke strong presence ko show karta hai aur yeh signal hota hai ke price ab upar jane wali hai. Hammer pattern ko aur zyada confirm karne ke liye volume ka bhi tajziya kiya jata hai; agar hammer pattern high volume ke sath banta hai, to yeh zyada strong reversal signal hota hai.

          Engulfing pattern bhi bohot important aur reliable pattern hai. Yeh pattern tab banta hai jab ek choti candlestick ke baad ek badi candlestick banti hai jo pehli candlestick ko completely engulf kar leti hai. Bullish engulfing pattern tab banta hai jab ek red candlestick ke baad ek green candlestick banti hai jo pehli red candlestick ko engulf kar leti hai. Yeh pattern market mein strong buying pressure ko show karta hai aur yeh signal hota hai ke market mein bullish trend shuru ho sakta hai.

          Candlestick patterns ko samajhna aur inka tajziya karna traders ke liye bohot zaroori hai, kyunki yeh patterns market ke sentiment aur potential price movements ke baare mein valuable information dete hain. Lekin yeh yaad rakha jaye ke candlestick patterns ka istimaal sirf standalone signal ke tor par nahi kiya jata. In patterns ko dusre indicators aur tools ke sath combine karke use kiya jata hai taake zyada accurate aur reliable trading decisions liye ja sakein.

          Candlestick patterns ke tajziye mein ek aur zaroori baat yeh hai ke yeh patterns har time frame mein dekhe ja sakte hain, chahe woh daily charts ho, hourly charts ho, ya phir minute charts ho. Yeh flexibility candlestick patterns ko aur zyada powerful aur useful banati hai, jise kisi bhi qism ke trader, chahe woh day trader ho ya swing trader, apne trading style ke mutabiq use kar sakta hai.

          Candlestick patterns ko use karne ka ek aur bara faida yeh hai ke yeh patterns price action ka asaan aur visual representation dete hain. Yeh patterns ek glance mein market ka current sentiment aur potential future movement ko highlight kar dete hain. Isliye, candlestick patterns ko samajhna aur inka sahi istimaal karna har technical analyst ke liye bohot zaroori hai.
          5. Support aur Resistance Levels


          Support aur resistance levels Technical Analysis ke do bohot important concepts hain, aur inko samajhna har trader ke liye lazmi hai. Yeh levels market ke aise points hote hain jahan price ko ya to support milta hai ya phir resistance face karna padta hai. Support level wo point hota hai jahan price girti hai magar wahan se buyers ke strong interest ke wajah se phir se upar jane lagti hai. Resistance level wo point hota hai jahan price upar jati hai magar wahan se sellers ke strong interest ke wajah se neeche girne lagti hai.

          Support aur resistance levels ko identify karne ka tareeqa bohot asaan hai, lekin inka sahi tajziya karna thoda mushkil ho sakta hai. Support level aksar price ke previous lows par banta hai, aur resistance level aksar price ke previous highs par. Yeh levels static bhi ho sakte hain aur dynamic bhi, magar inka zyada reliable hona market ke sentiment aur volume ke mutabiq hota hai.

          Ek baar support ya resistance level identify ho jata hai, to yeh trader ke liye buying ya selling decision ka ahm point ban jata hai. Agar price support level ke qareeb hoti hai aur wahan se bounce karti hai, to yeh buying ka signal hota hai. Agar price resistance level ke qareeb hoti hai aur wahan se reverse hoti hai, to yeh selling ka signal hota hai. Lekin agar price kisi support ya resistance level ko break kar deti hai, to yeh signal hota hai ke market mein ek naya trend shuru ho sakta hai.

          Support aur resistance levels ko aur zyada confirm karne ke liye traders dusre tools aur indicators ka bhi istimaal karte hain, jese ke moving averages, Bollinger Bands, aur Fibonacci retracement levels. In tools ka istemal support aur resistance levels ko zyada accurately identify karne mein madad deta hai. Maslan, agar kisi support level par ek moving average bhi hai, to yeh level aur zyada strong support level ban jata hai.

          Support aur resistance levels ka ek aur faida yeh hai ke yeh risk management ke liye bhi useful hote hain. Traders in levels par stop-loss orders place kar sakte hain taake agar price expected direction mein nahi jati, to trade ko automatically close kar diya jaye aur losses ko minimize kiya jaye. Yeh levels trading strategy ka integral hissa hote hain, aur inko sahi tarah se identify karna aur use karna har trader ke liye zaroori hai.

          Support aur resistance levels ko samajhne ka ek aur important aspect yeh hai ke yeh levels market ke sentiment ko bhi reflect karte hain. Support level par buyers ke strong interest ko show karta hai, jabke resistance level par sellers ke strong interest ko highlight karta hai. Yeh levels market ke trend reversal ya continuation ka signal bhi de sakte hain, isliye inka tajziya karna technical analysis ka ek bohot important hissa hai.
          6. Moving Averages


          Moving averages Technical Analysis ke bohot ahm tools hain jo price data ko smooth karne aur trend direction ko identify karne mein madad karte hain. Yeh averages price ke upar ya neeche fluctuation ko eliminate kar ke ek smooth line draw karte hain, jo ke market ka overall trend dikhata hai. Moving averages ka istimaal bohot asani se kiya ja sakta hai, aur yeh tools technical analysts ke darmiyan bohot popular hain.

          Moving averages do basic types ke hote hain: Simple Moving Average (SMA) aur Exponential Moving Average (EMA). Simple Moving Average ek specific time period ka average hota hai, jise kisi specific number of closing prices ko add karke divide kar ke nikala jata hai. Is average ko har din update kiya jata hai, aur yeh price ko smooth kar ke ek straight line banata hai jo price ke fluctuations ko eliminate karne mein madadgar hoti hai.

          Exponential Moving Average (EMA) ek aur qism ka moving average hai, jo recent prices ko zyada weightage deta hai. Is wajah se EMA zyada sensitive hota hai aur price changes par jaldi react karta hai. EMA ko short-term trading ke liye zyada mufeed samjha jata hai, kyunki yeh short-term price trends ko accurately represent karta hai. EMA aur SMA ka comparison karne se traders ko market ke different trends ko samajhne mein madad milti hai.

          Moving averages ko sirf trend identification ke liye nahi, balke trade signals generate karne ke liye bhi istimaal kiya jata hai. Jab price moving average ke upar cross karti hai, to yeh ek bullish signal hota hai, jo ke buying ka indication deta hai. Aur jab price moving average ke neeche cross karti hai, to yeh ek bearish signal hota hai, jo ke selling ka indication hota hai. Moving averages ka ye signal zyada reliable hota hai jab yeh dusre indicators ke sath confirm hota hai, jese ke RSI ya MACD ke sath.

          Moving averages ka ek aur important istimaal support aur resistance levels ko identify karna hai. Akser price moving averages ke kareeb aakar support ya resistance face karti hai. Agar price moving average ko break kar jaye, to yeh signal hota hai ke market mein trend change ho sakta hai. Is wajah se moving averages ka tajziya karke traders ko entry aur exit points ko identify karna asaan hota hai.

          Ek aur tareeqa jisme moving averages ko use kiya jata hai, wo hai moving average crossovers. Jab short-term moving average long-term moving average ko cross karta hai, to yeh ek strong trading signal hota hai. Maslan, agar 50-day moving average 200-day moving average ko upar se neeche cross karta hai, to yeh bearish signal hota hai, jise "death cross" kaha jata hai. Aur agar 50-day moving average 200-day moving average ko neeche se upar cross karta hai, to yeh bullish signal hota hai, jise "golden cross" kaha jata hai.
          7. Volume Indicators


          Volume indicators Technical Analysis mein market ki activity aur trend strength ko measure karne ke liye bohot useful hote hain. Volume, kisi bhi specific time period mein traded shares ya contracts ki total quantity ko dikhata hai. Yeh indicators market ke trend ke sath volume ka tajziya karke potential trend reversals ya continuations ka signal dete hain. Volume indicators traders ko market mein liquidity aur strength ko samajhne mein madad karte hain.

          Volume indicators ki kuch common types mein Volume Moving Average (VMA), On-Balance Volume (OBV), aur Accumulation/Distribution Line shamil hain. Volume Moving Average (VMA) ek specific time period ka average volume hota hai, aur is average ko chart par draw karke market ki volume trend ko dekhne mein madad milti hai. Yeh indicator zyada istimaal hota hai jab volume aur price movements ke darmiyan correlation ko check karna hota hai.

          On-Balance Volume (OBV) ek aur bohot popular volume indicator hai. Yeh indicator volume ko cumulative basis par calculate karta hai, jisme agar price upar jaye to volume OBV mein add kiya jata hai, aur agar price neeche jaye to volume OBV se subtract kiya jata hai. OBV ka tajziya karke traders ko market ke bullish ya bearish trends ka andaza lagane mein madad milti hai. Agar OBV price ke sath move kar raha ho, to yeh signal hota hai ke trend strong hai. Lekin agar OBV price se diverge kar raha ho, to yeh signal hota hai ke trend weak ho raha hai aur market mein reversal aa sakta hai.

          Accumulation/Distribution Line ek aur volume indicator hai jo price aur volume ke darmiyan relationship ko measure karta hai. Yeh indicator price ke close aur range ke darmiyan relationship ko dekhte hue volume ka tajziya karta hai. Is indicator ka faida yeh hai ke yeh price action ke sath sath volume ko bhi incorporate karta hai, jisse traders ko market ke trend aur sentiment ko accurately assess karne mein madad milti hai.

          Volume indicators ko use karne ka ek aur tareeqa yeh hai ke inko dusre indicators ke sath combine karke use kiya jaye. Maslan, agar price ek strong trend mein hai aur us trend ke sath volume bhi increase ho raha hai, to yeh signal hota hai ke trend strong hai aur ismein continuity aane ki zyada possibilities hain. Lekin agar price ek strong trend mein hai magar volume decrease ho raha hai, to yeh signal hota hai ke trend weak ho raha hai aur usmein reversal aane ke chances hain.

          Volume indicators ka ek aur bara faida yeh hai ke yeh market ke big players ke actions ko identify karne mein madadgar hote hain. Agar kisi specific price level par volume bohot zyada increase ho jaye, to yeh signal hota hai ke market mein koi big player enter ya exit kar raha hai. Yeh information traders ke liye bohot valuable hoti hai, kyunki yeh unko market ke potential reversals ya breakouts ka pehle se andaza lagane mein madad deti hai.
          8. Relative Strength Index (RSI)


          Relative Strength Index (RSI) ek momentum oscillator hai jo price movements ki speed aur change ko measure karta hai. RSI ko 1978 mein J. Welles Wilder ne develop kiya tha, aur tab se yeh Technical Analysis ka ek ahm hissa ban chuka hai. RSI 0 se 100 ke darmiyan fluctuate karta hai aur iski values price ke overbought ya oversold hone ka signal deti hain.

          Agar RSI 70 se upar ho, to yeh signal hota hai ke market overbought hai aur yeh selling signal ho sakta hai. Iska matlab yeh hota hai ke price bohot tez upar gayi hai aur ab ismein correction ya reversal aasakta hai. Lekin agar RSI 30 se neeche ho, to yeh signal hota hai ke market oversold hai aur yeh buying signal ho sakta hai. Iska matlab yeh hota hai ke price bohot neeche gir gayi hai aur ab ismein bounce aasakta hai.

          RSI ka ek aur istimaal divergence ko identify karna hota है. Agar price upar jati hai magar RSI neeche jata hai, to yeh bearish divergence hota है aur yeh signal hota है ke market mein reversal aasakta है. Aur agar price neeche jati है magar RSI upar jata है, to yeh bullish divergence hota है aur yeh signal hota है ke market mein reversal aasakta है.

          RSI ka ek aur popular istimaal RSI ke crossover signals ko dekhna hota है. Jab RSI 30 se upar cross karta है, to yeh buying signal hota है, aur jab RSI 70 se neeche cross karta है, to yeh selling signal hota है. Lekin yeh signals zyada reliable tab hote हैं jab yeh dusre indicators aur tools ke sath confirm hote हैं. Isliye, RSI ko akela use karna zyada profitable nahi hota, balki isko dusre tools ke sath combine karke use karna chahiye.

          RSI ko short-term aur medium-term trading ke liye zyada useful samjha jata है. Yeh indicator price ke momentum ko accurately measure karta है aur traders ko potential trend reversals ya continuation ka pehle se andaza lagane mein madad deta है. Lekin RSI ko overbought ya oversold conditions ke sath sath market ke overall trend ko bhi madde nazar rakhte hue dekhna chahiye. Maslan, agar market ek strong uptrend mein hai aur RSI overbought hai, to iska matlab yeh nahi ke market immediately reverse karega; market kuch time ke liye overbought zone mein reh sakta hai.

          RSI ka tajziya karke traders apne trading decisions ko improve kar sakte hain. Yeh indicator unko entry aur exit points ko identify karne mein madad deta hai aur market ke sentiment aur momentum ko samajhne mein help karta hai. Isliye, RSI ko Technical Analysis ke toolkit mein zaroor shamil karna chahiye aur iska sahi tarah se istimaal karna chahiye.
          9. MACD (Moving Average Convergence Divergence)


          MACD (Moving Average Convergence Divergence) ek aur popular momentum indicator hai jo two different moving averages ke darmiyan relationship ko measure karta hai. Yeh indicator 1970s mein Gerald Appel ne develop kiya tha aur tab se yeh traders aur analysts ke darmiyan bohot popular hai. MACD ka tajziya karke traders ko market ke trend aur momentum ko accurately assess karne mein madad milti hai.

          MACD indicator do main components par mabni hota hai: MACD line aur Signal line. MACD line do exponential moving averages ka difference hota hai, jabke Signal line MACD line ka exponential moving average hota hai. Jab MACD line Signal line ko upar se cross karti hai, to yeh bullish signal hota hai, aur jab MACD line Signal line ko neeche se cross karti hai, to yeh bearish signal hota hai.

          MACD ka ek aur important component histogram hota hai, jo ke MACD line aur Signal line ke darmiyan distance ko represent karta hai. Histogram positive hota hai jab MACD line Signal line ke upar hoti hai, aur negative hota hai jab MACD line Signal line ke neeche hoti hai. MACD histogram ke tajziye se traders ko market ke trend strength aur potential reversals ka andaza lagane mein madad milti hai.

          MACD ka istimaal long-term aur short-term trading dono ke liye hota hai. Lekin is indicator ko short-term trading mein zyada useful samjha jata hai, kyunki yeh price ke short-term trends aur momentum ko accurately capture karta hai. MACD ka tajziya karke traders ko entry aur exit points ko identify karne mein madad milti hai, aur yeh indicator unko trend continuation ya reversal ke signals provide karta hai.

          MACD ka ek aur istimaal divergence ko identify karna hota hai. Agar price upar jati hai magar MACD neeche jata hai, to yeh bearish divergence hota hai aur yeh signal hota hai ke market mein reversal aasakta hai. Aur agar price neeche jati hai magar MACD upar jata hai, to yeh bullish divergence hota hai aur yeh signal hota hai ke market mein reversal aasakta hai.

          MACD ko dusre indicators ke sath combine karke use karne se trading signals zyada reliable hote hain. Maslan, agar MACD aur RSI dono ek hi direction mein signal de rahe hain, to yeh signal zyada strong hota hai. Isliye, MACD ko akela use karna zyada profitable nahi hota, balki isko dusre tools ke sath combine karke use karna chahiye.

          MACD ko Technical Analysis ke toolkit mein zaroor shamil karna chahiye kyunki yeh indicator price ke momentum aur trend ko accurately measure karta hai. Is indicator ka sahi tajziya kar ke traders apne trading decisions ko improve kar sakte hain aur market ke sentiment aur potential price movements ko accurately predict kar sakte hain.
          10. Bollinger Bands


          Bollinger Bands Technical Analysis mein ek aur important tool hain jo price movements ke volatility ko measure karne mein madadgar hote hain. Yeh indicator 1980s mein John Bollinger ne develop kiya tha aur tab se yeh traders ke darmiyan bohot popular hai. Bollinger Bands three lines par mabni hoti hain: ek middle band jo ke simple moving average hota hai, aur do outer bands jo ke middle band se ek specific standard deviation distance par hoti hain.

          Bollinger Bands ka tajziya karke traders ko market ke volatility aur potential price movements ko samajhne mein madad milti hai. Jab price bands ke kareeb hoti hai, to yeh signal hota hai ke market mein high volatility hai, aur jab price bands ke beech mein hoti hai, to yeh signal hota hai ke market mein low volatility hai. Bollinger Bands ka tajziya karke traders ko market ke trend aur potential reversals ka pehle se andaza lagane mein madad milti hai.

          Bollinger Bands ka ek aur important istimaal price breakouts ko identify karna hota hai. Jab price upper band ko break karti hai, to yeh signal hota hai ke market overbought hai aur yeh selling signal ho sakta hai. Aur jab price lower band ko break karti hai, to yeh signal hota hai ke market oversold hai aur yeh buying signal ho sakta hai. Lekin yeh signals zyada reliable tab hote hain jab yeh dusre indicators ke sath confirm hote hain.

          Bollinger Bands ka ek aur faida yeh hai ke yeh price ke trend aur reversals ko accurately measure karne mein madadgar hote hain. Jab price middle band ke upar hoti hai, to yeh bullish trend ka signal hota hai, aur jab price middle band ke neeche hoti hai, to yeh bearish trend ka signal hota hai. Bollinger Bands ko use kar ke traders ko entry aur exit points ko accurately identify karne mein madad milti hai.

          Bollinger Bands ko dusre indicators ke sath combine karke use karne se trading signals zyada reliable hote hain. Maslan, agar Bollinger Bands aur RSI dono overbought condition ko indicate kar rahe hain, to yeh signal zyada strong hota hai. Isliye, Bollinger Bands ko akela use karna zyada profitable nahi hota, balki isko dusre tools ke sath combine karke use karna chahiye.

          Bollinger Bands ko Technical Analysis ke toolkit mein zaroor shamil karna chahiye kyunki yeh indicator market ke volatility aur trend ko accurately measure karta hai. Is indicator ka sahi tajziya kar ke traders apne trading decisions ko improve kar sakte hain aur market ke sentiment aur potential price movements ko accurately predict kar sakte hain.
          • #6 Collapse

            Technical Analysis in Forex Trading

            Introduction

            Forex trading mein success hasil karne ke liye market movements aur price trends ko samajhna bohot zaroori hota hai. Iske liye ek important tool Technical Analysis hota hai. Technical analysis ka use karke traders market ke historical data, price charts, aur indicators ke zariye future price movements ka andaza lagate hain. Yeh article aapko technical analysis ke basics, iske tools, aur trading mein iske effective use ke baare mein guide karega.

            1. What is Technical Analysis?

            Technical analysis ek trading method hai jo past price data, volume, aur market trends ka analysis kar ke future price movements ka andaza lagane mein madad karta hai. Is analysis ka focus sirf price action aur chart patterns par hota hai, na ke economic fundamentals ya news events par. Technical analysts yeh samajhte hain ke market ki har information price mein hi shamil hoti hai, isliye price ka analysis karna hi kaafi hota hai.
            • Price Action: Price action technical analysis ka central concept hota hai. Yeh kehta hai ke market ke price movements ko dekh kar future price behavior ka andaza lagaya ja sakta hai.
            • Chart Patterns: Price data ka visual representation charts ke zariye kiya jata hai, jisme candlestick charts, bar charts, aur line charts shamil hote hain. In charts ko dekh kar traders patterns identify karte hain jo specific market conditions ko represent karte hain.
            2. Key Tools in Technical Analysis

            Technical analysis mein kuch important tools aur indicators ka use kiya jata hai jo market ke trends aur reversals ko identify karne mein madad karte hain.
            • Moving Averages: Moving averages price data ka average hota hai jo time ke saath change hota rehta hai. Yeh market ke trends ko smooth out karne mein madad karta hai aur long-term trends ko identify karne ke liye use hota hai. Commonly used moving averages mein Simple Moving Average (SMA) aur Exponential Moving Average (EMA) shamil hain.
            • Relative Strength Index (RSI): RSI ek momentum oscillator hai jo market ke overbought aur oversold conditions ko identify karne mein madad karta hai. Yeh 0 se 100 ke range mein hota hai, jisme 70 se upar overbought aur 30 se neeche oversold conditions ko indicate karta hai.
            • Fibonacci Retracement: Fibonacci retracement tool market ke pullbacks aur reversal points ko identify karne ke liye use hota hai. Yeh tool specific levels (jese ke 38.2%, 50%, aur 61.8%) draw karta hai jo potential support aur resistance levels ko indicate karte hain.
            • Support and Resistance Levels: Support aur resistance levels woh price points hote hain jahan market ka price rukta ya reverse hota hai. Support levels wo hoti hain jahan buying pressure increase hota hai, aur resistance levels wo hoti hain jahan selling pressure barhta hai.
            3. Benefits of Technical Analysis in Forex Trading

            Technical analysis forex trading mein bohot se benefits offer karta hai jo traders ke decision-making process ko improve karte hain.
            • Trend Identification: Technical analysis ke tools ka use karke aap market ke prevailing trends ko identify kar sakte hain. Yeh aapko trend-following strategies banane mein madad karta hai jo profitable trading opportunities create kar sakta hai.
            • Entry and Exit Points: Technical analysis aapko sahi entry aur exit points identify karne mein madad karta hai. Yeh aapko overbought aur oversold conditions ko samajhne ka moka deta hai, jo aapki trades ke timing ko improve karta hai.
            • Risk Management: Technical analysis aapko risk management strategies banane mein bhi madad karta hai. Iske zariye aap stop-loss aur take-profit levels set kar sakte hain, jo aapke risk ko manage karne mein helpful hote hain.
            4. Limitations of Technical Analysis

            Har trading method ki tarah, technical analysis ke bhi kuch limitations hote hain jinka traders ko khayal rakhna chahiye.
            • Lagging Indicators: Bohot se technical indicators lagging hote hain, yani yeh past data par base karte hain aur kabhi kabhi market ke current conditions ko accurately predict nahi kar paate.
            • Subjectivity: Technical analysis mein patterns aur trends ki identification kabhi kabhi subjective hoti hai. Do alag traders ek hi chart ko dekh kar different conclusions nikal sakte hain, jo decision-making ko mushkil bana sakta hai.
            • No Guarantee of Success: Technical analysis market ke movements ka andaza lagane mein madad karta hai, lekin yeh 100% accurate nahi hota. Market unpredictable hai, aur technical analysis ke signals bhi kabhi kabhi fail ho sakte hain.
            Conclusion

            Technical Analysis forex trading mein ek powerful tool hai jo traders ko market ke trends aur future price movements ka andaza lagane mein madad karta hai. Yeh tools aur indicators ka use karke aap apne trading decisions ko better bana sakte hain aur profitable opportunities dhoondh sakte hain. Lekin, technical analysis ke limitations ka khayal rakhna zaroori hai, aur aapko apni strategies mein risk management aur fundamental analysis ko bhi include karna chahiye taake aapki overall trading success ka chance barh sake.
            • #7 Collapse

              Technical Analysis in Forex Trading

              1. Forex Trading Ki Bunyadi Maloomat

              Forex trading, yaani ke foreign exchange trading, duniya ke sab se bara aur liquid market hai. Har din trillions of dollars ka exchange hota hai, aur yeh market 24 ghante, 5 din chalta hai. Forex trading me currencies ko ek dosre ke sath exchange kiya jata hai, aur is trading ka maqsad price ke movements ko analyze kar ke faida kamana hota hai. Is market me major currencies jaise US Dollar, Euro, Yen aur Pound sab se zyada trade hoti hain. Traders market ki volatility ka faida uthate hain, jahan unhe choti choti price movements par bhi faida mil sakta hai.

              Forex trading me successful hone ke liye, traders ko market ke trends aur patterns ko samajhna zaroori hota hai. Iske liye unhe technical analysis aur fundamental analysis dono ka knowledge hona chahiye. Technical analysis me price charts aur indicators ka istemal karke market ki future direction ka estimation kiya jata hai, jabke fundamental analysis economic indicators aur news events par focus karta hai. Forex market me trading strategies aur risk management techniques bhi bohot important hain.

              Trading ke dauran, traders ko market ki fluctuations aur uncertainties ka samna karna padta hai. Isliye, unhe trading plan aur strategy develop karni hoti hai jo unki risk tolerance aur financial goals ke mutabiq ho. Forex trading me discipline aur patience bhi bohot zaroori hote hain, kyunki market ke fluctuations ko handle karna aur timely decisions lena trading success ke key factors hain.

              2. Technical Analysis Kya Hai?

              Technical analysis ek aisa method hai jisme market ke historical data ka analysis kiya jata hai. Is analysis ka maqsad market ke price movements ko samajhna aur future price trends ko predict karna hota hai. Technical analysts price charts aur various indicators ka istemal karte hain jo market ke behaviour ko samajhne me madad dete hain. Yeh analysis primarily past price data aur trading volume par base hota hai, aur market ke psychological aspects ko bhi consider karta hai.

              Technical analysis me traders price charts par different patterns aur formations dekhte hain jo market ke future movements ko predict karne me help karte hain. Yeh patterns aur formations market ke traders ke behavior aur sentiment ko reflect karte hain. Technical indicators jaise moving averages, oscillators, aur trend lines bhi market ki direction aur strength ko measure karne me use kiye jate hain.

              Is analysis ki key premise yeh hai ke market me jo information hai wo already price movements me reflect hoti hai. Isliye, past price data ko analyze karna future price movements ko predict karne me madadgar hota hai. Technical analysis ki accuracy aur reliability kaafi had tak trader ke experience aur skills par depend karti hai. Yeh analysis tools aur techniques ko sahi tarah se samajhkar aur unhe effectively use karke, traders apne trading decisions ko improve kar sakte hain.

              3. Price Charts Ka Istemal

              Price charts forex trading me ek important tool hain jo traders ko market ke trends aur patterns ko visualize karne me madad dete hain. Price charts ke through traders market ki past price movements aur volume data ko analyze kar sakte hain. Sab se common types of price charts line charts, bar charts, aur candlestick charts hain. Har chart type ki apni distinct features aur advantages hoti hain.

              Line charts simple aur easy to understand hote hain. Yeh charts price movements ko ek continuous line ke zariye show karte hain, jo closing prices ko connect karti hai. Line charts traders ko long-term trends aur overall market direction dekhne me madad karte hain, lekin inme detailed information nahi hoti.

              Bar charts, on the other hand, zyada detailed information provide karte hain. Bar charts me har bar ek specific time period ke open, high, low, aur close prices ko show karti hai. Yeh charts traders ko market ke volatility aur price range ko analyze karne me madad karte hain. Bar charts ko use karke traders price patterns aur trend reversals ko identify kar sakte hain.

              Candlestick charts forex trading me bohot popular hain, kyunki yeh charts market ke price movements ko ek visual aur informative way me show karte hain. Har candlestick ek specific time period ke open, high, low, aur close prices ko represent karti hai, aur isme color coding hoti hai jo bullish aur bearish price movements ko indicate karti hai. Candlestick patterns traders ko market ki sentiment aur potential reversals ke signals dete hain.

              4. Trend Analysis

              Trend analysis technical analysis ka ek crucial component hai. Market trends ko identify karna traders ko market ki overall direction samajhne me madad karta hai. Trends ko teen categories me classify kiya jata hai: uptrends, downtrends, aur sideways trends. Uptrend wo hota hai jahan price higher highs aur higher lows banati hai, downtrend wo hota hai jahan price lower highs aur lower lows banati hai, aur sideways trend wo hota hai jahan price range-bound rehti hai.

              Trendlines ek common tool hain jo trends ko visually represent karte hain. Uptrend line higher lows ko connect karti hai, jabke downtrend line lower highs ko connect karti hai. Trendlines traders ko market ki direction aur strength ko gauge karne me madad karte hain. Iske alawa, moving averages bhi trends ko identify karne me use kiye jate hain. Moving averages price data ko smooth karte hain aur trends ko clearly highlight karte hain.

              Trends ko analyze karte waqt traders ko market ke momentum ko bhi consider karna chahiye. Momentum indicators, jaise RSI aur MACD, market ke strength aur weakness ko measure karte hain aur trends ki sustainability ko assess karne me madad karte hain. Trend analysis me traders ko price patterns aur historical data ka bhi analysis karna chahiye, jo future trends ke potential reversals aur continuation signals ko identify karne me madadgar hota hai.

              Effective trend analysis me patience aur discipline zaroori hai, kyunki trends ko accurately identify karne aur unke sath align hone me waqt lag sakta hai. Traders ko choti choti price movements aur noise se bachkar long-term trends par focus karna chahiye. Trend analysis ke sath risk management aur proper trading strategy bhi zaroori hai taake market ke fluctuations ko handle kiya ja sake.

              5. Support Aur Resistance Levels

              Support aur resistance levels forex trading me key technical concepts hain. Support level wo price point hota hai jahan se market ki price niche ki taraf move karne se pehle support paati hai. Resistance level wo price point hota hai jahan se market ki price upar ki taraf move karne se pehle resistance face karti hai. Yeh levels market ke supply aur demand dynamics ko reflect karte hain aur traders ko potential reversal points identify karne me help karte hain.

              Support aur resistance levels ko horizontal lines ke zariye price charts par draw kiya jata hai. Jab price support level tak pahunchti hai aur wahan se bounce karti hai, to yeh indication hota hai ke support level strong hai. Similarly, jab price resistance level ko test karti hai aur wahan se decline hoti hai, to yeh indication hota hai ke resistance level effective hai.

              In levels ko analyze karte waqt traders ko price action aur volume data ko bhi consider karna chahiye. High volume levels support aur resistance levels ko confirm karte hain aur trends ko validate karte hain. Traders ko past price movements aur historical data ka analysis karke support aur resistance levels ki accuracy ko assess karna chahiye.

              Support aur resistance levels ke breakouts bhi trading opportunities provide karte hain. Jab price support level ko break karti hai to yeh bearish signal hota hai, aur jab price resistance level ko break karti hai to yeh bullish signal hota hai. Breakouts ko confirm karne ke liye traders ko additional indicators aur analysis tools ka istemal karna chahiye.

              6. Moving Averages

              Moving averages forex trading me ek commonly used indicator hain jo price data ko smooth karne aur trends ko identify karne me madad karte hain. Simple Moving Average (SMA) aur Exponential Moving Average (EMA) do major types hain jo traders ke analysis me use kiye jate hain. SMA ek average hai jo specific time period ke closing prices ko equal weightage deta hai, jabke EMA recent prices ko zyada weightage deta hai.

              SMA ka calculation relatively simple hota hai: aap ek specific time period ke closing prices ko add karke us number ko time period se divide kar dete hain. Isse ek average value milti hai jo price chart par plot ki jati hai. SMA ko use karke traders trends aur price movements ko analyze karte hain, aur iske crossovers ko trading signals ke roop me interpret karte hain.

              EMA ka calculation thoda complex hota hai, lekin isse recent price movements ka zyada accurate reflection milta hai. EMA ko calculate karne ke liye, ek smoothing factor aur previous period ki EMA value ka use kiya jata hai. EMA ki faster response aur recent price movements ko reflect karne ki ability isse traders ke liye valuable tool banaati hai.

              Moving averages ko trading strategies me integrate karte waqt, traders ko multiple time frames ka analysis karna chahiye. Short-term moving averages long-term moving averages ke sath compare kiye jate hain taake crossovers aur trend reversals ko identify kiya ja sake. Moving averages ke sath additional indicators aur analysis tools ka istemal bhi important hai taake market ki overall direction aur strength ko accurately assess kiya ja sake.

              7. RSI (Relative Strength Index)

              RSI ek momentum oscillator hai jo market ke overbought aur oversold conditions ko identify karne me madad karta hai. Yeh index 0 se 100 tak range karta hai, aur 70 ke upar aur 30 ke neeche levels ko overbought aur oversold conditions ke signals ke roop me interpret kiya jata hai. RSI traders ko market ki strength aur momentum ko assess karne me madad karta hai.

              RSI ka calculation average gain aur average loss ko measure karke kiya jata hai. Yeh indicator price movements aur trends ke direction ko analyze karne ke liye use hota hai. Jab RSI 70 ke upar hota hai, to market overbought condition me hota hai aur potential reversal ka signal hota hai. Jab RSI 30 ke neeche hota hai, to market oversold condition me hota hai aur upward reversal ka signal hota hai.

              RSI ko use karte waqt traders ko divergence aur convergence analysis bhi consider karna chahiye. Agar price aur RSI ke movements match nahi karte, to yeh divergence ka indication hota hai jo potential trend reversal ka signal hota hai. RSI ko moving averages aur other technical indicators ke sath combine kar ke trading decisions ko confirm kiya ja sakta hai.

              RSI ki accuracy aur reliability traders ke experience aur analysis skills par depend karti hai. Yeh indicator market ke short-term movements aur momentum ko capture karta hai, lekin long-term trends ko analyze karne ke liye additional tools aur techniques ka istemal zaroori hai. RSI ko effectively use karne ke liye, traders ko market ke overall context aur other technical factors ko bhi consider karna chahiye.

              8. MACD (Moving Average Convergence Divergence)

              MACD ek popular technical indicator hai jo trend reversal aur momentum ko measure karta hai. Yeh indicator do moving averages ke beech ke difference ko calculate karta hai aur signal line ke sath compare karta hai. MACD ke three main components hain: MACD line, Signal line, aur Histogram.

              MACD line short-term aur long-term moving averages ke beech ka difference hota hai. Signal line ek moving average hoti hai jo MACD line ko smooth karti hai aur trading signals ko generate karti hai. Histogram MACD line aur Signal line ke beech ka difference dikhata hai aur market ke momentum ko reflect karta hai.

              MACD ko use karte waqt traders crossovers aur divergences ko observe karte hain. Jab MACD line Signal line ko upar se neeche cross karti hai, to yeh bearish signal hota hai, aur jab MACD line Signal line ko neeche se upar cross karti hai, to yeh bullish signal hota hai. Histogram ke bars ki length aur direction bhi market ke momentum aur strength ko indicate karti hai.

              MACD ki effectiveness aur reliability kaafi had tak market ke context aur trading conditions par depend karti hai. Is indicator ko use karte waqt, traders ko price patterns, support aur resistance levels, aur other technical indicators ko bhi consider karna chahiye. MACD ko combine kar ke comprehensive trading strategies develop ki ja sakti hain jo market ke trends aur momentum ko accurately capture kar sakti hain.

              9. Fibonacci Retracement Levels

              Fibonacci retracement levels ek technical analysis tool hain jo price corrections aur potential reversal points ko identify karne me madad karte hain. Yeh levels Fibonacci sequence par based hote hain, jahan har number pehle do numbers ka sum hota hai. Commonly used Fibonacci levels hain 23.6%, 38.2%, 50%, 61.8%, aur 76.4%.

              Fibonacci retracement levels ko price charts par plot kiya jata hai taake market ke potential reversal points ko identify kiya ja sake. Jab market ek significant price movement ke baad retrace hota hai, to Fibonacci levels price corrections aur support/resistance levels ko identify karne me madad karte hain. Traders in levels ko use karke entry aur exit points ko plan kar sakte hain.

              Fibonacci retracement levels ke sath, traders ko trendlines aur other technical indicators ka bhi istemal karna chahiye taake levels ki accuracy ko validate kiya ja sake. Fibonacci levels ko market ke context aur price patterns ke sath combine karke trading decisions ko confirm karna chahiye. Yeh levels market ke psychological levels ko bhi reflect karte hain, jahan price ke reactions predictable hote hain.

              Fibonacci retracement levels ki effectiveness market ke volatility aur trend strength par depend karti hai. Traders ko in levels ko proper analysis aur market context ke sath use karna chahiye taake accurate predictions aur trading decisions kiye ja sake. Fibonacci levels ko trading strategies me integrate kar ke, traders market ke potential reversals aur corrections ko effectively capture kar sakte hain.

              10. Candlestick Patterns

              Candlestick patterns forex trading me ek valuable tool hain jo price action aur market sentiment ko analyze karne me madad karte hain. Har candlestick ek specific time period ke open, high, low, aur close prices ko represent karti hai, aur isme color coding hoti hai jo bullish aur bearish movements ko indicate karti hai. Candlestick patterns traders ko market ke potential reversals aur continuations ke signals dete hain.

              Common candlestick patterns me doji, hammer, engulfing, aur shooting star shamil hain. Doji pattern market ki indecision aur uncertainty ko show karta hai, jabke hammer pattern potential bullish reversal ke signal ke roop me use hota hai. Engulfing pattern market ke trend reversal ke signals ko indicate karta hai, aur shooting star pattern potential bearish reversal ke signal ko reflect karta hai.

              Candlestick patterns ko use karte waqt traders ko price action aur volume data ko bhi consider karna chahiye. High volume aur significant price movements candlestick patterns ki reliability aur effectiveness ko validate karte hain. Traders ko multiple candlestick patterns aur formations ko analyze kar ke market ke overall sentiment aur direction ko assess karna chahiye.

              Candlestick patterns ki accuracy aur reliability kaafi had tak market ke context aur trading conditions par depend karti hai. Patterns ko effectively identify karne aur unke sath align hone ke liye traders ko experience aur skills ki zaroorat hoti hai. Candlestick patterns ko trading strategies me integrate karke, traders market ke potential reversals aur trend continuations ko accurately predict kar sakte hain.

              11. Volume Analysis

              Volume analysis forex trading me ek important aspect hai jo market ki strength aur weakness ko assess karne me madad karta hai. Volume data market ke trading activity aur liquidity ko reflect karta hai. High volume trends ko confirm karte hain aur low volume movements ko evaluate karne me help karte hain. Volume analysis ko price action aur technical indicators ke sath combine kar ke, traders market ke potential movements aur reversals ko accurately identify kar sakte hain.

              Volume data ko analyze karte waqt traders ko volume spikes aur trends ko observe karna chahiye. High volume spikes price movements ke strength aur sustainability ko indicate karte hain, jabke low volume trends market ke lack of interest aur weak price movements ko reflect karte hain. Volume analysis ko price patterns aur support/resistance levels ke sath combine kar ke, traders market ke key levels aur trends ko validate kar sakte hain.

              Volume analysis ki effectiveness market ke context aur trading conditions par depend karti hai. Traders ko volume data ko technical indicators aur price action ke sath combine kar ke, market ke potential movements aur reversals ko accurately capture karna chahiye. Volume analysis ke sath effective risk management aur trading strategies develop karna bhi zaroori hai taake market ke fluctuations ko handle kiya ja sake.

              12. Divergence Analysis

              Divergence analysis technical analysis ka ek important tool hai jo price aur indicators ke beech ke difference ko study karta hai. Divergence tab hoti hai jab price aur technical indicators ke movements match nahi karte. Positive divergence tab hoti hai jab price lower lows banati hai lekin indicator higher lows banata hai, aur negative divergence tab hoti hai jab price higher highs banati hai lekin indicator lower highs banata hai. Divergence potential trend reversals ke signals ko indicate kar sakti hai.

              Divergence analysis ko use karte waqt traders ko multiple indicators aur price patterns ko analyze karna chahiye. Indicators jaise RSI, MACD, aur Stochastic Oscillator divergence signals ko capture karne me madad karte hain. Divergence analysis ki accuracy aur reliability kaafi had tak market ke context aur trading conditions par depend karti hai.

              Traders ko divergence signals ko confirm karne ke liye additional tools aur techniques ka istemal karna chahiye. Price patterns, support/resistance levels, aur volume analysis divergence signals ki reliability ko validate karne me madad karte hain. Divergence analysis ko trading strategies me integrate kar ke, traders market ke potential trend reversals aur movements ko accurately capture kar sakte hain.

              13. Risk Management Aur Technical Analysis

              Technical analysis ke sath effective risk management forex trading me successful trading ke liye zaroori hai. Risk management strategies jaise stop-loss orders aur position sizing traders ko losses ko limit karne aur profits ko maximize karne me madad karte hain. Stop-loss orders market ke adverse movements se protect karte hain aur traders ko predefined risk levels par trading decisions lene me madad karte hain.

              Position sizing traders ke risk tolerance aur financial goals ke mutabiq hoti hai. Proper position sizing se traders apne trading account ki risk ko manage kar sakte hain aur capital preservation ko ensure kar sakte hain. Risk management strategies ko technical analysis ke sath combine kar ke, traders market ke potential movements aur reversals ko effectively handle kar sakte hain.

              Effective risk management me discipline aur patience zaroori hai. Traders ko trading plan aur strategy ko follow karna chahiye aur market ke fluctuations ko handle karna chahiye. Risk management ke sath technical analysis ko combine kar ke, traders apne trading decisions ko optimize kar sakte hain aur long-term trading success ko achieve kar sakte hain.

              In summary, technical analysis forex trading me ek powerful tool hai jo market ke trends, patterns, aur indicators ko analyze karne me madad karta hai. Is analysis ke zariye traders informed decisions le sakte hain aur apne trading strategies ko optimize kar sakte hain. Lekin, technical analysis ko effective risk management aur additional forms of analysis ke sath combine karna zaroori hai taake market ke fluctuations ko handle kiya ja sake aur trading success ko achieve kiya ja sake.
              • #8 Collapse

                Technical Analysis


                Click image for larger version

Name:	download (5).jfif
Views:	25
Size:	18.4 کلوبائٹ
ID:	13104010


                Technical analysis trading ki ek approach hai jismein price aur volume ka analysis kiya jata hai taake market ki future movements ka andaza lagaya ja sake. Iska focus past price movements aur indicators par hota hai, jisse traders yeh samajhne ki koshish karte hain ke market kis direction mein move karne wala hai.
                Technical Analysis ki Ahmiyat


                Technical analysis is liye ahmiyat rakhta hai kyunki yeh market ke trends aur patterns ko pehchanne mein madad karta hai. Yeh un traders ke liye khaas tor par mufeed hota hai jo short-term trading karte hain. Price movements aur volume ke analysis se traders apne entry aur exit points ka decision lete hain.
                Basic Principles
                1. Price Discounts Everything: Is principle ke mutabiq, market price already saari available information ko reflect karta hai. Iska matlab yeh hai ke humein kisi doosri information ki zarurat nahi hai, sirf price aur volume ke data ko dekh kar hi market ki direction ka andaza lagaya ja sakta hai.
                2. Price Moves in Trends: Technical analysis ka ek aur basic principle yeh hai ke price movements trends mein hote hain. Yeh trends uptrend (price barh raha hai), downtrend (price gir raha hai) ya sideways trend (price zyada change nahi ho raha) ho sakte hain.
                3. History Tends to Repeat Itself: Technical analysis kehte hain ke history apne aap ko dohrati hai. Is principle ke zariye traders past price patterns aur market behavior ko dekh kar future ki movements ka andaza lagate hain.
                Important Technical Indicators
                1. Moving Averages: Moving averages ek basic indicator hai jo past prices ka average leta hai aur usse market ka trend pehchanne mein madad milti hai. Simple moving average (SMA) aur exponential moving average (EMA) do common types hain.
                2. Relative Strength Index (RSI): RSI ek momentum oscillator hai jo 0 se 100 tak ke scale par hota hai. Agar yeh 70 se upar ho to market overbought hai aur agar yeh 30 se neeche ho to market oversold hai.
                3. Moving Average Convergence Divergence (MACD): MACD trend-following momentum indicator hai jo do moving averages ke darmiyan ka difference nikalta hai. Jab MACD signal line se upar hota hai to yeh bullish signal hota hai aur jab neeche hota hai to bearish signal hota hai.
                4. Bollinger Bands: Bollinger Bands price ka range define karti hain jismein price move kar raha hota hai. Upper band resistance ko aur lower band support ko indicate karta hai. Jab price in bands ke bahar jata hai, to yeh trend reversal ka signal hota hai.
                Chart Patterns


                Technical analysis mein different chart patterns bhi use kiye jate hain jo market ke direction ka andaza lagate hain.
                1. Head and Shoulders: Yeh ek reversal pattern hai jismein pehle ek high banta hai (shoulder), phir usse bhi higher high (head), aur phir ek aur shoulder banta hai jo pehli shoulder ke barabar hota hai. Yeh pattern yeh signal deta hai ke uptrend khatam hone wala hai.
                2. Double Top and Double Bottom: Double top ek bearish reversal pattern hai jo price do martaba ek certain level ko touch karne ke baad neeche jata hai. Double bottom bullish reversal pattern hai jismein price do martaba ek low level ko touch karne ke baad upar jata hai.
                3. Triangles: Triangle patterns ek continuation pattern hota hai jismein price ek narrow range mein trade karta hai. Yeh bullish ya bearish ho sakta hai depending on breakout direction.
                4. Flags and Pennants: Yeh short-term continuation patterns hote hain jo ek sharp price movement ke baad bante hain. Flag rectangular shape mein hota hai jabke pennant ek symmetrical triangle hota hai.
                Volume Analysis


                Volume analysis technical analysis ka ek important hissa hai. Jab price aur volume dono increase karte hain to yeh trend continuation ka signal hota hai. Aur agar price increase kar raha ho lekin volume decrease ho raha ho, to yeh trend reversal ka signal ho sakta hai.
                Technical Analysis ke Advantages
                • Price Action Par Focus: Technical analysis sirf price aur volume par focus karta hai, jo ke sabse direct market ki information hoti hai.
                • Market Trends Ki Identification: Is method se traders easily market trends ko identify kar sakte hain, jo ke profitable trades ke liye zaroori hota hai.
                • Short-Term Trading Ke Liye Best: Short-term traders ke liye technical analysis ideal hai kyunki yeh quick market movements par base hota hai.
                Technical Analysis ke Disadvantages
                • Lagging Indicators: Technical indicators aksar lagging hote hain, yani yeh past data par base karte hain, jo ke kabhi kabhi market ki real-time movements ko accurately capture nahi karte.
                • Over-Reliance on Patterns: Patterns aksar repeat hote hain, lekin market ka behavior unpredictable hota hai. Sirf patterns par depend karna kabhi kabhi loss ka sabab ban sakta hai.
                • No Fundamental Analysis: Technical analysis fundamental factors ko consider nahi karta, jo ke long-term trading ke liye zaroori hote hain.
                Conclusion


                Technical analysis trading ka ek powerful tool hai, lekin isse samajhne aur use karne ke liye practice aur discipline zaroori hai. Yeh short-term traders ke liye khas tor par beneficial hota hai, lekin long-term investing ke liye fundamental analysis ke sath combine karna better hota hai. Market ke trends, patterns aur indicators ko samajh kar hi traders profitable decisions le sakte hain.
                • #9 Collapse

                  Technical Analysis: Ek Mukammal Guide
                  1. Technical Analysis kya hai?


                  Technical Analysis ek financial research ka tareeqa hai jisme investors aur traders market ke historical price data aur trading volume ka analysis karte hain. Is tareeqay se, wo future price movements ko predict karte hain. Is method mein, market ke trend aur price patterns ka study kiya jata hai, jo investors ko decision making mein madad deta hai. Is mein indicators ka istemal hota hai jo price action ko analyze karte hain aur future ki movement ke bare mein insight dete hain.
                  2. Historical Data ka Ahem Kirdar


                  Technical Analysis ka sab se bara tool historical price aur volume data hota hai. Traders is data ka istemal karte hue market ka behavior samajhte hain aur predict karte hain ke agay kya ho sakta hai. Yeh approach yeh farz karti hai ke market trends repeat hote hain aur history apne aap ko dobara se dohrati hai. Agar price ne pehle kisi certain level par react kiya tha, toh traders kehte hain ke aglay time par bhi waheen se reaction ho sakta hai.
                  3. Price Action ka Matlab


                  Price action woh method hai jisme traders kisi financial asset ki sirf price ko dekh kar decision lete hain, baghair kisi fundamental analysis ya economic factors ke. Iska basic farz yeh hai ke jo bhi information ya news available hoti hai, woh sab kuch price ke ander reflect hota hai. Traders yeh samajhte hain ke kisi bhi asset ki demand aur supply ka asal zikar uski price se hi hota hai.
                  4. Support aur Resistance Levels


                  Support aur resistance levels technical analysis mein bohot important concepts hain. Support level woh price hoti hai jahan asset ki demand itni ziada hoti hai ke price us se neeche nahi ja sakti, jab ke resistance level woh price hoti hai jahan supply ziada hoti hai aur price us se upar nahi ja sakti. In levels ko samajh kar, traders ye dekhte hain ke jab price support ya resistance level par aati hai toh kya woh usay cross karti hai ya wahan se reverse hoti hai.
                  5. Trendlines aur Trend Analysis


                  Trendlines ka use technical traders karte hain taake kisi bhi asset ka general trend samajh sakein. Yeh lines price data ko join karti hain aur dikhati hain ke market ka trend upward hai ya downward. Agar price consistent taur par higher highs aur higher lows banati hai, toh yeh uptrend kehlata hai, jabke lower lows aur lower highs ek downtrend ko dikhate hain. Trendlines traders ko market ke direction ko samajhne mein madad deti hain.
                  6. Moving Averages ka Istemaal


                  Moving averages technical analysis ka ek ahem indicator hai jo price data ko smooth karta hai aur market ka trend dikhata hai. Do tarah ke moving averages hote hain: Simple Moving Average (SMA) aur Exponential Moving Average (EMA). SMA average price ko equal weight deta hai, jabke EMA recent price ko ziada weightage deta hai. Moving averages ko use karte hue, traders support aur resistance levels ko identify karte hain aur market ke reversal points ko pehchan'te hain.
                  7. Relative Strength Index (RSI)


                  RSI ek oscillator hai jo market ki overbought ya oversold condition ko measure karta hai. Yeh indicator 0 se 100 ke scale par chalta hai, jahan 70 se upar ke value ko overbought aur 30 se neeche ke value ko oversold samjha jata hai. Jab market overbought hoti hai, toh yeh indicate karta hai ke price reversal aasakta hai, jabke oversold condition price ke rebound ki nishani hoti hai. RSI traders ko short-term trends ko samajhne mein madad deta hai.
                  8. MACD (Moving Average Convergence Divergence)


                  MACD ek ahem momentum indicator hai jo do moving averages ke darmiyan ka fark dikhata hai. Jab MACD line signal line ko cross karti hai, toh yeh buying ya selling signal hota hai. Is indicator ka main aim market ke momentum ko identify karna hota hai. Jab MACD line upar jati hai, toh market bullish hoti hai aur jab neeche jati hai, toh market bearish hoti hai. Yeh indicator long-term trends aur short-term price movements ko analyze karne ke liye kaam aata hai.
                  9. Volume Indicators


                  Price action ke saath volume ka analysis bohot ahem hai. Volume indicators traders ko market ki strength ya weakness ka signal dete hain. Agar kisi trend ke saath high volume hoti hai, toh yeh trend ko strong banati hai, jabke low volume ke saath trend weak hota hai. Volume analysis se traders samajh sakte hain ke market mein kitni participation hai aur koi bhi trend kitna sustainable hai.
                  10. Candlestick Patterns


                  Candlestick patterns market ka price movement dikhate hain ek specific period ke dauran. In patterns ka istemal traders karte hain taake short-term trends aur price reversals ko pehchana ja sake. Har candlestick ka ek body aur shadow hota hai jo open, close, high aur low price ko dikhata hai. Common candlestick patterns jese ke Doji, Hammer, aur Engulfing Patterns traders ko future price movements ka andaza lagane mein madad dete hain.
                  11. Fibonacci Retracement


                  Fibonacci retracement ek popular tool hai jo support aur resistance levels ko identify karta hai. Iska base Fibonacci sequence par hota hai, jisme traders market ka retracement level calculate karte hain. Yeh retracement levels dikhate hain ke ek price move ke baad market kitna retrace kar sakta hai. Popular Fibonacci levels 38.2%, 50%, aur 61.8% hain. Traders in levels ka istemal karte hain taake entry aur exit points ko identify kar sakein.
                  12. Chart Patterns


                  Chart patterns price action ko visual form mein dikhate hain. Yeh patterns dikhate hain ke market mein bullish ya bearish scenario develop ho raha hai. Common chart patterns mein Head and Shoulders, Double Top, Double Bottom, aur Triangles shamil hain. In patterns ka study karna traders ko long-term aur short-term trends ka pata lagane mein madad deta hai. Jab in patterns ka breakout hota hai, toh yeh ek strong trading signal hota hai.
                  13. Risk Management aur Technical Analysis


                  Technical analysis ke zariye risk management bohot ahem hai. Markets unpredictable hoti hain aur sirf analysis par rely karna dangerous ho sakta hai. Is liye, proper risk management techniques jese ke stop-loss aur take-profit levels ka istemal karna zaroori hota hai. Stop-loss orders traders ko heavy losses se bacha sakte hain, jabke take-profit levels ensure karte hain ke traders apna profit timely lock kar lein.
                  Nateeja


                  Technical analysis financial markets ko samajhne ka ek powerful tool hai jo traders aur investors ko informed decisions lene mein madad deta hai. Historical data, price action, aur different indicators ka use karke, yeh analysis market ki direction ko predict kar sakta hai. Magar, risk management aur proper understanding zaroori hai taake yeh tools effectively kaam kar sakein.
                  • #10 Collapse

                    Technical Analysis: Ek Mukammal Jaiza

                    1. Tehqiqat ka Maqsad


                    Technical analysis ek aisa tareeqa hai jisse traders aur investors market ki trends aur price movements ka jaiza lete hain. Is ka maqsad ye samajhna hota hai ke kisi security ki price aage kis tarah se move kar sakti hai.
                    2. Technical Analysis ka Asal


                    Technical analysis ka asal maqsad ye hai ke past price movements aur volume data ka istemal karte hue future price movements ka andaza lagaya jaye. Ye method market psychology ko samajhne mein madadgar hota hai.
                    3. Charting ki Bunyadi Ahamiyat


                    Technical analysis ka aik buniyadi pehlu charts hain. Charts price data ko visualize karte hain, jisse traders ko trends aur patterns samajhne mein asani hoti hai. Aam tor par line charts, bar charts aur candlestick charts istemal kiye jate hain.
                    4. Support aur Resistance Levels


                    Support aur resistance levels aise price points hote hain jahan market ki movement rukne ya reverse hone ki umeed hoti hai. Support wo level hai jahan price girne par rukti hai, jabke resistance wo level hai jahan price barhne par rukti hai.
                    5. Trend Lines ka Istemal


                    Trend lines ko price movements ko visualize karne ke liye istemal kiya jata hai. Ye lines market ke trend ko darshati hain — chahe wo upward, downward ya sideways ho. Trend lines ki madad se traders ko entry aur exit points ka andaza hota hai.
                    6. Indicators aur Oscillators


                    Technical analysis mein indicators aur oscillators ka bhi aham kirdar hai. Ye tools traders ko market ki momentum, volatility aur market ke overbought ya oversold conditions ko samajhne mein madad dete hain. Aam tor par istemal hone wale indicators mein Moving Averages, RSI (Relative Strength Index) aur MACD (Moving Average Convergence Divergence) shamil hain.
                    7. Moving Averages ka Tareeqa


                    Moving averages ek smoothing technique hain jo price data ko analyze karne ke liye istemal hoti hain. Ye past price data ko average karke current price ke sath compare karte hain, jisse traders ko market trend samajhne mein madad milti hai.
                    8. Relative Strength Index (RSI)


                    RSI ek popular momentum indicator hai jo overbought aur oversold conditions ko identify karne mein madadgar hota hai. Iska range 0 se 100 tak hota hai, aur 70 se zyada reading overbought aur 30 se kam reading oversold condition ko darshati hai.
                    9. Moving Average Convergence Divergence (MACD)


                    MACD ek aur powerful indicator hai jo do moving averages ke darmiyan ka farq batata hai. Ye indicator traders ko potential buy ya sell signals dene mein madad karta hai jab moving averages crossover karte hain.
                    10. Chart Patterns ki Ahamiyat


                    Chart patterns, jaise head and shoulders, double tops, aur triangles, price movements ke future direction ko predict karne mein madadgar hote hain. Ye patterns price action ke behavioral psychology ko darshate hain aur traders ko market ke sentiment ka andaza lagane mein madad karte hain.
                    11. Volume ka Role


                    Volume market ki strength aur momentum ka ek aham indicator hai. High volume kisi price move ki confirmation karta hai, jabke low volume price movements ko kamzor banata hai. Volume analysis se traders ko market ke interest ka andaza hota hai.
                    12. Time Frames ka Intikhab


                    Technical analysis karte waqt time frames ka intekhab bhi bohot zaroori hai. Short-term traders usually minute ya hourly charts ka istemal karte hain, jabke long-term investors daily ya weekly charts par focus karte hain. Har time frame ka apna maqsad aur strategy hota hai.
                    13. Risk Management ki Ahamiyat


                    Technical analysis sirf price movements ka andaza lagane ka tareeqa nahi hai, balki risk management bhi is ka ek integral hissa hai. Traders ko hamesha stop-loss orders aur position sizing ka khayal rakhna chahiye taake unka capital mehfooz rahe.
                    14. Technical Analysis ka Future


                    Aakhir mein, technical analysis ka future technology ke sath hai. Algorithmic trading aur machine learning jaise advancements is field ko nai bulandiyon tak le ja rahe hain. Ye traders ko zyada data aur insights provide karte hain, jisse wo behtar trading decisions le sakte hain.
                    Khatam


                    Technical analysis ek valuable tool hai jo traders ko market ki samajh aur analysis mein madad karta hai. Iska sahi istemal karke, traders apne trading strategies ko behtar bana sakte hain aur market se faida utha sakte hain. Har trader ko chahiye ke wo technical analysis ki buniyadi concepts ko samjhe aur unhe apni trading strategies mein shamil kare.
                    • #11 Collapse

                      Technical Analysis Kya Hai?


                      Technical analysis aik aisa tareeqa hai jisse investors aur traders market ke price movements ka jaiza lete hain. Ye analysis, mukhtalif tools aur techniques ka istemal kartay hue, market ki history ko samajhne aur future price movements ka andaza lagane ke liye kiya jata hai. Is ka maqsad yeh hota hai ke log behtar faislay kar saken aur apne investments ko behtar banayen.
                      Technical Analysis Ke Aham Aqsam


                      Technical analysis ki do aham qisam hain: Chart Analysis aur Indicator Analysis. Chart analysis mein traders charts ki madad se price movements ko dekhte hain, jab ke indicator analysis mein mukhtalif indicators ka istemal hota hai jaise Moving Averages, Relative Strength Index (RSI), aur Bollinger Bands. Yeh dono techniques investors ko price trends aur potential reversal points ka andaza lagane mein madad deti hain.
                      Charts Ka Istemal


                      Charts technical analysis ka aik buniyadi hissa hain. Yeh charts price movements ko visualize karte hain aur market trends ko samajhne mein madadgar hote hain. Sab se mashhoor charts mein Line Charts, Bar Charts, aur Candlestick Charts shamil hain.
                      1. Line Charts: Line charts simple hote hain aur sirf closing prices ko dikhate hain. Yeh charts short-term trends ko samajhne ke liye behtareen hain.
                      2. Bar Charts: Bar charts mein opening, closing, high, aur low prices ko dikhaya jata hai. Is se traders ko price fluctuations ka behtar andaza hota hai.
                      3. Candlestick Charts: Yeh charts bhi opening, closing, high, aur low prices dikhate hain, lekin in ka visual representation aur zyada informative hota hai. Candlestick charts traders ko market sentiment ko samajhne mein madad karte hain.
                      Indicators Ka Istemal


                      Indicators technical analysis ka doosra ahem hissa hain. Indicators, statistical tools hote hain jo price movements ka analysis karte hain. Inka istemal trading signals aur price trends ka andaza lagane ke liye hota hai. Sab se mashhoor indicators mein shamil hain:
                      1. Moving Averages (MA): Moving averages price ka average calculate karte hain over a specific period. Simple Moving Average (SMA) aur Exponential Moving Average (EMA) sab se zyada istemal hone wale moving averages hain. Ye trends ko smooth karte hain aur potential reversal points ka pata lagane mein madad dete hain.
                      2. Relative Strength Index (RSI): RSI aik momentum oscillator hai jo price ki strength ko measure karta hai. Yeh 0 se 100 tak ke range mein hota hai. Agar RSI 70 se upar hota hai, to ye overbought condition ko darshata hai, jab ke agar 30 se neeche hota hai, to ye oversold condition ko darshata hai.
                      3. Bollinger Bands: Bollinger Bands price volatility ko measure karte hain. Yeh aik upper band, lower band, aur middle band (SMA) ke form mein hote hain. Jab price upper band ko touch karta hai, to ye overbought condition ko darshata hai, aur jab lower band ko touch karta hai, to ye oversold condition ko darshata hai.
                      Trend Analysis


                      Technical analysis ka aik aur ahem hissa trend analysis hai. Trend analysis mein yeh dekha jata hai ke market ka trend kis taraf hai: bullish (upward trend) ya bearish (downward trend). Trends ka samajhna traders ko market ki direction ka andaza lagane mein madad karta hai. Aam tor par trends ko teen categories mein classify kiya jata hai:
                      1. Uptrend: Jab price consistently higher highs aur higher lows create karti hai, to isay uptrend kehte hain. Traders is trend ka faida uthane ke liye long positions lete hain.
                      2. Downtrend: Jab price consistently lower highs aur lower lows create karti hai, to isay downtrend kehte hain. Is case mein traders short positions lete hain.
                      3. Sideways Trend: Jab price stable rehti hai aur na to upar jati hai aur na neeche, to isay sideways trend kehte hain. Is mein traders ko entry points dhoondna mushkil hota hai.
                      Risk Management


                      Technical analysis ke sath sath risk management bhi bohot zaroori hai. Risk management ka maqsad loss ko minimize karna hai aur trading capital ko protect karna hai. Iske liye kuch strategies shamil hain:
                      1. Stop Loss Orders: Yeh orders aik predetermined price par automatically position ko close karte hain. Is se traders apne losses ko limit kar sakte hain.
                      2. Position Sizing: Position sizing ka matlab hai ke kitni quantity mein trades ki jani chahiye. Is se risk ko manage karne mein madad milti hai.
                      3. Diversification: Investments ko diversify karna risk ko reduce karne ka aik behtareen tareeqa hai. Mukhtalif assets mein invest karke, agar aik asset ka price girta hai, to doosre assets us loss ko compensate kar sakte hain.
                      Technical Analysis Ka Aakhir


                      Technical analysis investors aur traders ko market ki behtar samajh dene ka aik powerful tool hai. Isse market ki price movements ko analyze karke, future trends ka andaza lagana mumkin hota hai. Lekin, ye zaroori hai ke technical analysis ko risk management ke sath mila kar istemal kiya jaye. Aakhir mein, market ka behavior unpredictable hota hai, is liye hamesha khud ko prepare karna aur market ki changes ko monitor karna behtareen strategy hoti hai.

                      Technical analysis ko samajhna aur istemal karna waqt aur practice ka talab karta hai, lekin ek dafa ye skills hasil ho jayein, to yeh investors aur traders ko bohot fayda de sakta hai.
                       
                      • #12 Collapse

                        Technical Analysis: Ek Jaiza


                        1. Technical Analysis Kya Hai?

                        Technical analysis ek tareeqa hai jo bazar ke trend aur price movements ko samajhne ke liye istemal hota hai. Yeh analysis investors aur traders ko madad karta hai taake wo market ki soorat-e-haal ka andaza laga saken. Is mein mukhtalif tools aur techniques istemal hoti hain, jese charts, indicators, aur patterns. Is ka maqsad yeh hai ke kisi asset ki aane wali price movements ka andaza lagaya ja sake.

                        2. Technical Analysis Ke Buniyadi Concepts

                        Technical analysis ki kuch buniyadi concepts hain jo traders aur investors ko samajhni chahiye.
                        • Price Action: Price action ka matlab hai ke kisi asset ki price kis tarah se waqt ke sath badal rahi hai. Yeh analysis price ke historical data par adharit hota hai, jahan price ke highs, lows, aur closing prices ka jaiza liya jata hai.
                        • Support aur Resistance: Support wo level hai jahan price girne par rukti hai, jabke resistance wo level hai jahan price barhne par rukti hai. Yeh levels traders ko price ke movements ka andaza lagane mein madad dete hain.
                        • Trend: Trend market ki general direction hoti hai. Yeh upward (bullish), downward (bearish), ya sideways ho sakti hai. Trend ko samajhna traders ko sahi time par buying ya selling decisions lene mein madad karta hai.

                        3. Charts Ka Istemal

                        Technical analysis mein charts ka istemal bohat ahmiyat rakhta hai. Charts traders ko price movements ko visual tareeqe se samajhne mein madad dete hain. Aam tor par istemal hone wale charts mein:
                        • Line Chart: Yeh sab se aasaan chart hai jo price ko line ki surat mein dikhata hai. Is mein sirf closing prices ko dikhaya jata hai.
                        • Bar Chart: Is chart mein har bar price ke opening, closing, high, aur low ko dikhata hai. Yeh zyada tafseeli information provide karta hai.
                        • Candlestick Chart: Yeh chart bar chart se milta julta hai lekin is mein candle shapes hoti hain jo price ki movement ko asar dikhati hain. Candlestick patterns traders ko market ke mood ka andaza lagane mein madad dete hain.

                        4. Indicators Aur Tools

                        Technical analysis mein mukhtalif indicators aur tools istemal kiye jate hain jo traders ko decision-making mein madad dete hain. Kuch aam indicators mein shamil hain:
                        • Moving Averages: Moving averages price movements ka average dikhate hain aur trend ki direction ko samajhne mein madad karte hain. Simple Moving Average (SMA) aur Exponential Moving Average (EMA) do aam types hain.
                        • Relative Strength Index (RSI): Yeh indicator market ki overbought ya oversold conditions ko dikhata hai. RSI ki value 0 se 100 ke darmiyan hoti hai, jahan 70 se upar ki value overbought aur 30 se neeche ki value oversold condition ko darust karti hai.
                        • Bollinger Bands: Yeh indicator price ke volatility ko dikhata hai. Jab price bands ke andar hoti hai to yeh stability dikhata hai aur jab price bands se bahar nikalti hai to yeh volatility dikhata hai.

                        5. Technical Analysis Ki Ahmiyat

                        Technical analysis ki ahmiyat un logon ke liye bohat zyada hai jo trading aur investment mein serious hain. Is se kuch faide hote hain:
                        • Timing: Technical analysis traders ko sahi waqt par buying ya selling decisions lene mein madad karta hai. Is se traders market ki trend ke mutabiq apni positions ko adjust kar sakte hain.
                        • Risk Management: Is analysis se traders apne risk ko samajhte hain. Yeh unhein stop-loss aur take-profit levels set karne mein madad karta hai.
                        • Market Psychology: Technical analysis market ke mood aur trader ke jazbat ko samajhne mein madad karta hai. Is se traders ko market ki movement ko samajhne ka mauqa milta hai.

                        6. Technical Analysis Ke Limitation

                        Halaanki technical analysis kaafi faida mand hai, lekin is mein kuch limitations bhi hain.
                        • Market Noise: Kabhi kabhi market mein bohat zyada noise hoti hai jo analysis ko mushkil bana deti hai. Is wajah se false signals generate ho sakte hain.
                        • Historical Data Dependence: Technical analysis purani data par adharit hota hai. Yeh zaroori nahi hai ke aane wale trends wahi rahe.
                        • Emotional Bias: Kabhi kabhi traders apne jazbat aur emotions par adharit decisions le lete hain jo analysis ke khilaf hota hai. Yeh unki performance ko affect kar sakta hai.

                        Nateejah

                        Technical analysis ek powerful tool hai jo traders aur investors ko market ki soorat-e-haal samajhne mein madad karta hai. Yeh price movements, trends, aur market psychology ko samajhne ke liye mukhtalif tools aur indicators ka istemal karta hai. Halanki is ki kuch limitations hain, lekin agar sahi tareeqe se istemal kiya jaye, to yeh kisi bhi trading strategy mein bohat madadgar sabit ho sakta hai. Is liye, traders ko chahiye ke wo technical analysis ke buniyadi concepts ko samjhein aur inhe apne trading decisions mein shamil karain.
                         
                        • #13 Collapse

                          1. Introduction: Forex Trading Ki Tareekh
                          Forex trading ka aghaz 1970s mey hua tha jab governments ne apni currencies ke values ko floating exchange rates par convert kiya. Pehle, currencies ke values fixed exchange rates par set kiye gaye the, lekin yeh system unstable orr rigid tha. Iske baad, forex market mey flexible exchange rates ka system aya, jo currencies ke values ko supply orr demand ke hisaab se determine karta hey. Aaj kal, forex trading ek global market hey jahan traders duniya bhar ke currencies ke beech exchange karte hein.

                          Click image for larger version  Name:	44.png Views:	0 Size:	6.5 KB ID:	13184538

                          1.2 Technical Analysis Ka Maqsad

                          Technical analysis ka maqsad market ke past price movements orr volume data ko analyze karke future price trends ko predict karna hota hey. Yeh analysis traders ko market ka mood orr direction samajhne mey madad karta hey, jisse unka trading decisions ko improve karne mey help milti hey. Technical analysis ke zariye traders price charts, indicators, orr patterns ko study karte hein taake unhein market trends orr price movements ka insight mil sake.

                          2. Technical Analysis Kya Hey? 2.1 Basic Tareeqay

                          Technical analysis ka basic tareeqa yeh hey ke traders market ke past price data ko study karte hein taake future price movements ka forecast kar sakein. Is tareeqay mey traders price charts ko analyze karte hein orr patterns ko identify karke unka interpretation karte hein. Is tareeqay mey traders moving averages, support orr resistance levels, orr chart patterns ka istemal karte hein.

                          2.2 Advanced Tools Advanced technical analysis tools traders ko orr bhi detailed insights provide karte hein. Inmey se kuch popular tools hein Fibonacci retracement, Elliott Wave theory, orr Ichimoku Clouds. In tools ka istemal karke traders market ke intricate aspects ko samajhte hein orr accurate predictions karne ki koshish karte hein.

                          3. Candlestick Patterns: 3.1 Bullish Patterns

                          Bullish candlestick patterns market mey uptrend ya price increase ko indicate karte hein. Kuch popula1r bullish patterns hein Hammer, Bullish Engulfing, orr Morning Star. In patterns ko identifykarke traders uptrend ke shuruaati stages mey entry points dhundte hein.

                          3.2 Bearish Patterns

                          Bearish candlestick patterns market mey downtrend ya price decrease ko indicate karte hein. Kuch popular bearish patterns hein Shooting Star, Bearish Engulfing, orr Evening Star. In patterns ko identify karke traders downtrend ke shuruaati stages mey short selling opportunities dhundte hein.

                          4. Moving Averages: 4.1 Simple Moving Average


                          Simple Moving Average (SMA) ek basic trend-following indicator hey jo past prices ka average calculate karta hey. Yeh indicator traders ko trend direction orr reversals ka idea deta hey. Jaise ke agar price SMA ke upar hey, toh yeh uptrend ko indicate karta hey.

                          4.2 Exponential Moving Average

                          Exponential Moving Average (EMA) bhi past prices ka average calculate karta hey lekin ismey recent prices ko zyada weightage diya jata hey. Is wajah se EMA ko fast-moving markets mey zyada reliable mana jata hey. Traders EMA ka istemal trend confirmation orr entry/exit points ke liye karte hein.
                          ko manage karte hein taki unka risk controlled rahe.
                          Last edited by ; 18-10-2024, 08:42 PM.
                          • <a href="https://www.instaforex.org/ru/?x=ruforum">InstaForex</a>
                          • #14 Collapse

                            Technical Analysis: Stock Market Ki Samajhdari Ka Aik Fun

                            Technical analysis aik ahem tareeqa hai jo stock market ke investors aur traders ke liye behtareen tools aur techniques faraham karta hai. Is article mein hum technical analysis ke mukhtalif pehluon ko explore karenge aur samajhne ki koshish karenge ke ye kaise kaam karta hai aur isse kis tarah faida uthaya jaa sakta hai.
                            1. Technical Analysis Kya Hai?


                            Technical analysis wo tareeqa hai jis mein hum stocks, commodities, aur financial instruments ke price aur volume data ka mutala karte hain. Ye analysis historical data ke zariye trends aur patterns ko identify karne ki koshish karta hai jo aane wale dinon mein price movement ka andaza lagane mein madadgar hoti hai. Is tareeqe ka maqsad market ke mood aur sentiments ko samajhna hota hai.
                            2. Basic Tools Aur Indicators


                            Technical analysis mein mukhtalif tools aur indicators ka istemal hota hai. Kuch mehfooz aur mashhoor tools ye hain:
                            • Moving Averages (MA): Moving averages price ke trend ko smooth karti hain aur long-term aur short-term trends ko samajhne mein madad karti hain.
                            • Relative Strength Index (RSI): Ye indicator overbought aur oversold conditions ko identify karta hai.
                            • Bollinger Bands: Price volatility ko measure karne ke liye istimaal hota hai.
                            • Candlestick Patterns: Ye price ke historical patterns ko visually represent karta hai aur market ke trends ko samajhne mein madad karta hai.
                            3. Chart Patterns Aur Trend Lines


                            Chart patterns technical analysis ka dil hoti hain. Ye patterns price ki aane wali direction ka andaza lagane mein madadgar hote hain. Kuch mashhoor chart patterns ye hain:
                            • Head and Shoulders: Trend reversal ka signal deta hai.
                            • Double Top aur Double Bottom: Ye patterns price ke do bar barhne aur girne ko reflect karte hain.
                            • Triangles (Symmetrical, Ascending, Descending): Ye continuation patterns hain jo market ke trends ko confirm karte hain.

                            Trend lines ka istemal karte hue, hum price movement ko ek range mein analyze karte hain jo support aur resistance levels ko define karta hai.
                            4. Timeframes Ka Chunav


                            Technical analysis karte waqt timeframe ka chunav bohot ahem hota hai.
                            • Short-term Traders: Ye log hourly aur daily charts ka istemal karte hain.
                            • Long-term Investors: Weekly aur monthly charts par focus karte hain.

                            Timeframes ka sahih intikhab market ki samajh aur strategy par depend karta hai. Jo log short-term profits ke liye kaam karte hain, unke liye chhoti timeframes zyada useful hoti hain.
                            5. Technical Analysis Ke Fayde Aur Challenges


                            Fayde:
                            • Is se market ke trends aur patterns ko pehle se samajhne ka moka milta hai.
                            • Ye ek structured aur disciplined approach deta hai jo emotions ko kam karta hai.
                            • Risk management mein madad karta hai aur stop-loss levels define karne ke liye helpful hai.

                            Challenges:
                            • Ye guarantee nahi karta ke har analysis sahi hoga.
                            • Technical indicators aur charts ka over-analysis confusion paida kar sakta hai.
                            • Ye approach sirf historical data par depend karta hai jo har waqt future ke trends ko accurately predict nahi kar sakta.
                            6. Technical Analysis Aur Fundamental Analysis Ka Taqabul


                            Fundamental analysis aur technical analysis ka apas mein mukhtalif maqasid aur approaches hain. Fundamental analysis ek company ke financial health, revenue, aur management ko dekhta hai, jabke technical analysis sirf price aur volume data par focus karta hai.
                            Dono approaches ka istimaal mil kar kiya jaye to ek investor ko zyada comprehensive samajh mil sakti hai. For example, aap fundamental analysis ka istemal karke ek strong stock identify kar sakte hain aur phir technical analysis ke zariye uska entry aur exit point samajh sakte hain.
                            Nateeja


                            Technical analysis aik ahem aur powerful tool hai jo stock market mein kaam karne walon ke liye behtareen insights faraham karta hai. Agar isko sahi tareeqe se samajh kar implement kiya jaye, to ye trading aur investing ke liye bohot valuable ho sakta hai. Har investor aur trader ko technical analysis seekhne aur iski basic techniques ka faida uthana chahiye.

                            Har waqt yaad rakhein ke market unpredictable hoti hai, is liye disciplined aur informed decision-making hi successful investing ki kunji hai.

                            اب آن لائن

                            Working...
                            X