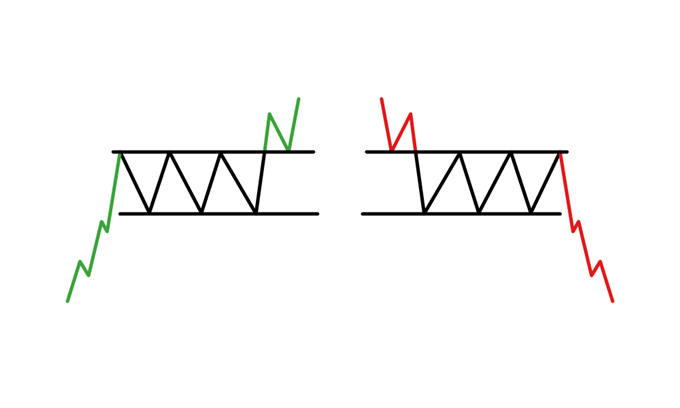
Bullish rectangle pattern ek continuation pattern hota hai jo aksar price ki upward trend mein nazar aata hai. Is pattern mein price ek range ke andar move karta hai, jahan resistance (upar ka level) aur support (neeche ka level) clearly define hotay hain. Jab price is rectangle ke resistance level ko tod kar upar nikalta hai, to yeh bullish breakout samjha jata hai.
Yeh strategy use karte waqt kuch important steps hain jo aapko follow karne chahiye:
1. Pattern Identify Karna
Uptrend: Pattern aksar uptrend ke baad banta hai.
Rectangle Formation: Price do horizontal levels ke beech mein move kare (support aur resistance), aur yeh range stable ho.
Volume Analysis: Volume aksar rectangle ke andar low hota hai aur breakout ke waqt increase hota hai.
2. Breakout Ka Intizaar Karna
Jab price resistance level ko todta hai, tab yeh bullish breakout signal deta hai.
Breakout ke waqt price aksar rapid upward movement dikhata hai
3. Entry Points
Aggressive Entry: Resistance todte hi buy karein. Risk zyada hota hai, lekin profit potential bhi high hota hai.
Conservative Entry: Breakout ke baad price ko wapas support level test karte hue dekhein (retest). Jab price retest ke baad upar jaye, tab enter karein
4. Stop Loss Set Karna
Stop loss rectangle ke neeche wale support level se thoda neeche lagayen.
Agar aap retest ke baad entry le rahe hain, to stop loss ko recent low ke neeche set karein
5. Take Profit Levels
Take profit ka pehla target rectangle ki height ke barabar hota hai.
Formula:
Take Profit = Breakout Price + Rectangle Height
Agar momentum strong ho, to aap multiple targets set kar sakte hain.
6. Volume Analysis
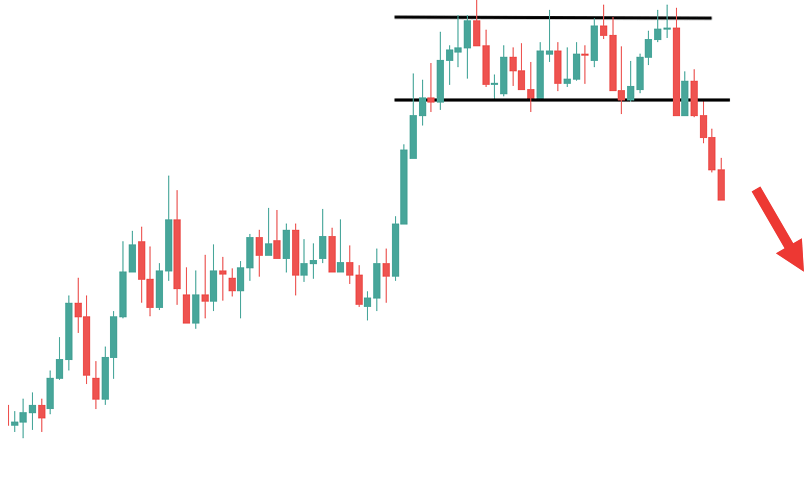
Breakout ke waqt volume ka barhna zaroori hai. Agar volume high na ho, to yeh fake breakout ho sakta hai.
Practical Example:
1. Support Level: $100
2. Resistance Level: $110
3. Rectangle Height: $10
4. Breakout Price: $110
5. Take Profit: $110 + $10 = $120
Risk Management:
Hamesha position size ko apne risk tolerance ke mutabiq rakhein.
Risk/Reward ratio ko 1:2 ya us se behtar rakhna chahiye.
Achi planning aur discipline ke sath, bullish rectangle pattern strategy aapko consistent profits kama kar de sakti hii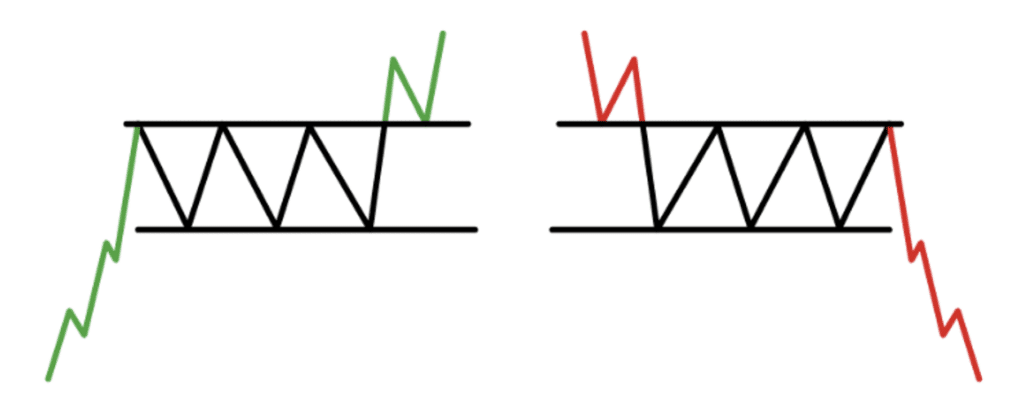
Yeh strategy use karte waqt kuch important steps hain jo aapko follow karne chahiye:
1. Pattern Identify Karna
Uptrend: Pattern aksar uptrend ke baad banta hai.
Rectangle Formation: Price do horizontal levels ke beech mein move kare (support aur resistance), aur yeh range stable ho.
Volume Analysis: Volume aksar rectangle ke andar low hota hai aur breakout ke waqt increase hota hai.
2. Breakout Ka Intizaar Karna
Jab price resistance level ko todta hai, tab yeh bullish breakout signal deta hai.
Breakout ke waqt price aksar rapid upward movement dikhata hai
3. Entry Points
Aggressive Entry: Resistance todte hi buy karein. Risk zyada hota hai, lekin profit potential bhi high hota hai.
Conservative Entry: Breakout ke baad price ko wapas support level test karte hue dekhein (retest). Jab price retest ke baad upar jaye, tab enter karein
4. Stop Loss Set Karna
Stop loss rectangle ke neeche wale support level se thoda neeche lagayen.
Agar aap retest ke baad entry le rahe hain, to stop loss ko recent low ke neeche set karein
5. Take Profit Levels
Take profit ka pehla target rectangle ki height ke barabar hota hai.
Formula:
Take Profit = Breakout Price + Rectangle Height
Agar momentum strong ho, to aap multiple targets set kar sakte hain.
6. Volume Analysis
Breakout ke waqt volume ka barhna zaroori hai. Agar volume high na ho, to yeh fake breakout ho sakta hai.
Practical Example:
1. Support Level: $100
2. Resistance Level: $110
3. Rectangle Height: $10
4. Breakout Price: $110
5. Take Profit: $110 + $10 = $120
Risk Management:
Hamesha position size ko apne risk tolerance ke mutabiq rakhein.
Risk/Reward ratio ko 1:2 ya us se behtar rakhna chahiye.
Achi planning aur discipline ke sath, bullish rectangle pattern strategy aapko consistent profits kama kar de sakti hii


تبصرہ
Расширенный режим Обычный режим