Roll of falling wedge pattern in forex trading 
X
  • وقت
  • دکھائیں
Clear All
new posts
  • #1 Collapse

    Roll of falling wedge pattern in forex trading 
    ROLL OF FALLING WEDGE PATTERN IN FOREX TRADING
    BASIC CONCEPT
    Falling Wedge Pattern ek bullish reversal chart pattern hota hai jo aksar market ke downtrend ke baad form hota hai. Is pattern ka signal hota hai ke market apne niche point par pohanch gaya hai aur ab yeh trend reverse karne ke liye tayar hai.

    Click image for larger version

Name:	images (12).jpeg
Views:	30
Size:	47.8 کلوبائٹ
ID:	13083329

    FORMATION OF FALLING WEDGE PATTERN

    DOWNWARD SLOPPING LINES
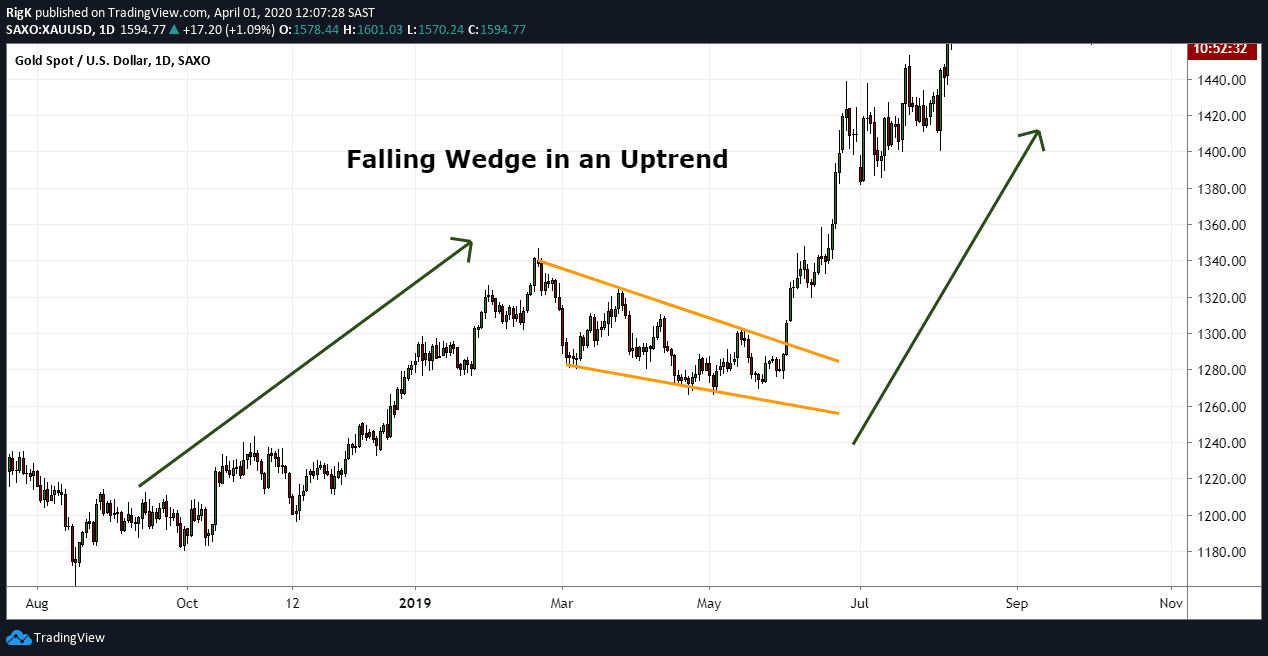
    Yeh pattern do downward sloping lines par mushtamil hota hai, jisme ek line price ke highs ko connect karti hai (resistance) aur doosri line price ke lows ko connect karti hai (support). Yeh lines converge karte hain, yaani aapas mein milne ki taraf badhti hain.

    PRICE COMPREHENSION
    Is pattern mein, price gradually compress hota hai aur niche ki taraf jaane ka momentum slow ho jata hai. Yeh is baat ka indication hota hai ke sellers ki taqat kam ho rahi hai aur buyers market mein interest le rahe hain.

    BREAKOUT
    Jab price upper resistance line ko break karta hai, toh yeh bullish breakout ka signal hota hai. Is point par, market mein buying pressure barhta hai aur price upar jaane lagta hai.

    Click image for larger version

Name:	images (11).jpeg
Views:	22
Size:	54.5 کلوبائٹ
ID:	13083330

    UTILIZATION OF FALLING WEDGE PATTERN

    REVERSAL SIGNAL
    Jab falling wedge pattern form hota hai, toh yeh aksar ek downtrend ke end aur uptrend ke shuru hone ka signal hota hai. Traders is pattern ko identify kar ke apne buy orders place karte hain.

    ENTRY POINT AND STOP LOSS
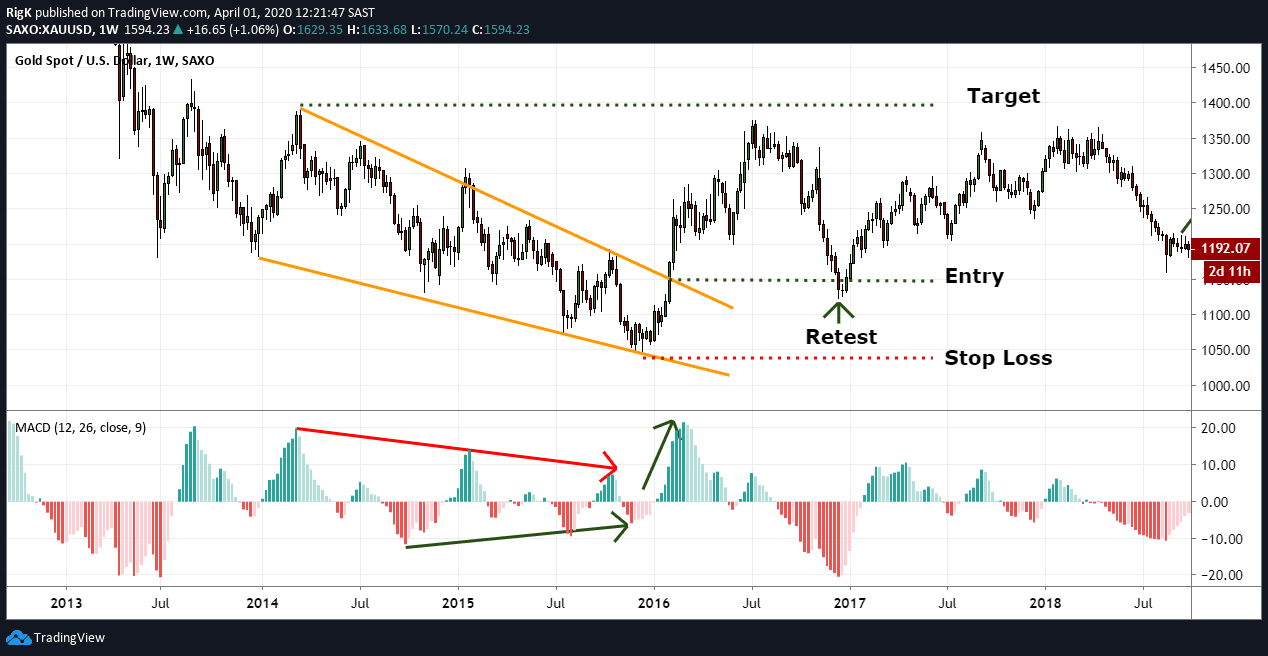
    Upper resistance line ke breakout par entry lena sahi strategy hoti hai. Is point par market mein buying pressure hota hai jo price ko upar le ja sakta hai. Stop loss ko pattern ke lowest point ke neeche place karna chahiye taake risk manage ho sake agar price reverse ho jaye.

    Click image for larger version

Name:	images (12).png
Views:	23
Size:	13.0 کلوبائٹ
ID:	13083331

    TECHNICAL ANALYSIS

    Falling Wedge Pattern forex trading mein aik important bullish reversal pattern hai. Is pattern ka samajhna aur sahi time par entry lena traders ko market ke reversal points pe trade karne mein madad deta hai. Is pattern ka sahi istimaal kar ke traders significant profits hasil kar sakte hain.
  • <a href="https://www.instaforex.org/ru/?x=ruforum">InstaForex</a>
  • #2 Collapse

    Falling Wedge Pattern in Forex Trading.

    Falling Wedge Pattern Kia Hai?

    Falling Wedge pattern aik technical analysis ka tool hai jo price ki downward movement ka signal deti hai. Yeh pattern tab banta hai jab price ka range dheere dheere kam hota hai aur price lower highs aur lower lows banata hai. Is pattern ka shape ek triangle ki tarah hota hai, jo neechay ki taraf squeeze hota hai. Yeh pattern typically reversal pattern hota hai, lekin kabhi kabhi continuation pattern bhi ban sakta hai.

    Formation of Falling Wedge.

    Falling Wedge pattern tab banta hai jab price lower highs aur lower lows banata hai. Is pattern ka upper trendline lower highs ko connect karta hai, jabke lower trendline lower lows ko connect karta hai. Yeh dono trendlines aapas mein converge hoti hain, yani milne ke qareeb hoti hain. Jab yeh pattern complete hota hai, to price usually upper trendline ko break karta hai, jo ke potential bullish reversal ka signal hota hai.

    Click image for larger version

Name:	falling-wedge-pattern_body_FallingwedgeUSDCHFreversalpattternfinal.png
Views:	24
Size:	23.3 کلوبائٹ
ID:	13083386

    Bullish Reversal Signal.

    Falling Wedge pattern aksar bullish reversal ka signal hota hai. Jab price upper trendline ko break karta hai, to yeh indicate karta hai ke selling pressure khatam ho gaya hai aur buyers market mein wapas aa gaye hain. Is waqt traders yeh samajhte hain ke price upward movement karega, aur wo long positions lene ke liye tayar hote hain.

    Entry and Exit Points.

    Falling Wedge pattern me entry point tab hota hai jab price upper trendline ko break kare. Yeh confirmation hota hai ke trend reversal shuru ho gaya hai. Traders is waqt apni position enter karte hain. Stop-loss ko niche wale trendline ke neeche ya recent low ke neeche rakha jata hai, taake risk ko manage kiya ja sake. Target price ko pattern ki height ke barabar upar set kiya jata hai, yani pattern ki starting point se leke lowest point tak ka distance calculate kar ke usse breakout point ke upar add kiya jata hai.

    Risk Management.

    Risk management Forex trading ka ek important hissa hai. Falling Wedge pattern mein bhi risk management zaroori hai. Kyunki market mein hamesha uncertainty hoti hai, isliye stop-loss set karna zaroori hota hai. Yeh trader ko badi loss se bachata hai agar market unke khilaf jaye. Stop-loss ko us jagah set kiya jata hai jahan trade invalid ho jaye, yani agar price us level ko touch kare to pattern fail ho sakta hai.

    Continuation Pattern Ka Signal.

    Kuch cases mein Falling Wedge pattern continuation pattern bhi ban sakta hai. Yani agar yeh pattern downtrend ke dauran ban raha ho aur price lower trendline ko break kare, to yeh signify karta hai ke price aur neeche ja sakta hai. Is case mein, traders short positions lete hain, aur target price ko neeche wale trendline ke neeche set karte hain.
    • #3 Collapse

      1. Falling Wedge Pattern ka Taaruf

      Falling Wedge Pattern forex trading mein aik mashhoor technical pattern hai jo market ke trend reversal ko indicate karta hai. Yeh pattern tab banta hai jab price lower highs aur lower lows banati hai, aur is pattern ki khas baat yeh hai ke pattern ki trendlines diverge hoti hain. Yeh pattern aksar bullish reversal ka signal hota hai, lekin iske accurate analysis aur interpretation se hi traders ko market ka true potential samajh aata hai. Falling Wedge Pattern ko samajhne ke liye, traders ko iske formation aur characteristics ka detailed analysis karna zaroori hai.

      Falling Wedge Pattern ko recognize karne ke liye, pehli cheez jo dekhi jati hai woh hai price action. Price action ke zariye yeh pattern identify hota hai, jahan par market ek downtrend mein hoti hai aur price sequentially lower highs aur lower lows form karti hai. Yeh pattern formation ke doran, price ke movements gradually slow aur convergent hote hain, jo ke pattern ke bullish reversal ka indication dete hain.

      Is pattern ko accurately identify karne ke liye, traders ko pattern ki duration aur convergence angle ko dekhna chahiye. Falling Wedge Pattern ko valid tab mana jata hai jab price consolidation phase ke doran downward slope form karti hai aur iske baad wedge ke upper trendline ko break karti hai. Yeh breakout signal hota hai ke market bullish reversal ke liye tayar hai.

      Falling Wedge Pattern ka analysis karte waqt volume analysis bhi important hota hai. Volume ka pattern pattern ke confirmation ke liye zaroori hai. Agar volume breakout ke waqt spike hota hai, to yeh indicate karta hai ke buying pressure barh gaya hai aur trend reversal ka signal strong hai. Volume spike ke baghair pattern ke breakout ko cautious approach ke saath evaluate karna chahiye, kyunki yeh false breakout bhi ho sakta hai.

      Traders ko Falling Wedge Pattern ke formation ke doran market ke overall trend aur sentiment ko bhi dekhna chahiye. Yeh pattern bullish reversal ka signal dene ke bawajood, agar market overall bearish trend mein ho, to is pattern ki reliability kam ho sakti hai. Isliye, traders ko pattern ke analysis ke sath-sath market ke broader trend aur economic factors ko bhi consider karna chahiye.

      2. Falling Wedge Pattern ki Formation

      Falling Wedge Pattern ki formation ko samajhne ke liye, traders ko pattern ke visual aur technical aspects ko analyze karna padta hai. Yeh pattern typically ek downtrend ke doran banta hai, jahan par price sequentially lower highs aur lower lows banati hai. Pattern ke formation ke dauran, price consolidation phase mein hoti hai aur iske trendlines gradually converge hoti hain.

      Jab Falling Wedge Pattern form hota hai, to price movement ke kuch specific features hote hain jo pattern ko identify karne mein madadgar hote hain. Pehli cheez jo dekhi jati hai woh hai pattern ke lower trendline aur upper trendline ke divergence. Lower trendline price ke lower lows ko connect karti hai aur upper trendline price ke lower highs ko connect karti hai. Yeh trendlines ek wedge shape banati hain jo downward sloping hoti hai.

      Pattern ke formation ke dauran, price action gradually slow hoti hai aur isme volatility bhi kam hoti hai. Yeh feature indicate karta hai ke sellers ka control kam ho raha hai aur buyers market mein wapas aa sakte hain. Is wajah se, Falling Wedge Pattern bullish reversal ka strong signal hota hai. Pattern ke completion ke baad, price wedge ke upper trendline ko break karti hai aur bullish movement start hoti hai.

      Pattern ke duration aur size bhi important hote hain. Agar Falling Wedge Pattern long duration ke liye form hota hai aur pattern ka size significant hota hai, to yeh pattern zyada reliable hota hai. Pattern ke duration ke sath-sath volume analysis bhi zaroori hai, kyunki volume ke spike ke sath pattern ke breakout ki reliability barh jati hai.

      Agar pattern ke formation ke doran market ke technical indicators bhi bullish signals de rahe hon, to yeh pattern ke bullish reversal ka indication aur bhi strong hota hai. Isliye, Falling Wedge Pattern ko analyze karte waqt traders ko technical indicators aur volume ko bhi consider karna chahiye taake accurate trading decisions liye ja sakein.

      3. Technical Indicators ka Role

      Falling Wedge Pattern ko analyze karte waqt technical indicators ka role buhat important hota hai. Yeh indicators traders ko market ke potential movement ko understand karne aur accurate trading decisions lene mein madadgar hote hain. Technical indicators ki madad se traders pattern ke breakout ke waqt aur bhi strong confirmation signals obtain kar sakte hain.

      Relative Strength Index (RSI) ek important indicator hai jo Falling Wedge Pattern ke analysis mein madadgar hota hai. RSI price momentum ko measure karta hai aur market ke overbought ya oversold conditions ko identify karta hai. Agar RSI oversold territory mein ho aur Falling Wedge Pattern form ho raha ho, to yeh bullish reversal ka strong signal hota hai. RSI ke readings market ke sentiment aur trend strength ko bhi reflect karte hain.

      Moving Averages bhi Falling Wedge Pattern ke analysis mein use kiye ja sakte hain. Moving Averages trend direction aur market ke momentum ko analyze karte hain. Agar price moving averages ke upar se move karti hai aur Falling Wedge Pattern ke sath bullish crossover show karti hai, to yeh trend reversal ka strong indication hota hai. Moving Averages ka use pattern ke breakout ke confirmation ke liye bhi kiya jata hai.

      Bollinger Bands bhi technical indicators mein shamil hote hain jo Falling Wedge Pattern ke analysis mein madadgar hote hain. Bollinger Bands price volatility ko measure karte hain aur market ke overbought aur oversold conditions ko indicate karte hain. Agar price Falling Wedge Pattern ke dauran Bollinger Bands ke lower band se touch karti hai aur uske baad upward breakout hota hai, to yeh pattern ke bullish reversal ka confirmation hota hai.

      Fibonacci retracement levels bhi technical indicators hain jo Falling Wedge Pattern ke analysis mein use kiye ja sakte hain. Fibonacci levels market ke natural support aur resistance levels ko indicate karte hain aur pattern ke breakout ke waqt price ke potential target levels ko determine karne mein madadgar hote hain. Agar price Fibonacci retracement levels par support le rahi ho, to yeh bullish reversal ka indication ho sakta hai.

      4. Volume Analysis ka Importance

      Volume analysis Falling Wedge Pattern ke analysis mein buhat important role play karta hai. Volume market ke activity aur trading pressure ko reflect karta hai aur pattern ke confirmation ke liye zaroori hota hai. Jab Falling Wedge Pattern form hota hai, to volume ke changes ko monitor karna traders ko pattern ke accuracy aur potential reversal ko samajhne mein madad karta hai.

      Jab price Falling Wedge Pattern ke formation ke dauran lower highs aur lower lows bana rahi hoti hai, to volume gradually decrease hota hai. Yeh feature indicate karta hai ke sellers ka control kam ho raha hai aur market mein consolidation phase hai. Is period mein volume ka decline trend reversal ke signals ko confirm karta hai.

      Pattern ke breakout ke waqt volume ka spike hona zaroori hota hai. Agar Falling Wedge Pattern ke breakout ke waqt volume mein sudden increase hota hai, to yeh indicate karta hai ke buying pressure barh gaya hai aur trend reversal ka signal strong hai. Volume spike ke saath breakout pattern ke reliability ko enhance karta hai aur traders ko confident trading decisions lene mein madad karta hai.

      Volume analysis ka ek aur important aspect yeh hai ke traders ko false breakouts se bacha ja sake. Agar volume spike nahi hoti aur price pattern ke upper trendline ko break karti hai, to yeh false breakout bhi ho sakta hai. Isliye, traders ko volume ko closely monitor karna chahiye aur confirmation signals ke baghair trade na karni chahiye.

      Volume profile aur volume indicators jaise On-Balance Volume (OBV) bhi Falling Wedge Pattern ke analysis mein madadgar hote hain. OBV price aur volume ke relationship ko analyze karta hai aur trend strength ko measure karta hai. Agar OBV bullish divergence show karta hai aur Falling Wedge Pattern ke sath align karta hai, to yeh pattern ke bullish reversal ko confirm karta hai.

      5. Entry Points Dhoondna

      Falling Wedge Pattern ke analysis ke baad, entry points dhoondna traders ke liye crucial hota hai. Entry points ko accurately identify karna trading success ka key factor hota hai aur pattern ke breakout ke waqt sahi entry points dhoond kar traders apni profitability ko maximize kar sakte hain. Entry points ko determine karne ke liye traders ko pattern ke technical signals aur indicators ka use karna chahiye.

      Sabse pehla entry point tab milta hai jab price Falling Wedge Pattern ke upper trendline ko break karti hai. Yeh breakout signal hota hai ke market mein bullish pressure barh gaya hai aur price upward movement ki taraf move kar rahi hai. Is waqt entry lena profitable ho sakta hai, lekin traders ko volume aur other confirmation signals ka bhi wait karna chahiye. Breakout ke waqt volume spike hone se confirmation milta hai ke trend reversal genuine hai.

      Dusra entry point retracement phase ke doran milta hai. Jab price Falling Wedge Pattern ke breakout ke baad thodi si niche aati hai aur support le leti hai, to yeh retracement phase ke baad entry lena safe hota hai. Yeh entry point higher lows banaane ke baad hota hai aur yeh bullish trend continuation ka signal hota hai. Traders ko retracement phase ko monitor karna chahiye aur support levels ke nazdeek entry leni chahiye.

      Aik aur entry point trendline break ke baad hota hai. Jab price Falling Wedge Pattern ke upper trendline ko break karti hai aur uske baad trendline ke upar consolidation karti hai, to yeh trendline break ke baad entry point hota hai. Is scenario mein price stability aur trend continuation ke signals milte hain, jo ke entry points ko confirm karte hain.

      Traders ko entry points ke sath-sath stop-loss levels ko bhi set karna chahiye. Stop-loss levels pattern ke lower trendline ke neeche rakhe ja sakte hain, taake market ke fluctuations se bacha ja sake. Entry points aur stop-loss levels ka combination traders ko risk management aur profitability ko enhance karne mein madad karta hai.

      6. Target Setting aur Stop-Loss Placement

      Falling Wedge Pattern ke analysis ke baad, target setting aur stop-loss placement buhat important hota hai. Yeh strategies traders ko risk management aur profitability ko effectively manage karne mein madad karti hain. Target setting aur stop-loss placement ko accurately determine karne ke liye traders ko pattern ke technical signals aur market conditions ko analyze karna chahiye.

      Target setting ke liye traders ko pattern ke height aur price movement ke potential ko consider karna chahiye. Falling Wedge Pattern ke height ko calculate karke traders price ke potential target levels determine kar sakte hain. Pattern ke height ko breakout point ke sath add karne se traders ko approximate target levels milte hain jo ke profit-taking ke liye useful hote hain.

      Agar market bullish trend mein hai aur Falling Wedge Pattern ka breakout hota hai, to traders ko long-term targets bhi set karne chahiye. Long-term targets ko determine karte waqt traders ko market ke overall trend aur economic factors ko consider karna chahiye. Target setting ke waqt traders ko realistic aur achievable targets set karne chahiye jo ke market conditions ke sath align karte hain.

      Stop-loss placement bhi crucial hota hai aur risk management ko ensure karta hai. Stop-loss levels ko Falling Wedge Pattern ke lower trendline ke neeche rakha jata hai, taake market ke fluctuations se bacha ja sake. Stop-loss levels ko pattern ke key support levels ke nazdeek bhi rakha ja sakta hai, jo ke risk/reward ratio ko enhance karta hai.

      Target setting aur stop-loss placement ke combination se traders apne risk/reward ratio ko effectively manage kar sakte hain. Yeh approach traders ko trading decisions ko disciplined aur calculated manner mein lene mein madad karti hai. Iske sath-sath, traders ko market ke volatility aur news events ko bhi consider karna chahiye jo ke target setting aur stop-loss placement ko affect kar sakte hain.

      7. Market Conditions ka Asar

      Falling Wedge Pattern ka analysis karte waqt market conditions ka asar bhi buhat important hota hai. Market conditions trading decisions aur pattern ke reliability ko directly influence karti hain. Isliye, traders ko market ke broader conditions aur economic factors ko analyze karna chahiye taake accurate trading decisions liye ja sakein.

      Agar market overall bullish trend mein hai aur Falling Wedge Pattern form ho raha hai, to yeh pattern ke bullish reversal ka indication strong hota hai. Is scenario mein, market ke overall sentiment aur momentum pattern ke bullish signal ko confirm karte hain aur traders ko zyada confident banate hain. Market ke bullish trend ke sath-sath pattern ke breakout ke chances bhi barh jate hain.

      Conversely, agar market overall bearish trend mein hai aur Falling Wedge Pattern form ho raha hai, to is scenario mein pattern ke bullish reversal ka signal kam reliable hota hai. Market ke bearish trend aur negative sentiment pattern ke bullish signal ko counter karte hain, aur traders ko cautious approach adopt karni chahiye. Is scenario mein pattern ke breakout ke baad bhi price movement volatile aur uncertain ho sakti hai.

      Economic news aur macroeconomic factors bhi market conditions ko influence karte hain. Agar positive economic news aa rahi hai aur market bullish trend ko show kar rahi hai, to Falling Wedge Pattern ke breakout ke chances barh jate hain. Economic factors market ke sentiment aur trend ko affect karte hain aur trading decisions ko impact karte hain.

      Traders ko market conditions aur economic news ke saath-sath geopolitical events aur other external factors ko bhi consider karna chahiye. Yeh factors market ke overall trend aur sentiment ko influence karte hain aur pattern ke reliability ko affect karte hain. Market conditions ka detailed analysis traders ko informed aur effective trading decisions lene mein madad karta hai.

      8. Bullish Reversal ke Signs

      Falling Wedge Pattern ke analysis ke waqt bullish reversal ke signs ko identify karna traders ke liye zaroori hota hai. Bullish reversal ke signs pattern ke breakout ke baad market ke upward movement ko indicate karte hain aur traders ko profitable trading opportunities provide karte hain. Yeh signs price action, volume, aur technical indicators ke analysis se identify kiye ja sakte hain.

      Sabse pehla bullish reversal ka sign price ke wedge pattern ke upper trendline ko break karna hai. Jab price Falling Wedge Pattern ke upper trendline ko break karti hai, to yeh signal hota hai ke market mein bullish pressure barh gaya hai aur trend reversal ka possibility strong hai. Is waqt, traders ko bullish positions enter karne ka signal milta hai.

      Dusra bullish reversal ka sign volume spike hota hai. Jab price wedge pattern ke breakout ke waqt volume mein sudden increase hota hai, to yeh indicate karta hai ke buying pressure barh gaya hai aur trend reversal genuine hai. Volume spike pattern ke breakout ke confirmation ke liye zaroori hota hai aur traders ko confident trading decisions lene mein madad karta hai.

      Aik aur sign jo bullish reversal ko confirm karta hai woh hai higher lows ka formation. Jab price Falling Wedge Pattern ke breakout ke baad higher lows banana shuru karti hai, to yeh indicate karta hai ke market mein buying pressure barh raha hai aur bullish trend continue ho sakta hai. Yeh sign traders ko bullish positions ko strengthen karne mein madadgar hota hai.

      Historical price action bhi bullish reversal ke signs ko confirm karne mein madad karta hai. Agar Falling Wedge Pattern past mein successful bullish reversals ka indication de chuki hai, to yeh pattern ke success rate ko enhance karta hai aur traders ko zyada confident banata hai. Historical analysis pattern ke reliability aur accuracy ko confirm karne ke liye useful hoti hai.

      9. Trend Continuation vs. Reversal

      Falling Wedge Pattern ka analysis karte waqt yeh samajhna zaroori hai ke yeh pattern trend continuation aur reversal dono ko indicate kar sakta hai. Trend continuation aur reversal ke signals ko accurately identify karne ke liye traders ko pattern ke formation aur market conditions ko analyze karna padta hai.

      Jab Falling Wedge Pattern existing bullish trend mein form hota hai, to yeh trend continuation ka signal hota hai. Is scenario mein, pattern ke breakout ke baad price further upward movement dikhati hai aur existing bullish trend ko continue karti hai. Trend continuation ka signal tab milta hai jab market mein strong bullish momentum aur price consolidation phase mein hoti hai.

      Agar Falling Wedge Pattern existing bearish trend ke doran form hota hai, to yeh bullish reversal ka signal hota hai. Is scenario mein, pattern ke breakout ke baad price upward movement show karti hai aur market bearish trend se bullish trend mein shift hota hai. Trend reversal ka signal tab milta hai jab price wedge pattern ke breakout ke baad higher highs aur higher lows banana shuru karti hai.

      Moving averages ka alignment bhi trend continuation aur reversal ko confirm karne mein madad karta hai. Agar price Falling Wedge Pattern ke breakout ke baad moving averages ko break karti hai aur moving averages bullish crossover show karti hain, to yeh trend continuation ka strong signal hota hai. Trend reversal ke case mein, moving averages ka alignment bearish se bullish shift ko indicate karta hai.

      Target setting aur stop-loss placement bhi trend continuation aur reversal ko consider karte hain. Trend continuation ke case mein, traders ko long-term targets set karne chahiye aur stop-loss ko trendline ke neeche rakha jana chahiye. Trend reversal ke case mein, targets aur stop-loss levels ko pattern ke key support aur resistance levels ke mutabiq adjust karna chahiye.

      10. Forex Market mein Application

      Falling Wedge Pattern forex market mein currency pairs ke analysis ke liye useful hota hai. Forex market ki high volatility aur liquidity is pattern ko ek valuable tool banati hai jo market ke trend reversal aur continuation signals ko identify karne mein madad karti hai. Forex market mein pattern ka application currency pairs ke analysis aur trading strategy ke liye important hota hai.

      Falling Wedge Pattern ko forex market mein identify karte waqt, traders ko different currency pairs mein pattern ko analyze karna chahiye. High volatility aur liquidity currency pairs, jaise USD/JPY, GBP/USD, aur EUR/USD, mein Falling Wedge Pattern ka application zyada effective hota hai. Yeh currency pairs market ke significant movements aur price action ko reflect karte hain jo pattern ke analysis mein useful hota hai.

      Forex market mein Falling Wedge Pattern ka application ka tareeqa yeh hota hai ke traders ko pattern ko identify karne ke baad apni trading strategy ko adjust karna chahiye. Is pattern ke formation aur breakout ke waqt, traders ko price action, volume analysis, aur technical indicators ka use karna chahiye. Accurate analysis se traders ko entry aur exit points ko effectively determine karne mein madad milti hai.

      Forex market ki dynamic nature ko samajhte hue, traders ko pattern ke analysis ke sath-sath market conditions aur economic factors ko bhi consider karna chahiye. Currency pairs ke movements aur economic news pattern ke reliability aur trading decisions ko impact karte hain. Isliye, traders ko comprehensive analysis aur disciplined trading approach adopt karni chahiye.

      11. Risk Management Strategies

      Falling Wedge Pattern ko trading decisions mein shamil karte waqt effective risk management strategies ko adopt karna zaroori hota hai. Risk management traders ko potential losses se bachne aur trading capital ko protect karne mein madad karti hai. Is pattern ke trading ke waqt risk management ke key aspects ko consider karna chahiye.

      Sabse pehla risk management strategy stop-loss placement hai. Stop-loss levels ko Falling Wedge Pattern ke lower trendline ke neeche rakha jana chahiye, taake market ke fluctuations se bacha ja sake. Stop-loss levels ko accurately determine karne se traders apne risk exposure ko minimize kar sakte hain aur potential losses ko control kar sakte hain.

      Position sizing bhi risk management ka ek important aspect hai. Traders ko apni position size ko trading capital aur risk tolerance ke mutabiq adjust karna chahiye. Position sizing se traders apne trading risk ko effectively manage kar sakte hain aur large losses se bach sakte hain. Position sizing ka formula risk per trade aur account equity ke basis par hota hai.

      Risk/reward ratio bhi risk management strategies mein shamil hota hai. Risk/reward ratio ko calculate karte waqt traders ko potential profit aur potential loss ko compare karna chahiye. Achievable risk/reward ratio se traders apne trading decisions ko disciplined aur calculated manner mein le sakte hain. Higher risk/reward ratio se trading opportunities ko evaluate karna beneficial hota hai.

      Trailing stops bhi risk management strategies mein use kiye ja sakte hain. Trailing stops price ke movement ke sath adjust hote hain aur profits ko lock karne mein madad karte hain. Agar price Falling Wedge Pattern ke breakout ke baad upward movement show karti hai, to trailing stops se traders apne profits ko protect kar sakte hain aur losses ko minimize kar sakte hain.

      12. Confluence with Other Patterns

      Falling Wedge Pattern ka confluence with other patterns aur indicators trading decisions ko enhance kar sakta hai. Multiple patterns aur signals ka convergence market ke trend reversal aur continuation signals ko strengthen karta hai. Traders ko confluence ko consider karte hue apni trading strategy ko robust aur reliable banana chahiye.

      Agar Falling Wedge Pattern ke sath-sath other bullish patterns, jaise Cup and Handle ya Double Bottom Pattern, form ho rahe hain, to yeh pattern ke bullish reversal ko confirm karne mein madadgar hota hai. Multiple bullish patterns ka convergence market ke trend reversal ke signals ko strong karta hai aur trading opportunities ko enhance karta hai.

      Technical indicators ka bhi confluence pattern ke analysis mein important role hota hai. Agar Falling Wedge Pattern ke sath RSI, Moving Averages, aur Bollinger Bands bhi bullish signals de rahe hain, to yeh confluence pattern ke accuracy aur reliability ko increase karta hai. Indicators ka alignment market ke sentiment aur trend strength ko confirm karta hai.

      Volume analysis ka confluence bhi pattern ke reliability ko validate karta hai. Agar Falling Wedge Pattern ke breakout ke waqt volume spike ke sath other volume indicators bhi bullish signals de rahe hain, to yeh pattern ke bullish reversal ko confirm karta hai aur traders ko reliable trading signals provide karta hai.

      Aakhir mein, confluence ko dekh kar traders ko trading decisions ko disciplined aur reliable banana chahiye. Multiple indicators aur signals ka convergence market mein trend reversal ya continuation ka strong indication hota hai, jo ke trading strategy ko enhance karta hai aur risk management ko improve karta hai.

      13. Psychological Impact

      Falling Wedge Pattern ka analysis karte waqt psychological impact bhi buhat important hota hai. Market participants ke emotions aur sentiments trading decisions ko direct influence karte hain, aur is pattern ka formation bhi psychological factors ko reflect karta hai. Falling Wedge Pattern aksar market ke pessimism aur uncertainty ko represent karta hai, lekin is pattern ke breakout ke baad, market mein optimism aur positive sentiment dekhne ko milta hai.

      Jab market Falling Wedge Pattern form karta hai, to yeh pattern seller's ke control ko indicate karta hai lekin price ke stable hone ki wajah se buyers ke entry ka signal bhi hota hai. Is stage par, traders market ke bearish sentiment ko dekhte hain lekin agar pattern ke breakout ke baad price upward movement show karti hai, to yeh sentiment shift ko indicate karta hai aur market ke psychology ko positive direction mein le jata hai.

      Traders ko is pattern ke psychological impact ko samajhne ke liye market ke overall sentiment ko bhi analyze karna chahiye. Agar market ka overall sentiment bearish hai aur Falling Wedge Pattern form ho raha hai, to yeh indicate karta hai ke bearish trend apni akhirat par hai aur market bullish reversal ke liye tayar hai. Is sentiment shift ko identify karne se traders ko apni trading strategy ko adjust karne mein madad milti hai.

      Aksar, Falling Wedge Pattern ke breakout ke waqt market mein excitement aur euphoria dekhne ko milta hai. Yeh psychological impact traders ko overconfident bana sakta hai, jo ke trading decisions ko affect kar sakta hai. Isliye, traders ko market ke psychological aspects ko samajhte hue apni trading strategy ko disciplined aur risk-managed rakhna chahiye.

      Aik aur psychological factor jo Falling Wedge Pattern ko affect karta hai woh hai market ka reaction news events aur economic announcements par. Agar market kisi economic announcement ke baad Falling Wedge Pattern ko react karta hai, to yeh pattern ke bullish reversal ya continuation ko affect kar sakta hai. Traders ko market ke psychological aspects aur news events ke impact ko analyze karna chahiye taake effective trading decisions liye ja sakein.

      14. Case Studies aur Historical Examples

      Falling Wedge Pattern ke case studies aur historical examples traders ko pattern ke effectiveness aur reliability ko samajhne mein madad karte hain. Historical examples se traders ko pattern ke real-world applications aur successful trading strategies ko dekhne ka mauka milta hai. Case studies market ke actual scenarios aur outcomes ko illustrate karte hain aur pattern ke analysis ko enhance karte hain.

      Ek historical example ka analysis US Dollar aur Japanese Yen (USD/JPY) currency pair par Falling Wedge Pattern ka study hai. Is pair ke analysis se pata chalta hai ke Falling Wedge Pattern ke formation ke baad price mein significant bullish reversal aayi aur market ne upward movement show ki. Yeh example pattern ke accuracy aur effectiveness ko validate karta hai.

      Ek aur case study ka analysis Euro aur US Dollar (EUR/USD) currency pair par Falling Wedge Pattern ka study hai. Is pair ke analysis se yeh dekha gaya ke Falling Wedge Pattern ke breakout ke baad price ne higher highs aur higher lows form kiye, jo ke bullish trend continuation ka indication tha. Yeh case study pattern ke successful application aur trading strategy ko illustrate karta hai.

      Historical examples ke zariye traders ko pattern ke different market conditions aur scenarios ke under performance ko analyze karna chahiye. Pattern ke effectiveness ko different economic environments aur news events ke saath evaluate karna zaroori hota hai. Yeh approach traders ko pattern ke real-world applications aur potential outcomes ko samajhne mein madad karti hai.

      Case studies aur historical examples traders ko Falling Wedge Pattern ke strengths aur limitations ko samajhne mein madad karte hain. Traders ko pattern ke analysis ke sath-sath real-world examples aur scenarios ko bhi consider karna chahiye taake comprehensive aur informed trading decisions liye ja sakein.
      • #4 Collapse

        1. Introduction to the Falling Wedge Pattern


        Falling wedge pattern aik technical analysis pattern hai jo market ke price charts par nazar aata hai aur iska use trend reversal aur bullish opportunities ko identify karne ke liye hota hai. Yeh pattern downward sloping trendlines ke combination se banata hai, jahan price gradually lower highs aur lower lows create karti hai. Is pattern ki pehchaan karna aur iska sahi time par use karna traders ke liye bohot faida mand hota hai.

        Falling wedge pattern typically tab form hota hai jab market ek downward trend mein hoti hai. Yeh pattern ek narrow range create karta hai jahan price squeeze hoti hai aur volatility kam hoti hai. Jab yeh pattern complete hota hai, to iska breakout bullish trend ki taraf hota hai, jo ke market ke reversal ka signal hota hai. Is pattern ko samajhna aur market ke context mein analyze karna zaroori hota hai.

        Is pattern ko identify karne ke liye, traders ko price chart par focus karna padta hai. Jab price lower highs aur lower lows create karti hai aur trendlines ke beech squeeze hoti hai, to falling wedge pattern ban jata hai. Yeh pattern generally long-term trends ke reversal points ko indicate karta hai aur market mein significant movement ke potential ko highlight karta hai.

        Falling wedge pattern ko analyze karte waqt, traders ko volume analysis aur other technical indicators ko bhi consider karna chahiye. Volume ka increase pattern ke breakout ke waqt confirmatory signal hota hai aur isse pattern ki validity ko strengthen kiya ja sakta hai. Is pattern ka use strategic trading decisions ko guide karne ke liye kiya jata hai, jo ke overall trading strategy ko enhance karta hai.

        In short, falling wedge pattern ek important tool hai jo traders ko market ke reversal points ko identify karne mein madad karta hai. Yeh pattern market ke potential bullish trend ko highlight karta hai aur traders ko profitable trading opportunities ke liye guide karta hai. Is pattern ko samajhna aur effectively use karna trading success ke liye critical hota hai.
        2. Characteristics of Falling Wedge Pattern


        Falling wedge pattern ki characteristics ko samajhna traders ke liye zaroori hai taake wo pattern ko accurately identify kar saken aur effective trading decisions le saken. Yeh pattern downward sloping trendlines ke saath form hota hai aur iski distinct characteristics hote hain jo isse identify karne mein madadgar hote hain.

        Pehli characteristic yeh hai ke falling wedge pattern downward sloping trendlines ke saath form hota hai. Is pattern ki formation ke dauran, price lower highs aur lower lows create karti hai, jo ke trendlines ke beech squeeze hoti hai. Yeh pattern ek narrowing range ko indicate karta hai jahan price gradually compress hoti hai.

        Doosri characteristic yeh hai ke falling wedge pattern generally ek bullish reversal signal hota hai. Jab pattern complete hota hai aur price trendlines ko break karti hai, to yeh bullish move ka indication hota hai. Is pattern ka breakout market ke upward trend ki taraf hota hai, jo ke buying opportunities ko signal karta hai.

        Teesri characteristic yeh hai ke falling wedge pattern ka volume analysis bhi important hota hai. Pattern ke formation ke dauran, volume gradually decrease hota hai aur breakout ke waqt volume ka increase pattern ke validity ko confirm karta hai. Yeh volume analysis pattern ke success rate ko enhance karta hai aur traders ko accurate trading signals provide karta hai.

        Chouthi characteristic yeh hai ke falling wedge pattern ko long-term trends ke reversal points ko identify karne ke liye use kiya jata hai. Yeh pattern generally market ke long-term downward trend ke baad form hota hai aur bullish trend ke potential ko highlight karta hai. Is pattern ka use strategic trading decisions aur risk management ke liye kiya jata hai.

        Paanchvi characteristic yeh hai ke falling wedge pattern ke breakout ke baad market mein significant upward movement dekhne ko milti hai. Pattern ka breakout ek strong bullish signal hota hai aur traders ko buying opportunities ke liye guide karta hai. Is pattern ka accurate identification aur confirmation trading success ke liye critical hota hai.
        3. How to Identify a Falling Wedge Pattern


        Falling wedge pattern ko identify karna traders ke liye ek crucial skill hai jo accurate trading decisions aur successful trades ke liye zaroori hai. Yeh pattern price charts par nazar aata hai aur iska identification technical analysis tools aur techniques ke through kiya jata hai.

        Pehla step hai price chart par trendlines draw karna. Falling wedge pattern ko identify karne ke liye, traders ko price chart par downward sloping trendlines draw karni hoti hain. Yeh trendlines price ke lower highs aur lower lows ko connect karti hain aur pattern ke narrowing range ko indicate karti hain.

        Doosra step hai pattern ke formation duration ko analyze karna. Falling wedge pattern generally ek prolonged duration ke dauran form hota hai. Traders ko pattern ke formation ke duration ko observe karna chahiye taake pattern ke validity ko assess kiya ja sake. Longer duration patterns zyada reliable hote hain aur bullish reversal ke strong signals provide karte hain.

        Teesra step hai volume analysis. Volume pattern ke formation aur breakout ke waqt significant role play karta hai. Traders ko volume ko observe karna chahiye aur ensure karna chahiye ke volume gradually decrease ho raha hai aur breakout ke waqt volume ka increase ho raha hai. Yeh volume analysis pattern ke success rate ko enhance karta hai aur accurate trading signals provide karta hai.

        Choutha step hai other technical indicators ka use. Falling wedge pattern ko confirm karne ke liye traders ko other technical indicators jaise moving averages, RSI, aur MACD ka use karna chahiye. In indicators ka use pattern ke confirmation aur potential breakout ke signals ko validate karne ke liye kiya jata hai.

        Paanchwa step hai risk management. Falling wedge pattern ko identify karne ke baad, traders ko risk management strategies ko implement karna chahiye. Isme stop loss aur take profit levels define karna aur trade size ko manage karna shamil hai. Risk management strategies traders ko market ke fluctuations se protect karti hain aur profits ko maximize karti hain.
        4. Trading Strategies Using the Falling Wedge Pattern


        Falling wedge pattern ke saath trading strategies ko effectively use karna traders ko profitable trading opportunities ke liye guide karta hai. Yeh strategies pattern ke formation, confirmation, aur breakout ke baad apply ki jati hain aur trading success ko enhance karti hain.

        Pehli strategy hai breakout trading. Jab falling wedge pattern complete hota hai aur price trendlines ko break karti hai, to yeh bullish breakout signal hota hai. Traders is breakout ke baad buying position open kar sakte hain aur price ke upward move se fayda utha sakte hain. Breakout trading mein, traders ko confirmation signals aur volume analysis ka use karna chahiye.

        Doosri strategy hai trend-following approach. Falling wedge pattern generally long-term downward trend ke baad form hota hai aur bullish reversal ka signal hota hai. Traders is pattern ke breakout ke baad market ke upward trend ko follow kar sakte hain. Trend-following approach mein, traders ko pattern ke breakout ke baad market ke trend ko monitor karna aur trading positions ko adjust karna zaroori hota hai.

        Teesri strategy hai risk management aur stop loss placement. Falling wedge pattern ke breakout ke waqt, traders ko stop loss levels define karna chahiye taake market ke fluctuations se protect kiya ja sake. Stop loss placement traders ko unexpected market movements se bachata hai aur profits ko secure karta hai. Risk management strategies ko effectively implement karna zaroori hota hai.

        Chouthi strategy hai take profit targets. Falling wedge pattern ke breakout ke baad, traders ko realistic take profit targets define karne chahiye. Yeh targets pattern ke height aur market ke overall trend ke mutabiq define kiye ja sakte hain. Take profit targets traders ko profits ko maximize karne aur market ke fluctuations se bachane mein madad karte hain.

        Paanchvi strategy hai pattern ke consolidation phase ko analyze karna. Falling wedge pattern ke breakout ke baad, market consolidation phase mein bhi ja sakti hai. Traders ko pattern ke breakout ke baad market ke consolidation phase ko monitor karna chahiye aur trading decisions ko adjust karna chahiye. Yeh analysis traders ko accurate trading decisions lene mein madad karta hai.
        5. Risk Management in Falling Wedge Trades


        Falling wedge trades mein effective risk management strategies ka implementation traders ko market ke fluctuations se protect karta hai aur profits ko secure karta hai. Yeh strategies trading decisions ko guide karti hain aur trading success ko enhance karti hain.

        Pehli risk management strategy hai stop loss placement. Falling wedge pattern ke breakout ke waqt, traders ko stop loss levels define karna chahiye taake market ke unexpected movements se protect kiya ja sake. Stop loss placement traders ko losses ko limit karne aur trading capital ko protect karne mein madad karta hai.

        Doosri strategy hai trade size management. Falling wedge trades mein, traders ko trade size ko appropriately manage karna chahiye. Trade size ko risk tolerance aur account size ke mutabiq adjust karna zaroori hota hai. Risk management strategies trade size ko optimize karti hain aur trading capital ko safeguard karti hain.

        Teesri strategy hai position sizing. Falling wedge pattern ke breakout ke baad, traders ko position sizing strategies ko implement karna chahiye. Yeh strategies market ke volatility aur trend strength ke mutabiq position sizes ko adjust karti hain. Position sizing traders ko market ke fluctuations se protect karti hai aur profitable trades ko secure karti hai.

        Chouthi strategy hai profit-taking approach. Falling wedge pattern ke breakout ke baad, traders ko realistic take profit targets define karne chahiye. Yeh targets market ke trend aur pattern ke height ke mutabiq define kiye ja sakte hain. Profit-taking approach traders ko profits ko maximize karne aur market ke fluctuations se bachane mein madad karti hai.

        Paanchvi strategy hai trade review aur analysis. Falling wedge trades ke baad, traders ko trade review aur analysis karna chahiye taake trading strategies aur risk management practices ko evaluate kiya ja sake. Trade review traders ko past trades se learn karne aur future trades ke liye improve karne mein madad karta hai.
        6. Falling Wedge vs. Rising Wedge


        Falling wedge aur rising wedge patterns dono hi technical analysis ke important tools hain, lekin inke characteristics aur implications market ke trends ko alag alag signal karte hain. In dono patterns ka comparison traders ko market ke movement ko accurately analyze karne mein madad karta hai.

        Falling wedge pattern generally bullish reversal signal hota hai aur market ke downward trend ke baad form hota hai. Yeh pattern downward sloping trendlines ke combination se banta hai aur price gradually lower highs aur lower lows create karti hai. Is pattern ka breakout upward trend ki taraf hota hai, jo ke buying opportunities ko indicate karta hai.

        Rising wedge pattern uske opposite hota hai. Yeh pattern upward sloping trendlines ke combination se banta hai aur price gradually higher highs aur higher lows create karti hai. Rising wedge generally bullish trend ke dauran form hota hai aur iske breakout ke baad market mein downward reversal hota hai, jo ke selling opportunities ko indicate karta hai.

        Dono patterns ko identify karte waqt volume analysis important hota hai. Falling wedge pattern ke dauran volume decrease hota hai aur breakout ke waqt volume ka increase pattern ke validity ko confirm karta hai. Rising wedge pattern ke dauran bhi volume analysis ka role important hota hai aur pattern ke breakout ke waqt volume ka decrease bearish signal hota hai.

        Falling wedge aur rising wedge patterns ko use karte waqt, traders ko market ke overall trend aur context ko consider karna chahiye. Falling wedge pattern bullish reversal ko indicate karta hai jabke rising wedge bearish reversal ko indicate karta hai. In patterns ko market ke broader perspective ke saath analyze karna zaroori hota hai taake accurate trading decisions liye ja sakein.

        In short, falling wedge aur rising wedge patterns dono hi market ke different signals aur trading opportunities ko indicate karte hain. In patterns ko samajhna aur effectively use karna traders ke liye crucial hai aur trading success ko enhance karta hai.
        7. Falling Wedge Pattern in Different Time Frames


        Falling wedge pattern ko different time frames mein analyze karna traders ko market ke trends aur potential trading opportunities ko identify karne mein madad karta hai. Time frames ka selection pattern ke validity aur accuracy ko influence karta hai aur trading decisions ko guide karta hai.

        Short-term time frames mein falling wedge pattern generally chhote price movements aur quick trading opportunities ko indicate karta hai. Yeh patterns intraday charts aur shorter duration charts par form hota hai aur quick trades aur scalping strategies ke liye use kiya jata hai. Short-term time frames mein pattern ke accuracy ko validate karne ke liye volume analysis aur other technical indicators ka use kiya jata hai.

        Medium-term time frames mein falling wedge pattern long-term trends ke reversal points ko indicate karta hai. Yeh patterns daily charts aur weekly charts par form hota hai aur medium-term trading strategies ke liye use kiya jata hai. Medium-term time frames mein pattern ke confirmation aur accuracy ko validate karne ke liye broader market trends aur technical indicators ka use kiya jata hai.

        Long-term time frames mein falling wedge pattern significant market movements aur major trend reversals ko indicate karta hai. Yeh patterns monthly charts aur quarterly charts par form hota hai aur long-term trading strategies aur investments ke liye use kiya jata hai. Long-term time frames mein pattern ke accuracy ko validate karne ke liye historical data aur macroeconomic factors ko consider kiya jata hai.

        Time frames ke selection ka impact pattern ke validity aur trading decisions par hota hai. Short-term time frames mein pattern ki accuracy aur quick trading opportunities ko consider kiya jata hai jabke long-term time frames mein major trend reversals aur significant market movements ko analyze kiya jata hai. Time frames ke selection aur analysis se trading strategies aur risk management practices ko optimize kiya jata hai.

        In short, falling wedge pattern ko different time frames mein analyze karna trading decisions aur market trends ko accurately identify karne mein madad karta hai. Time frames ka selection pattern ke validity aur trading strategies ko influence karta hai aur successful trading ke liye critical hota hai.
        8. Common Mistakes in Identifying Falling Wedge Patterns


        Falling wedge pattern ko identify karte waqt kuch common mistakes hoti hain jo traders ke analysis ko affect kar sakti hain aur trading decisions ko galat direction mein le ja sakti hain. In mistakes ko samajhna aur avoid karna traders ke liye zaroori hai taake accurate trading signals aur profitable trades liye ja sakein.

        Pehla mistake hai trendlines ka incorrect drawing. Falling wedge pattern ko identify karne ke liye trendlines ka accurate drawing zaroori hota hai. Agar trendlines correctly draw nahi ki jati, to pattern ki identification inaccurate hoti hai aur trading decisions galat ho sakte hain. Trendlines ko accurately draw karne ke liye price highs aur lows ko carefully analyze karna chahiye.

        Doosra mistake hai pattern ke formation duration ko ignore karna. Falling wedge pattern generally prolonged duration ke dauran form hota hai. Agar pattern ke formation duration ko ignore kiya jaye, to pattern ke validity aur accuracy ko assess nahi kiya ja sakta. Pattern ke formation duration ko observe karna aur analyze karna zaroori hota hai.

        Teesra mistake hai volume analysis ko overlook karna. Volume pattern ke formation aur breakout ke waqt significant role play karta hai. Agar volume analysis ko ignore kiya jaye, to pattern ke confirmation aur validity ko assess nahi kiya ja sakta. Volume ko observe karna aur ensure karna zaroori hota hai ke volume pattern ke formation ke dauran decrease ho raha hai aur breakout ke waqt increase ho raha hai.

        Choutha mistake hai other technical indicators ka inappropriate use. Falling wedge pattern ko confirm karne ke liye other technical indicators ka use zaroori hota hai. Agar technical indicators ka inappropriate use kiya jaye, to pattern ke signals aur confirmation inaccurate ho sakte hain. Technical indicators ko accurately use karna aur pattern ke signals ke saath align karna zaroori hota hai.

        Paanchwa mistake hai risk management strategies ka neglect karna. Falling wedge pattern ke breakout ke baad, effective risk management strategies ka implementation zaroori hota hai. Agar risk management strategies ko neglect kiya jaye, to market ke fluctuations se protect nahi kiya ja sakta aur profits ko secure nahi kiya ja sakta. Risk management strategies ko implement karna aur trading decisions ko manage karna zaroori hota hai.
        9. Case Studies of Falling Wedge Patterns


        Falling wedge patterns ka analysis aur case studies traders ko real-world examples aur market scenarios ko samajhne mein madad karte hain. In case studies ke through traders ko pattern ke practical application aur trading strategies ko understand karne ka mauka milta hai.

        Pehli case study ek stock market scenario par based hai jahan ek falling wedge pattern form hota hai. Is case study mein, stock price ek downward trend ke dauran lower highs aur lower lows create karti hai. Pattern complete hota hai aur price trendlines ko break karti hai, jo ke bullish breakout signal hota hai. Traders is breakout ke baad buying positions open karte hain aur price ke upward move se fayda uthaate hain.

        Doosri case study forex market mein falling wedge pattern ke application par based hai. Is case study mein, forex pair ek prolonged downward trend ke dauran falling wedge pattern form karta hai. Pattern ke breakout ke baad, forex pair mein significant upward movement dekhne ko milti hai aur traders is movement se profitable trades execute karte hain. Volume analysis aur other technical indicators pattern ke confirmation ko validate karte hain.

        Teesri case study commodities market mein falling wedge pattern ke application ko showcase karti hai. Is case study mein, commodity price ek downward trend ke dauran falling wedge pattern form karti hai. Pattern ke breakout ke baad, commodity price mein bullish trend develop hota hai aur traders is trend ko follow karte hain. Risk management strategies aur profit-taking targets pattern ke effective use ko ensure karte hain.

        Chouthi case study cryptocurrency market mein falling wedge pattern ke application ko analyze karti hai. Is case study mein, cryptocurrency price ek bearish trend ke dauran falling wedge pattern form karti hai. Pattern ke breakout ke baad, cryptocurrency price mein upward movement dekhne ko milti hai aur traders is movement ko capitalize karte hain. Volume analysis aur technical indicators pattern ke signals ko confirm karte hain.

        Paanchvi case study ek mixed market scenario par based hai jahan multiple asset classes mein falling wedge pattern observe kiya jata hai. Is case study mein, different asset classes mein pattern ke formation, breakout, aur trading strategies ko analyze kiya jata hai. In case studies ke through traders ko pattern ke real-world application aur trading strategies ko understand karne ka mauka milta hai.
        10. Falling Wedge Pattern in Combination with Other Indicators


        Falling wedge pattern ko other technical indicators ke saath combine karke traders market ke signals ko accurately analyze kar sakte hain aur trading decisions ko optimize kar sakte hain. In indicators ka combination pattern ke confirmation aur trading strategies ko enhance karta hai.

        Pehla indicator hai Moving Averages. Moving averages trend direction aur strength ko identify karne mein madad karte hain. Falling wedge pattern ke saath moving averages ka combination traders ko pattern ke signals ko confirm karne aur trend direction ko accurately analyze karne mein madad karta hai. Moving averages ke crossover points pattern ke breakout signals ko validate karte hain.

        Doosra indicator hai Relative Strength Index (RSI). RSI overbought aur oversold conditions ko identify karta hai. Falling wedge pattern ke saath RSI ka combination traders ko market ke momentum aur trend strength ko analyze karne mein madad karta hai. RSI ke extreme values pattern ke signals ko confirm karte hain aur trading decisions ko optimize karte hain.

        Teesra indicator hai MACD (Moving Average Convergence Divergence). MACD trend changes aur momentum ko identify karta hai. Falling wedge pattern ke saath MACD ka combination traders ko pattern ke breakout points aur trend reversals ko accurately analyze karne mein madad karta hai. MACD ke signal lines aur histogram pattern ke signals ko confirm karte hain.

        Choutha indicator hai Bollinger Bands. Bollinger Bands price volatility aur trend strength ko analyze karte hain. Falling wedge pattern ke saath Bollinger Bands ka combination traders ko pattern ke breakout aur volatility ko accurately analyze karne mein madad karta hai. Bollinger Bands ke squeeze aur expansion patterns pattern ke signals ko confirm karte hain.

        Paanchwa indicator hai Volume. Volume pattern ke formation aur breakout ke waqt significant role play karta hai. Falling wedge pattern ke saath volume analysis traders ko pattern ke validity aur confirmation ko assess karne mein madad karta hai. Volume ke increase breakout ke waqt pattern ke signals ko validate karte hain.

        In indicators ka combination traders ko falling wedge pattern ke signals ko accurately analyze karne aur effective trading decisions lene mein madad karta hai. Indicators ka combination trading strategies ko enhance karta hai aur market ke trends aur signals ko accurately identify karne mein help karta hai.
        11. Psychological Aspects of Trading Falling Wedge Patterns


        Falling wedge pattern ko trade karte waqt psychological aspects bhi important role play karte hain. Traders ke emotions aur mental state trading decisions aur performance ko influence karte hain. In psychological aspects ko samajhna aur manage karna trading success ke liye zaroori hota hai.

        Pehla aspect hai fear of missing out (FOMO). FOMO traders ko impulsive decisions lene aur market ke trends ko quickly follow karne par majboor karta hai. Falling wedge pattern ko trade karte waqt FOMO ko control karna zaroori hota hai taake accurate trading decisions liye ja sakein aur risk management strategies ko implement kiya ja sake.

        Doosra aspect hai confirmation bias. Confirmation bias traders ko apne existing beliefs aur expectations ko confirm karne ke liye patterns aur signals ko interpret karne par majboor karta hai. Falling wedge pattern ko trade karte waqt confirmation bias ko avoid karna zaroori hota hai taake objective aur accurate analysis kiya ja sake.

        Teesra aspect hai overconfidence. Overconfidence traders ko apne abilities aur knowledge ko excessively overestimate karne par majboor karta hai. Falling wedge pattern ko trade karte waqt overconfidence ko manage karna zaroori hota hai taake realistic expectations aur risk management practices ko maintain kiya ja sake.

        Choutha aspect hai emotional decision-making. Emotional decision-making traders ko market ke movements aur patterns ke saath impulsive decisions lene par majboor karta hai. Falling wedge pattern ko trade karte waqt emotional decision-making ko control karna zaroori hota hai taake rational aur objective trading decisions liye ja sakein.

        Paanchwa aspect hai stress aur anxiety. Stress aur anxiety trading performance aur decision-making ko negatively affect karte hain. Falling wedge pattern ko trade karte waqt stress aur anxiety ko manage karna zaroori hota hai taake trading decisions ko optimize kiya ja sake aur trading performance ko enhance kiya ja sake.

        In psychological aspects ko samajhna aur effectively manage karna traders ke liye critical hai aur trading success ko achieve karne mein madad karta hai. Traders ko apne psychological state ko monitor karna aur trading decisions ko rational aur objective basis par lena chahiye.
        12. Falling Wedge Pattern in Different Market Conditions


        Falling wedge pattern ko different market conditions mein analyze karna traders ko market ke behavior aur trading opportunities ko accurately identify karne mein madad karta hai. Market conditions ka impact pattern ke validity aur trading strategies par hota hai.

        Pehli condition hai trending markets. Trending markets mein falling wedge pattern generally bullish reversal signal hota hai. Uptrend ke dauran falling wedge pattern ke formation aur breakout bullish trend ke continuation ko indicate karte hain. Traders ko pattern ke breakout ke baad buying positions open karne aur trend ko follow karne ka strategy adopt karna chahiye.

        Doosri condition hai ranging markets. Ranging markets mein falling wedge pattern ke formation aur breakout trend reversal aur trading range ke boundaries ko indicate karte hain. Traders ko pattern ke breakout ke baad trading range ke boundaries ko consider karna aur trading decisions ko optimize karna chahiye.

        Teesri condition hai volatile markets. Volatile markets mein falling wedge pattern ke formation aur breakout high volatility aur price fluctuations ko indicate karte hain. Traders ko pattern ke breakout ke baad volatility ko manage karne aur risk management strategies ko implement karne ka strategy adopt karna chahiye.

        Chouthi condition hai news-driven markets. News-driven markets mein falling wedge pattern ke formation aur breakout market news aur events ke impact ko reflect karte hain. Traders ko pattern ke breakout ke baad news aur events ke impact ko consider karna aur trading decisions ko adjust karna chahiye.

        Paanchvi condition hai economic conditions. Economic conditions falling wedge pattern ke formation aur breakout ko influence karte hain. Traders ko pattern ke breakout ke baad economic conditions ko analyze karna aur trading strategies ko optimize karna chahiye.

        In market conditions ko consider karna aur analyze karna falling wedge pattern ke effective use aur trading strategies ko enhance karta hai. Traders ko market conditions ke mutabiq trading decisions aur risk management practices ko adjust karna chahiye.
        13. Long-Term vs. Short-Term Trading Strategies with Falling Wedge


        Falling wedge pattern ko long-term aur short-term trading strategies ke liye analyze karna traders ko market ke signals aur trading opportunities ko accurately identify karne mein madad karta hai. Long-term aur short-term trading strategies ke selection pattern ke use aur effectiveness ko influence karte hain.

        Pehli strategy hai long-term trading. Long-term trading mein falling wedge pattern ko major trend reversals aur significant market movements ke liye use kiya jata hai. Pattern ke formation aur breakout ke baad long-term positions open ki jati hain aur market ke broader trends ko follow kiya jata hai. Long-term trading strategies ko risk management aur profit-taking targets ke saath optimize kiya jata hai.

        Doosri strategy hai short-term trading. Short-term trading mein falling wedge pattern ko quick trading opportunities aur intraday movements ke liye use kiya jata hai. Pattern ke formation aur breakout ke baad short-term positions open ki jati hain aur quick profits capture kiye jate hain. Short-term trading strategies ko volume analysis aur other technical indicators ke saath enhance kiya jata hai.

        Teesri strategy hai swing trading. Swing trading mein falling wedge pattern ko short-to-medium-term price movements aur trend reversals ke liye use kiya jata hai. Pattern ke formation aur breakout ke baad swing positions open ki jati hain aur market ke intermediate trends ko follow kiya jata hai. Swing trading strategies ko risk management aur profit-taking targets ke saath optimize kiya jata hai.

        Chouthi strategy hai scalping. Scalping mein falling wedge pattern ko very short-term price movements aur quick trades ke liye use kiya jata hai. Pattern ke formation aur breakout ke baad very short-term positions open ki jati hain aur quick profits capture kiye jate hain. Scalping strategies ko volume analysis aur technical indicators ke saath enhance kiya jata hai.

        Paanchvi strategy hai position trading. Position trading mein falling wedge pattern ko major trend movements aur long-term investments ke liye use kiya jata hai. Pattern ke formation aur breakout ke baad position trades open ki jati hain aur market ke long-term trends ko follow kiya jata hai. Position trading strategies ko economic conditions aur broader market trends ke saath optimize kiya jata hai.

        In strategies ka selection aur implementation traders ke liye critical hota hai aur falling wedge pattern ke effective use aur trading success ko influence karta hai. Traders ko apne trading style aur market conditions ke mutabiq strategies ko optimize karna chahiye.
        • #5 Collapse

          Roll of Falling Wedge Pattern in Forex Trading

          1. Taaruf

          Falling wedge pattern forex trading mein aik ahem technical analysis tool hai jo traders ko market trends aur price movements ka analysis karne mein madad karta hai. Yeh pattern generally aik established bearish trend ke dauran develop hota hai aur iske completion ke baad upward reversal ka signal deta hai. Yeh pattern investors aur traders ko precise entry aur exit points identify karne mein madad karta hai, jo ultimately unke trading decisions ko improve kar sakta hai.

          Falling wedge pattern ki pehchaan ke liye, traders ko price chart ka ghor se analysis karna hota hai. Yeh pattern tab develop hota hai jab price progressively lower highs aur lower lows banati hai aur yeh movements do converging trendlines ke andar confined hote hain. Is pattern ka analysis karke traders ko pata chalta hai ke market kis direction mein move kar sakti hai aur isse unhe trading strategy develop karne mein madad milti hai.

          Falling wedge pattern ka ek key feature yeh hai ke iske formation ke dauran market ki volatility decrease hoti hai. Yeh decreasing volatility indicate karti hai ke market consolidation phase mein hai aur soon ek significant move ke liye prepare ho rahi hai. Is pattern ko identify karna forex trading mein critical hai kyunki yeh future price movements ko accurately predict karne mein madadgar hota hai.

          Falling wedge pattern ko samajhne ke liye, traders ko iske formation aur behavior ko detail mein study karna hota hai. Yeh pattern generally ek long-term downtrend ke baad develop hota hai aur iska completion ke baad bullish trend ka signal milta hai. Isliye, falling wedge pattern ko correctly identify karna aur interpret karna trading success ke liye zaroori hai.

          Is pattern ki trading strategy ko effectively implement karne ke liye, traders ko market conditions aur price action ko closely monitor karna hota hai. Falling wedge pattern ko samajhne aur iski trading signals ko accurately interpret karne se traders ko market ke trend reversal points ko identify karne mein madad milti hai aur isse unki trading performance bhi improve hoti hai.

          2. Falling Wedge Pattern Kya Hai?

          Falling wedge pattern aik technical analysis pattern hai jo bearish trend ke dauran develop hota hai. Yeh pattern two converging trendlines ke sath hota hai: aik upper trendline jo higher highs ko connect karti hai aur aik lower trendline jo higher lows ko connect karti hai. Yeh pattern market ki price action ko show karta hai aur iske completion ke baad upward breakout ka indication deta hai.

          Falling wedge pattern ko samajhne ke liye, traders ko iski formation ko closely observe karna hota hai. Pattern ke andar price progressively lower highs aur lower lows banati hai, jo market ke consolidation aur decreasing volatility ko indicate karti hai. Yeh pattern generally ek established downtrend ke baad develop hota hai aur iski completion ke baad bullish trend ka signal milta hai.

          Is pattern ki formation ke dauran, price movements contraction aur decreasing volatility ko show karti hain. Jab yeh pattern complete hota hai, to price aik breakout ke sath upward direction mein move karti hai. Yeh breakout market ke sentiment aur trend reversal ka clear signal hota hai aur traders ko long positions open karne ka opportunity provide karta hai.

          Falling wedge pattern ka formation typically ek downtrend ke end par hota hai. Is pattern ke end par price wedge ke upper trendline ko breakout karti hai aur upward movement start hoti hai. Yeh pattern traders ko market ke trend reversal points identify karne mein madad karta hai aur isse unhe profitable trading opportunities milti hain.

          Falling wedge pattern ko identify karne ke liye, traders ko price chart aur trendlines ko accurately draw karna hota hai. Yeh pattern generally long-term downtrend ke dauran develop hota hai aur iske completion ke baad market mein significant upward movement dekhne ko milti hai. Isliye, is pattern ko sahi tarah se identify karna aur interpret karna zaroori hai.

          3. Pattern Ki Pehchan

          Falling wedge pattern ko pehchan na ke liye, traders ko kuch key characteristics ko dhyan mein rakhna hota hai. Jab aap observe karte hain ke price progressively lower highs aur lower lows bana rahi hai aur yeh movements do converging trendlines ke andar confined hain, to yeh falling wedge pattern ban raha hota hai. Yeh pattern market ke price action aur trend reversal signals ko indicate karta hai.

          Is pattern ki pehchan ke liye, traders ko price chart ko detail mein analyze karna hota hai. Falling wedge pattern ki formation ke dauran price progressively lower highs aur lower lows create karti hai, aur yeh movements aik narrowing range ke andar hoti hain. Yeh pattern generally ek established downtrend ke baad develop hota hai aur iski completion ke baad bullish trend ka signal milta hai.

          Falling wedge pattern ko accurately identify karne ke liye, traders ko trendlines ko draw karna hota hai jo higher highs aur higher lows ko connect karti hain. Is pattern ka key feature yeh hai ke upper aur lower trendlines converging hoti hain aur price gradually contract hoti hai. Jab price wedge ke upper trendline ko breakout karti hai, to yeh bullish signal hota hai aur traders ko long positions open karne ka opportunity milta hai.

          Pattern ki pehchan ke liye volume analysis bhi zaroori hai. Falling wedge pattern ke dauran volume gradually decrease hota hai, aur breakout ke waqt volume spike hota hai. Yeh volume confirmation pattern ki validity ko enhance karta hai aur traders ko signal deta hai ke pattern complete ho chuka hai.

          Falling wedge pattern ko identify karte waqt, traders ko market conditions aur price action ko closely monitor karna hota hai. Is pattern ko accurately identify karne se traders ko market ke trend reversal points ko pinpoint karne mein madad milti hai aur isse unki trading decisions ko improve kiya ja sakta hai.

          4. Pattern Ki Shakal

          Falling wedge pattern ki shakal aik narrowing triangle jaisi hoti hai jo downtrend ke dauran develop hoti hai. Yeh pattern generally do converging trendlines ke sath hota hai: aik upper trendline jo higher highs ko connect karti hai aur aik lower trendline jo higher lows ko connect karti hai. Pattern ke andar price movements contraction aur decreasing volatility ko show karti hain.

          Falling wedge pattern ki shakal ka analysis karke traders ko market ke price action aur trend reversal signals ko samajhna hota hai. Pattern ke formation ke dauran price progressively lower highs aur lower lows create karti hai, aur yeh movements aik narrowing range ke andar hoti hain. Yeh pattern market ke consolidation phase ko indicate karti hai aur future mein aik significant move ke liye prepare hoti hai.

          Pattern ki shakal ko samajhne ke liye, traders ko price chart aur trendlines ko accurately draw karna hota hai. Falling wedge pattern ke formation ke dauran price gradually contract hoti hai aur trendlines ke andar confined hoti hai. Pattern ke completion ke baad, price wedge ke upper trendline ko breakout karti hai aur upward direction mein move karti hai.

          Is pattern ki shakal ka analysis traders ko market ke trend reversal points ko identify karne mein madad karta hai. Falling wedge pattern generally ek long-term downtrend ke baad develop hota hai aur iske completion ke baad bullish trend ka signal milta hai. Traders ko pattern ke completion ke baad upward movement ka potential assess karna hota hai.

          Pattern ki shakal ko accurately identify karne se traders ko market ke trend reversal aur breakout points ko pinpoint karne mein madad milti hai. Is pattern ko effectively use karne ke liye, traders ko market conditions aur price action ko closely monitor karna hota hai aur iske signals ko accurately interpret karna hota hai.

          5. Trend Reversal Signal

          Falling wedge pattern ka ek key feature yeh hai ke yeh trend reversal signal provide karta hai. Jab yeh pattern complete hota hai, to market mein bullish trend ka indication hota hai. Yeh pattern generally ek bearish trend ke end par develop hota hai aur iske completion ke baad price upward direction mein move karti hai.

          Falling wedge pattern ka trend reversal signal market ke price action aur trendlines ke convergence se generate hota hai. Pattern ke formation ke dauran price progressively lower highs aur lower lows banati hai, aur yeh movements aik narrowing range ke andar confined hoti hain. Is pattern ki completion ke baad, price wedge ke upper trendline ko breakout karti hai aur bullish trend start hota hai.

          Trend reversal signal ko accurately identify karne ke liye, traders ko pattern ke formation aur completion ke signals ko closely monitor karna hota hai. Falling wedge pattern ke dauran market ki volatility decrease hoti hai aur yeh contraction phase ko show karti hai. Jab price wedge ke upper trendline ko breakout karti hai, to yeh trend reversal signal hota hai aur traders ko long positions open karne ka opportunity milta hai.

          Trend reversal signal ka accurate interpretation traders ko market ke future price movements ko predict karne mein madad karta hai. Falling wedge pattern ke completion ke baad price ka upward movement bullish trend ko indicate karta hai aur traders ko profitable trading opportunities milti hain. Isliye, trend reversal signals ko accurately identify karna trading strategy ke liye zaroori hai.

          Traders ko trend reversal signals ko confirm karne ke liye additional technical indicators ka use karna chahiye. Indicators jaise ke Relative Strength Index (RSI), Moving Averages, aur MACD pattern ke signals ko confirm karne mein madadgar hote hain. Yeh indicators trend reversal signals ko enhance karte hain aur traders ko better trading decisions lene mein madad karte hain.

          6. Pattern Ka Formation

          Falling wedge pattern ka formation typically ek long-term downtrend ke baad hota hai. Is pattern ka formation price ke progressively lower highs aur lower lows ke sath hota hai, aur yeh movements do converging trendlines ke andar confined hoti hain. Pattern ke formation ke dauran market ki volatility decrease hoti hai aur price gradually contract hoti hai.

          Pattern ke formation ke dauran price aik narrowing range ke andar hoti hai aur yeh contraction phase ko indicate karti hai. Jab yeh pattern complete hota hai, to price wedge ke upper trendline ko breakout karti hai aur upward movement start hoti hai. Yeh pattern market ke trend reversal points ko identify karne mein madad karta hai aur traders ko profitable trading opportunities milti hain.

          Falling wedge pattern ka formation ke dauran, traders ko trendlines ko accurately draw karna hota hai jo higher highs aur higher lows ko connect karti hain. Is pattern ke formation ke dauran price gradually contract hoti hai aur trendlines ke andar confined hoti hai. Pattern ke completion ke baad, price aik breakout ke sath upward direction mein move karti hai.

          Pattern ka formation market ke sentiment aur price action ke analysis se bhi related hota hai. Falling wedge pattern generally ek established downtrend ke baad develop hota hai aur iske completion ke baad bullish trend ka signal milta hai. Traders ko pattern ke formation aur completion ke signals ko closely monitor karna hota hai aur isse unki trading decisions ko improve karna hota hai.

          Falling wedge pattern ka formation traders ko market ke trend reversal aur breakout points ko accurately identify karne mein madad karta hai. Is pattern ko effectively use karne ke liye, traders ko market conditions aur price action ko closely observe karna hota hai aur iske signals ko accurately interpret karna hota hai.

          7. Entry Points

          Falling wedge pattern ka entry point pattern ke completion ke baad hota hai. Jab price wedge ke upper trendline ko breakout karti hai, to yeh bullish signal hota hai aur traders ko long positions open karne ka opportunity milta hai. Entry point ko accurately identify karne ke liye, traders ko pattern ke signals aur market conditions ko closely monitor karna hota hai.

          Entry point ko confirm karne ke liye, traders ko volume analysis bhi consider karna chahiye. Pattern ke dauran volume gradually decrease hota hai, aur breakout ke waqt volume spike hota hai. Yeh volume confirmation pattern ki validity ko enhance karta hai aur traders ko signal deta hai ke pattern complete ho chuka hai.

          Entry points ko accurately identify karne ke liye, traders ko additional technical indicators ka use karna chahiye. Indicators jaise ke Relative Strength Index (RSI), Moving Averages, aur MACD pattern ke signals ko confirm karne mein madadgar hote hain. Yeh indicators entry points ko enhance karte hain aur traders ko better trading decisions lene mein madad karte hain.

          Falling wedge pattern ke entry points ko identify karte waqt, traders ko market conditions aur price action ko closely monitor karna hota hai. Pattern ke completion ke baad, price ka upward movement bullish trend ko indicate karta hai aur traders ko long positions open karne ka opportunity milta hai. Isliye, entry points ko accurately identify karna aur implement karna zaroori hai.

          Entry points ko set karne ke baad, traders ko stop loss aur target setting ko bhi consider karna chahiye. Stop loss ko pattern ke lower trendline ke niche set karna chahiye, aur target price ko pattern ke height ke barabar set karna chahiye. Yeh risk management aur profit booking strategy ko enhance karta hai.

          8. Stop Loss Aur Target Setting

          Falling wedge pattern mein stop loss aur target setting trading strategy ke important elements hain. Stop loss ko pattern ke lower trendline ke niche set karna chahiye, jo unexpected price movements se protection provide karta hai. Target price ko pattern ke height ke barabar set kiya jata hai, jo pattern ke starting point se measured hota hai.

          Stop loss setting ka purpose yeh hai ke trader ko market ke unexpected price movements se protection milti hai. Stop loss ko accurately set karne ke liye, traders ko pattern ke formation aur price action ko closely monitor karna hota hai. Isse traders ko loss ko minimize karne aur trading strategy ko protect karne mein madad milti hai.

          Target price setting ka purpose yeh hai ke trader ko potential profit booking points identify karne mein madad milti hai. Target price ko pattern ke height ke barabar set kiya jata hai, jo pattern ke starting point se measured hota hai. Isse traders ko potential profit aur risk-reward ratio ko assess karne mein madad milti hai.

          Stop loss aur target setting ko accurately implement karne ke liye, traders ko market conditions aur price action ko closely observe karna hota hai. Isse traders ko trading strategy ko effectively manage karne aur risk management ko enhance karne mein madad milti hai. Stop loss aur target setting trading success ke liye zaroori elements hain.

          Stop loss aur target setting ke sath, traders ko trailing stop loss ka bhi use karna chahiye. Trailing stop loss price ke movement ke sath adjust hota hai aur potential profit ko protect karne mein madad karta hai. Isse traders ko market ke fluctuations se effectively deal karne aur profit booking strategy ko enhance karne mein madad milti hai.

          9. Volume Analysis

          Falling wedge pattern ke dauran volume analysis bhi important hota hai. Pattern ke formation ke dauran volume gradually decrease hota hai, aur breakout ke waqt volume spike hota hai. Yeh volume confirmation pattern ki validity ko enhance karta hai aur traders ko signal deta hai ke pattern complete ho chuka hai.

          Volume analysis ka purpose yeh hai ke traders ko pattern ke signals aur validity ko confirm karne mein madad milti hai. Falling wedge pattern ke dauran decreasing volume market ke consolidation phase ko indicate karta hai, aur breakout ke waqt volume spike market ke sentiment aur trend reversal ko confirm karta hai.

          Volume analysis ko accurately interpret karne ke liye, traders ko price chart aur volume indicators ko closely monitor karna hota hai. Isse traders ko pattern ke completion aur market ke trend reversal points ko identify karne mein madad milti hai. Volume analysis trading strategy ko strengthen karne aur market ke trends ko accurately predict karne mein madadgar hota hai.

          Volume analysis ke sath, traders ko additional technical indicators ka bhi use karna chahiye. Indicators jaise ke Relative Strength Index (RSI), Moving Averages, aur MACD volume analysis ke signals ko confirm karne mein madadgar hote hain. Yeh indicators market ke trend reversal aur price movements ko accurately predict karne mein madad karte hain.

          Volume analysis ka use karke traders ko pattern ke signals aur validity ko confirm karna chahiye. Isse traders ko trading decisions ko improve karne aur market ke trend reversal points ko accurately identify karne mein madad milti hai. Volume analysis trading strategy ke important elements mein se ek hai.

          10. False Breakouts

          False breakouts bhi falling wedge pattern mein hoti hain. Kabhi kabar price temporarily pattern ke upper trendline ko breakout karti hai, lekin phir se niche aa jati hai. Isliye, confirmation ke liye volume aur additional technical indicators ka use zaroori hai.

          False breakouts market ke volatility aur price fluctuations ke indicators hote hain. Jab price temporary breakout karti hai aur phir se niche aa jati hai, to yeh false breakout ka signal hota hai. False breakouts ko identify karne ke liye, traders ko volume analysis aur additional indicators ka use karna hota hai.

          False breakouts se bachne ke liye, traders ko pattern ke signals ko closely monitor karna chahiye. Confirmation ke liye volume aur technical indicators ka use karke traders ko accurate trading decisions lene mein madad milti hai. Isse traders ko market ke fluctuations se effectively deal karne aur false breakouts se bachne mein madad milti hai.

          Traders ko false breakouts ke signal ko ignore nahi karna chahiye. Market ke volatility aur price fluctuations ko samajhne ke liye, traders ko additional technical indicators aur volume analysis ka use karna chahiye. Yeh indicators traders ko accurate trading decisions lene aur market ke trends ko effectively predict karne mein madad karte hain.

          False breakouts ko accurately identify karne ke liye, traders ko market conditions aur price action ko closely observe karna hota hai. Isse traders ko trading strategy ko effectively implement karne aur market ke trend reversal points ko pinpoint karne mein madad milti hai.

          11. Combination With Other Indicators

          Falling wedge pattern ko other technical indicators ke sath combine karna trading strategy ko strengthen karta hai. Indicators jaise ke Relative Strength Index (RSI), Moving Averages, aur MACD pattern ke signal ko confirm karne mein madadgar hote hain. Yeh indicators traders ko market ke trend reversal aur price movements ko accurately predict karne mein madad karte hain.

          RSI aur Moving Averages pattern ke signals ko confirm karne mein madadgar hote hain. RSI market ke overbought aur oversold conditions ko indicate karta hai, jabke Moving Averages market ke trend direction aur strength ko show karti hain. Yeh indicators falling wedge pattern ke signals ko confirm karne aur trading decisions ko improve karne mein madad karte hain.

          MACD bhi falling wedge pattern ke signals ko confirm karne mein madadgar hota hai. MACD trend reversal aur momentum shifts ko indicate karta hai aur isse traders ko market ke trends aur price movements ko accurately predict karne mein madad milti hai. MACD pattern ke breakout aur entry points ko confirm karne mein madad karta hai.

          Combination with other indicators ka use karke traders ko accurate trading decisions lene aur market ke trends ko effectively predict karne mein madad milti hai. Indicators ka use trading strategy ko enhance karta hai aur traders ko better risk management aur profit booking points identify karne mein madad karta hai.

          Indicators ka use karte waqt, traders ko market conditions aur price action ko closely monitor karna hota hai. Isse traders ko pattern ke signals aur additional indicators ke signals ko effectively combine karne aur trading strategy ko improve karne mein madad milti hai.

          12. Practice And Experience

          Falling wedge pattern ka effective use practice aur experience se hota hai. Traders ko pattern ke formation, entry points, aur stop loss aur target setting ko practice karna chahiye. Practice se traders ko pattern ke signals ko accurately interpret karne aur trading decisions ko improve karne mein madad milti hai.

          Experience ke sath traders ko market ke fluctuations aur price action ko samajhne mein madad milti hai. Traders ko pattern ke signals ko accurately identify karna aur trading strategy ko implement karna aata hai. Experience trading decisions ko improve karne aur market ke trends ko accurately predict karne mein madad karta hai.

          Traders ko practice aur experience se falling wedge pattern ke formation aur trading strategy ko effectively use karna chahiye. Isse traders ko pattern ke signals aur market ke trends ko accurately identify karne aur trading strategy ko enhance karne mein madad milti hai. Practice aur experience trading success ke liye zaroori hain.

          Traders ko practice ke sath market conditions aur price action ko closely monitor karna chahiye. Isse traders ko pattern ke signals aur market ke trends ko effectively analyze karne aur trading decisions ko improve karne mein madad milti hai. Practice aur experience se trading strategy ko effectively implement kiya ja sakta hai.

          13. Conclusion

          Falling wedge pattern forex trading mein ek important technical analysis tool hai. Is pattern ka formation trend reversal aur bullish market conditions ko indicate karta hai. Pattern ke formation, entry points, stop loss aur target setting, volume analysis, aur false breakouts ko accurately identify karna zaroori hai.

          Falling wedge pattern ko other technical indicators ke sath combine karke trading strategy ko strengthen kiya ja sakta hai. Indicators jaise ke RSI, Moving Averages, aur MACD pattern ke signals ko confirm karne mein madadgar hote hain. Combination with other indicators trading decisions ko improve karne aur market ke trends ko accurately predict karne mein madad karta hai.

          Practice aur experience se traders ko falling wedge pattern ke signals ko accurately identify karne aur trading strategy ko effectively implement karne mein madad milti hai. Traders ko market conditions aur price action ko closely monitor karna chahiye aur pattern ke signals aur additional indicators ke signals ko combine karna chahiye.

          Falling wedge pattern forex trading mein ek valuable tool hai jo traders ko market ke trend reversal aur bullish conditions ko identify karne mein madad karta hai. Is pattern ko effectively use karne ke liye, traders ko practice, experience, aur technical analysis tools ka use karna chahiye.
          • #6 Collapse

            Falling Wedge Pattern in Forex Trading

            1. Wedge Pattern Ka Ta'aruf


            Falling wedge pattern ek technical analysis ka tool hai jo traders ko market ki bullish reversal ki nishandahi karne mein madad deta hai. Ye pattern do converging trend lines par mabni hota hai, jahan upper trend line downward slope par hoti hai aur lower trend line zyada steep downward slope par hoti hai.
            2. Falling Wedge Ki Pehchaan


            Is pattern ki pehchaan karne ke liye, aapko do trend lines draw karni hoti hain. Upper trend line high points ko join karti hai jabke lower trend line low points ko join karti hai. Jab ye do lines converge hoti hain, to iska matlab hai ke market mein volatility ka asar hai.
            3. Market Ki Tasveer


            Falling wedge pattern aksar bearish market mein banta hai, jahan prices dheere dheere niche ki taraf jati hain. Is dauran, trading volume aksar decrease hota hai, jo is baat ki nishani hai ke market mein participants ka interest kam ho raha hai.
            4. Bullish Reversal Ki Nishandahi


            Falling wedge pattern ki khasiyat ye hai ke ye aksar bullish reversal ki nishandahi karta hai. Jab price lower trend line ko test karte hue bounce hoti hai, to ye is baat ki nishani hoti hai ke buyers market mein wapas aa rahe hain.
            5. Entry Points Ka Ta'ayyun


            Traders is pattern ko dekhte hue entry points identify karte hain. Entry point tab hota hai jab price upper trend line ko cross karti hai. Is waqt trading volume mein izafa hota hai, jo is trade ki strength ko darust karta hai.
            6. Stop-Loss Ka Istamal


            Har trading strategy mein risk management bahut zaroori hai. Falling wedge pattern ke liye stop-loss level lower trend line ke thoda niche rakha jata hai. Is se trader ko unnecessary losses se bachne ka mauqa milta hai agar market unke khilaaf chale.
            7. Profit Target Ka Ta'yun


            Profit target set karna bhi ek zaroori step hai. Aam tor par traders apne profit target ko pattern ke height ke barabar rakhte hain. Iska matlab hai ke agar price falling wedge se breakout karti hai, to aap us height ke barabar profit expect kar sakte hain.
            8. Volume Ka Role


            Volume ka analysis is pattern ke liye bohot important hai. Jab price upper trend line ko cross karti hai, to trading volume mein izafa hona chahiye. Ye is baat ka saboot hai ke market mein bullish sentiment hai aur traders is move ko support kar rahe hain.
            9. Market Sentiment Ki Samajh


            Falling wedge pattern ko dekhte waqt market sentiment ka analysis bhi zaroori hai. Agar market ka overall sentiment bullish hai, to is pattern ka breakout zyada reliable hota hai. Yeh dekhna bhi zaroori hai ke koi economic news ya events to nahi aa rahe jo market ko affect kar sakte hain.
            10. Fundamental Analysis Ka Asar


            Technical patterns ka analysis ke sath sath, fundamental analysis bhi bohot zaroori hai. Economic indicators, interest rates, aur geopolitical events market ko influence kar sakte hain. Isliye, traders ko hamesha in cheezon ka khayal rakhna chahiye jab wo falling wedge pattern ka istemal kar rahe hote hain.
            11. Risk-to-Reward Ratio


            Traders ko apne risk-to-reward ratio ka bhi khayal rakhna chahiye. Acha risk-to-reward ratio wo hota hai jahan aapka potential profit aapke potential loss se zyada ho. Is pattern ke liye, ye zaroori hai ke aap entry aur exit points ka tayun karein taake aap kaafi fayda utha sakein.
            12. Time Frame Ka Chayan


            Falling wedge pattern kisi bhi time frame par ban sakta hai, lekin day trading aur swing trading ke liye ye pattern zyada effective hota hai. Aapko time frame ka chayan apne trading style aur market conditions ke mutabiq karna chahiye.
            13. Psychological Aspects


            Traders ki psychology bhi market behavior par asar dalti hai. Falling wedge pattern dekhte waqt, market participants ka fear aur greed ka asar zaroor hota hai. Ye samajhna zaroori hai ke jab market me bullish signals milte hain, to traders ka mood bhi change hota hai.
            14. Conclusion


            Falling wedge pattern ek ahem tool hai jo forex traders ko market ki movement ko samajhne aur unka faida uthane mein madad karta hai. Is pattern ka sahi istemal karne se traders profitable trades kar sakte hain agar wo technical aur fundamental analysis ko sahi tarah se mila kar istemal karein. Har trader ko chahiye ke wo is pattern ki khasiyat aur trading strategies ko achi tarah se samjhe, taake wo apne trading results ko behtar bana sakein.
            • #7 Collapse

              ## Falling Wedge Pattern Ka Roll Forex Trading Mein
              Forex trading mein technical analysis ke liye patterns ka ghor se mutalia karna bohot zaroori hai. Inmein se ek ahem pattern "Falling Wedge" hai, jo market ke reversal aur trend continuation ko darshata hai. Is post mein, hum Falling Wedge pattern ki pehchan, formation, aur trading strategies par tafseel se baat karenge.

              ### Falling Wedge Pattern Kya Hai?

              Falling Wedge pattern ek bullish reversal pattern hai jo aksar downtrend ke dauran banta hai. Is pattern ki khasiyat yeh hai ke price ke swings lower highs aur lower lows bana rahe hote hain, lekin yeh movement dheere dheere narrow hoti jaati hai. Is pattern ko dekh kar traders ko yeh samajh aata hai ke sellers ka pressure kam ho raha hai aur buyers ki strength barh rahi hai.

              ### Pattern Ki Pehchan

              1. **Formation**: Falling Wedge pattern do converging trend lines par مشتمل hota hai. Pehli trend line lower highs ko connect karti hai, jabke doosri trend line lower lows ko connect karti hai. Yeh structure ek wedge ki tarah banata hai jo neeche ki taraf converge hota hai.

              2. **Market Context**: Yeh pattern aksar downtrend ke beech mein dekha jaata hai, jo yeh darshata hai ke market ki bearish momentum dheere dheere kam ho rahi hai. Agar yeh pattern kisi strong support level ke aas paas banta hai, to iski ahmiyat aur bhi barh jaati hai.

              ### Trading Strategy

              1. **Entry Point**: Jab Falling Wedge pattern complete hota hai aur price upper trend line ko todti hai, to yeh bullish breakout ka signal hota hai. Aap yahan buy position le sakte hain. Confirmation ke liye, agle candle ka bullish hona zaroori hai.

              2. **Stop-Loss**: Risk management ke liye stop-loss ko lower trend line ke neeche rakhna behtar hota hai. Isse aapko unexpected market movements se bachne mein madad milti hai.

              3. **Profit Target**: Profit target ko previous resistance levels par set karna chahiye. Isse aapko ek realistic exit point milta hai.

              ### Ahmiyat

              Falling Wedge pattern ki ahmiyat yeh hai ke yeh market reversals aur trend changes ko samajhne mein madad karta hai. Yeh pattern traders ko bullish momentum ka signal deta hai, jo unhe sahi waqt par buy positions lene ka mauka deta hai.

              ### Conclusion

              Falling Wedge pattern forex trading mein ek valuable tool hai jo market ki dynamics ko samajhne mein madad karta hai. Iski pehchan aur sahi trading strategy ka istemal karke, aap apne trading results ko behter bana sakte hain. Hamesha risk management par focus karein taake aap apne capital ko protect kar sakein. Market ka ghor se mutalia karne se is pattern ki effectiveness ko samajhna aasan hoga.
              • #8 Collapse

                **Falling Wedge Pattern Ka Role in Forex Trading**
                1. **Falling Wedge Pattern Kya Hai?**
                Falling wedge pattern aik bullish reversal pattern hai jo tab banata hai jab price lower highs aur lower lows bana raha hota hai. Yeh pattern downtrend ke doraan banta hai aur iski shape wedge jaisi hoti hai, jisme upper trendline niche ki taraf slope karti hai aur lower trendline bhi niche ki taraf slope karti hai, lekin iski angle zyada steep hoti hai.

                2. **Falling Wedge Ki Pehchan Kaise Karein?**
                Is pattern ki pehchan karne ke liye trader ko price chart par do trendlines draw karni padti hain. Upper trendline ko high points par aur lower trendline ko low points par draw karna hota hai. Jab price is wedge ke andar move karta hai, to yeh indicate karta hai ke market consolidation mode mein hai.

                3. **Trading Strategy: Entry Point**
                Jab price wedge pattern ki upper trendline ko break karta hai, to yeh bullish signal hota hai. Is point par traders entry le sakte hain. Yeh point yeh darust karta hai ke market bullish ho raha hai aur upward movement ka imkaan hai.

                4. **Stop-Loss Ka Istemaal**
                Falling wedge pattern ke trading strategy mein stop-loss set karna bohat zaroori hai. Trader ko stop-loss lower trendline ke neeche set karna chahiye taake agar market pattern ke khilaf move kare to losses se bach sake. Yeh stop-loss trader ko unexpected price movements se bachata hai.

                5. **Profit Target Kya Hona Chahiye?**
                Profit target set karte waqt trader ko previous swing high ko dekhna chahiye. Ek achha target previous resistance level ya Fibonacci retracement levels par ho sakta hai. Is tarah trader ko pata hota hai ke kab exit karna hai.

                6. **Volume Ka Role**
                Volume bhi falling wedge pattern ke liye important hai. Agar price pattern break out hota hai to saath mein volume increase hona chahiye, jo trend ke strong hone ki taraf ishaara karta hai. Agar volume nahi badta to breakout ki sustainability par shak hota hai.

                7. **Market Sentiment Ka Asar**
                Falling wedge pattern tabhi strong hota hai jab market sentiment bullish ho. Agar market mein bullish news ya events hain, to is pattern ke complete hone ki sambhavna badh jati hai. Traders ko market ki overall sentiment ko samajhna chahiye.

                8. **Indicators Ka Istemaal**
                Traders technical indicators jaise RSI (Relative Strength Index) ya MACD (Moving Average Convergence Divergence) ka bhi istemal kar sakte hain falling wedge pattern ke confirmation ke liye. Agar in indicators ki readings bhi bullish trend ko support kar rahi hain, to is pattern ki reliability aur badh jati hai.

                9. **Falling Wedge Aur Risk Management**
                Risk management har trading strategy ka important hissa hai. Traders ko apne risk-to-reward ratio ko evaluate karna chahiye. Ek acha ratio 1:2 ya 1:3 hota hai, jahan potential profit loss se do ya teen guna zyada ho.

                10. **Common Mistakes to Avoid**
                Falling wedge pattern trade karte waqt kuch common mistakes se bachna chahiye. Jaise ke over-leveraging, pattern ko identify karne mein galtiyan karna, ya stop-loss ko ignore karna. Yeh mistakes trader ko loss mein daal sakti hain.

                11. **Market Conditions Ka Asar**
                Falling wedge pattern ki effectiveness market conditions par bhi depend karti hai. High volatility ke doraan yeh pattern zyada reliable hota hai. Traders ko market ki volatility ko samajhna chahiye taake sahi time par entry ya exit le sakein.

                12. **Falling Wedge Pattern Ka Duration**
                Yeh pattern short-term ya long-term trend ke liye ban sakta hai. Short-term traders ko chhote timeframes par is pattern ko dekhna chahiye, jabke long-term traders daily ya weekly charts par focus kar sakte hain.

                13. **Conclusion**
                Falling wedge pattern Forex trading mein ek powerful tool hai jo traders ko bullish reversal signals provide karta hai. Is pattern ki sahi pehchan aur effective trading strategy se traders significant profits kama sakte hain. Lekin, is pattern ka istemal karte waqt market conditions, volume, aur risk management ko mad-e-nazar rakhna zaroori hai.
                • #9 Collapse

                  Falling wedge pattern forex trading mein ek important technical analysis tool hai. Iska istemal price action ke trend reversal ya continuation signals identify karne ke liye kiya jata hai. Is pattern ka structure aur uska significance kuch is tarah hai:


                  Structure

                  Formation: Falling wedge do converging trend lines ke saath banta hai, jahan upper trend line downward slope mein hoti hai aur lower trend line bhi downward slope mein hoti hai. Yeh pattern tab banta hai jab price lower highs aur lower lows bana rahi hoti hai.

                  Timeframe: Yeh pattern kisi bhi timeframe mein banta hai—intraday, daily, ya weekly charts par.


                  Characteristics

                  Volume: Pattern ke dauran volume aksar decreasing hota hai, jo trend ke momentum ki kami ko darshata hai.

                  Breakout: Jab price upper trend line ko todti hai, toh yeh bullish breakout hota hai, aur yeh signal karta hai ki price upward trend ki taraf ja sakti hai.


                  Significance

                  Trend Reversal: Falling wedge pattern aksar downtrend ke baad aata hai, aur iska breakout upward direction mein ho sakta hai. Yeh ek reversal signal hota hai.

                  Continuation Pattern: Kabhi-kabhi yeh pattern consolidation ka bhi indication de sakta hai, jahan price ek range mein move karti hai, aur breakout ke baad trend continue hota hai.

                  Risk Management: Is pattern ke sath stop loss set karna helpful hota hai, jo breakout point ke neeche rakha ja sakta hai, taaki agar price wapas girti hai toh loss minimize kiya ja sake.


                  Trading Strategy

                  Entry Point: Breakout ke baad, traders entry le sakte hain.

                  Target Setting: Target price ko measure kiya ja sakta hai pattern ki height se, jo breakout point se upar hota hai.


                  Conclusion

                  Falling wedge pattern forex trading mein ek powerful tool hai jo traders ko market ke potential reversals aur continuations ka signal dene mein madad karta hai. Is pattern ka sahi tarike se istemal karne par traders profit earn kar sakte hain, lekin risk management ka khayal rakhna bhi zaroori hai.

                  Click image for larger version

Name:	images (32).png
Views:	10
Size:	5.7 کلوبائٹ
ID:	13173875

                  Falling Wedge Pattern ki Mazeed Tafseel

                  1. Formation Process

                  Lower Highs and Lower Lows: Falling wedge pattern ki pehchaan iski formation se hoti hai, jahan price lower highs aur lower lows bana rahi hoti hai. Yeh market ki weakness ko darshata hai.

                  Duration: Yeh pattern kuch dinon se lekar kuch hafton tak ban sakta hai, aur zyada time le kar bhi banta hai, jo iski significance ko badha deta hai.


                  2. Indicators ka Istemal

                  Volume Analysis: Volume ke decrease hone se pata chalta hai ki market participants ka interest kam ho raha hai. Is pattern ke break hone par volume ka increase bullish confirmation de sakta hai.

                  Momentum Indicators: RSI (Relative Strength Index) ya MACD (Moving Average Convergence Divergence) jese indicators ka istemal kar ke confirmation liya ja sakta hai. Agar yeh indicators oversold area mein hain aur phir reversal signal dete hain, toh yeh bullish signal ho sakta hai.


                  3. Psychological Aspect

                  Trader Sentiment: Falling wedge pattern market participants ke beech bearish sentiment ko darshata hai. Jab price upper trend line ko todti hai, toh traders ka sentiment suddenly bullish ho jata hai, jo price ko upar le ja sakta hai.


                  4. Profit Target Calculation

                  Height Measure: Pattern ke peak se bottom tak ki distance ko measure karke target set kiya ja sakta hai. Yeh distance breakout point se add kiya jata hai.

                  Trail Stop Loss: Price ke upward movement ke sath stop loss ko adjust karna, profits ko protect karne ka ek acha tareeqa hai.


                  5. Common Mistakes

                  Premature Entry: Jab tak breakout confirmation na ho, tab tak entry nahi karni chahiye.

                  Ignoring Volume: Volume analysis ko ignore karna misleading ho sakta hai, kyunki yeh breakout ki strength ka indication deta hai.


                  6. Example Scenario

                  Market Conditions: Ek trader ne dekha ke price falling wedge pattern bana rahi hai. Unhone wait kiya jab price upper trend line ko todti hai, volume bhi increase hota hai, toh unhonne entry li. Unhone target set kiya pattern ki height ke hisaab se aur stop loss breakout point ke neeche rakha.


                  Conclusion

                  Falling wedge pattern ko samajhna aur iski effective trading strategies ko apnaana traders ko forex market mein achi opportunities dila sakta hai. Is pattern ke sath judne wale risk management aur technical indicators ka istemal karna zaroori hai taaki trading decisions informed ho.
                  • #10 Collapse

                    Role of Falling Wedge Pattern in Forex Trading


                    Falling Wedge Pattern ek bullish reversal pattern hai jo market ke downward trend ke end par form hota hai aur signal deta hai ke price ab upward move karegi. Yeh pattern traders ko indicate karta hai ke market bearish trend se bullish trend mein shift hone wala hai. Forex trading mein, falling wedge pattern ko ek reliable tool maana jata hai jo trend reversals ko identify karne mein madad karta hai.

                    Structure of the Falling Wedge Pattern:
                    1. Sloping Trendlines: Falling wedge pattern mein do downward-sloping trendlines hoti hain – ek upper trendline aur ek lower trendline. Dono trendlines ek doosre ki taraf converge karti hain, yaani gap between the lines narrow hoti jati hai. Yeh pattern tab form hota hai jab price continuously lower highs aur lower lows banata hai, lekin price range gradually shrink hoti jati hai.
                    2. Decreasing Volume: Falling wedge ke formation ke dauran market ka volume decrease hota jata hai, jo yeh signal deta hai ke market mein selling pressure ab weak ho raha hai. Jab breakout hota hai, to volume mein sudden increase hota hai, jo confirmation deta hai ke bullish trend shuru hone wala hai.

                    Click image for larger version

Name:	images (24).png
Views:	9
Size:	7.0 کلوبائٹ
ID:	13174673

                    How the Falling Wedge Pattern Works:

                    Falling wedge ek reversal pattern hota hai jo existing downtrend ke baad bullish breakout signal karta hai. Yeh pattern market ke bearish trend ke end par banta hai aur indicate karta hai ke price ab upward direction mein move karegi.
                    1. Formation Stage: Market mein jab price consistently neeche ja raha hota hai, to falling wedge banta hai jab price lower highs aur lower lows banata hai lekin gradually momentum slow ho jata hai aur price range narrow hone lagti hai. Is pattern ke form hone ka matlab yeh hota hai ke selling pressure weak ho raha hai aur buyers market mein wapas aane wale hain.
                    2. Breakout Point: Jab price upper trendline ko cross kar ke breakout karta hai, to yeh bullish reversal ka signal hota hai. Is waqt volume bhi increase hota hai, jo confirmation deta hai ke trend reversal ab shuru ho gaya hai.

                    Click image for larger version

Name:	images (21).jpeg
Views:	8
Size:	33.4 کلوبائٹ
ID:	13174674

                    How to Trade the Falling Wedge Pattern:
                    1. Identify the Pattern: Sab se pehle traders ko falling wedge ko properly identify karna hota hai. Yeh pattern tab banta hai jab price consistently downward move kar raha ho lekin price movement ki range narrow hoti jati hai. Is waqt do downward-sloping trendlines ko identify karna important hota hai.
                    2. Wait for Breakout: Pattern ke complete hone ka intizaar karna zaroori hai. Jab price upper trendline ke upar breakout karti hai, to traders ko confirmation milta hai ke bullish reversal shuru ho gaya hai.
                    3. Place Buy Orders: Jab breakout confirm ho jaye, to yeh buy order place karne ka waqt hota hai. Breakout ke baad price upward move karegi, aur is waqt volume mein bhi increase dekha ja sakta hai, jo trade ko confirm karta hai.
                    4. Stop Loss Placement: Stop loss ko previous low ya falling wedge ke neeche place karna zaroori hota hai taake agar trade galat direction mein jaye, to risk limited rahe. Is tarah stop loss market ke unexpected moves ke against protection provide karta hai.
                    Advantages of the Falling Wedge Pattern:
                    1. Strong Bullish Signal: Yeh pattern ek strong bullish signal provide karta hai jab downtrend ke baad market reversal hota hai. Traders is pattern ko use karke profitable buy opportunities ko identify kar sakte hain.
                    2. Easy to Identify: Falling wedge ka structure easily recognizable hota hai. Price ka narrowing range aur downward-sloping trendlines isko visually appealing aur simple banate hain.
                    3. High Probability of Success: Falling wedge ek high-probability pattern hota hai jo aksar accurate reversal signals deta hai. Is pattern ke through traders zyada confident trades place kar sakte hain.

                    Click image for larger version

Name:	banner_1-7.png
Views:	8
Size:	45.8 کلوبائٹ
ID:	13174675

                    Conclusion:


                    Falling Wedge Pattern ek bullish reversal pattern hai jo Forex traders ke liye ek valuable tool hai, especially jab market downtrend mein ho. Is pattern ke through market ke significant trend reversals ko pehle se identify kiya ja sakta hai, jo traders ko timely entry aur exit points provide karta hai. Jab properly identify aur trade kiya jaye, to falling wedge pattern forex trading mein profitable trading opportunities de sakta hai.
                    • #11 Collapse

                      Role of Falling Wedge Pattern in Forex Trading
                      Falling wedge pattern aik bullish reversal pattern hai jo traders ko market ke trend reversal identify karne mein madad deta hai. Yeh pattern us waqt banta hai jab price downward move kar raha ho, lekin uska momentum gradually decrease karne lagay. Yeh signal deta hai ke price downward trend khatam ho raha hai aur bullish reversal hone wala hai.

                      Pattern Ki Pehchan

                      Falling wedge pattern do trend lines se milkar banta hai. Upper trend line price ke highs ko connect karti hai, jabke lower trend line price ke lows ko. Yeh dono trend lines downward slope karti hain, lekin upper line ka slope ziada steep hota hai. Yeh indicate karta hai ke bears (sellers) ka control gradually kam ho raha hai aur bulls (buyers) strength gain kar rahe hain.

                      Formation ke Stages

                      1. Downtrend Start: Market pehle downward direction mein move karta hai.


                      2. Lower Highs aur Lower Lows: Price progressively lower highs aur lows create karta hai, lekin har new low pe momentum weak hota hai.


                      3. Breakout Point: Jab price resistance trend line ko todta hai, toh yeh bullish signal hota hai. Yeh breakout ziada volume ke sath hota hai, jo confirmation deta hai ke trend reverse hone wala hai.


                      Forex Trading Mein Is Pattern Ka Use

                      Entry Point: Jab price upper resistance line ko todta hai, traders buy orders place karte hain.

                      Stop Loss Placement: Stop loss ko wedge ke neeche place karna secure hota hai, taake agar market wapis neeche chala jaye toh losses control mein rahen.

                      Profit Target: Traders profit target us point par rakhte hain jo pattern ke beginning high ke aas paas ho, kyunke yeh pehla resistance level hota hai.


                      Importance in Forex

                      Forex trading mein falling wedge pattern ko identify karna ek valuable skill hai, kyunke yeh pattern market reversal ka early signal provide karta hai. Yeh pattern mostly trend continuation ke baad reversal batata hai, jahan pe sellers thak chuke hote hain aur buyers market mein control hasil karte hain.

                      Conclusion

                      Falling wedge pattern forex traders ke liye ek powerful tool hai jo bullish trend reversal ka indication deta hai. Is pattern ka sahi use karne ke liye, traders ko patience aur technical analysis ki zarurat hoti hai. Agar breakout confirm ho jaye, toh yeh ek profitable opportunity provide kar sakta hai.


                      • #12 Collapse

                        Falling Wedge Pattern Ka Role in Forex Trading

                        Forex trading me, chart patterns ko samajhna aur unka sahi istemal karna ek successful trader ban'nay ke liye bohot zaroori hota hai. Falling wedge pattern ek ahem aur popular pattern hai jo price ka reversal indicate karta hai. Ye pattern aksar downtrend ke baad banta hai, aur jab ye breakout hota hai to market me bullish move shuru hoti hai. Aayein dekhte hain ke ye pattern kya hota hai aur iska forex trading me kya role hai.

                        Falling Wedge Pattern Kya Hai?

                        Falling wedge pattern aik technical analysis ka tool hai jo price ki movement ko narrowing down kartay hue dikhata hai. Is pattern me, market ke high aur low gradually contract karte hain, yani highs kam hotay hain aur lows bhi dheere dheere kam hote hain. Is narrowing down ka matlab hota hai ke market me selling pressure kam ho raha hai aur buying interest barh raha hai.

                        Is pattern ka shape ek wedge ya triangular formation ka hota hai jo neeche ki taraf slope karta hai. Jab ye wedge breakout hoti hai, aksar market me bullish move dekhne ko milti hai, jo ke trend reversal ka indication hota hai.

                        Falling Wedge Pattern Ko Kaise Pehchana Jaye?

                        Falling wedge ko identify karna thoda mushkil lag sakta hai lekin agar aap charts ko dhyan se dekhte hain to is pattern ko samajhna aasan hota hai. Ye pattern un situations me banta hai jab market downtrend me hoti hai aur price ek tight range me move kar rahi hoti hai. Aapko do descending trendlines dikhai dengi jo market ke highs aur lows ko connect karti hain.

                        Dono lines ek point par converge hoti hain. Jab market wedge ki top line ko break kar deti hai, to samajh lein ke price ab reversal ki taraf ja rahi hai. Ye pattern market ke bottom me banta hai aur breakout ke baad price me sharp increase dekhne ko milta hai.

                        Falling Wedge Pattern Ka Forex Trading Me Faidah

                        Falling wedge pattern ka forex trading me faidah bohot zyada hota hai. Pehla faidah ye hai ke ye ek clear signal deta hai ke market ab downtrend se bullish move ki taraf ja rahi hai. Agar aap is pattern ko sahi waqt par pehchaan lein, to aap trading me bohot acha profit kama sakte hain.

                        Is pattern ko follow karte hue aap entry aur exit points ko bohot aasani se determine kar sakte hain. Jab wedge breakout hoti hai, to ye entry ka acha signal hota hai. Lekin, entry se pehle confirmation indicators jaise RSI ya volume check karna bhi zaroori hota hai.

                        Conclusion

                        Falling wedge pattern ek powerful tool hai jo forex traders ke liye market reversal ka indication karta hai. Agar aap is pattern ko sahi tareeqe se samajhkar istemal karte hain, to aap apni trading performance ko improve kar sakte hain aur profitable trades kar sakte hain.
                        • #13 Collapse

                          falling wedge pattern

                          forex market mein falling wedge pattern forex market mein aik kesam ka technical chart pattern hota hey kunkeh aam tor par kese kaim shodah nechay kay trend kay sath he banta hey yeh forex market ky trend jare kay bad bullish reversal janay ko he identify karta hey
                          forex market mein falling wedge pattern market mein lower level ko he identify kar sakte hey yeh forex market ke aik tang range mein sakarte hey forex market ke price finally resistance level kay oper he break ho jate falling wedge pattern ke aik or khasoseyat yeh bhe hote hey es ke forex market mein upper resistance line or nechay support line bhe ho sakte hey yeh forex market mein bullish otar charhao ka angle hota hey


                          Trade with Falling wedge Pattern

                          chonkeh forex market mein falling wedge chart pattern aik kesam ka bullish chart pattern hota hey yeh forex market ke oper resistance line bhe break ho jate hey es say pehlay woh aik long position par amal kar dein gay dosree taraf qadamat passand trader aam tor par forex market ke price ka intazar karen gay keh woh long trade mein enter ho saken breakout level ka phir say test hamaisha nahi ho sakta hey es kay result mein aik trader entry say mehroom ho sakta hey


                          Trade tips MACD

                          jab forex market ke real trading mein falling wedge ka estamal kartay ho to yeh aik acha sa kheyal nazar atta hey MACD histogram par ope ya nechay movement karta nazar atta hey yeh convergence divergence bhe hota hey es ko forex market mein aik ezafay ke confirmation kay tor par he estamal kar sakta hey forex market mein aam tor par he es mein ezafa ho jate hey or forex market ke price resistance line say oper break ho jate hey MACD histogram nay bhe falling wedge ke he shape bana le hote hey
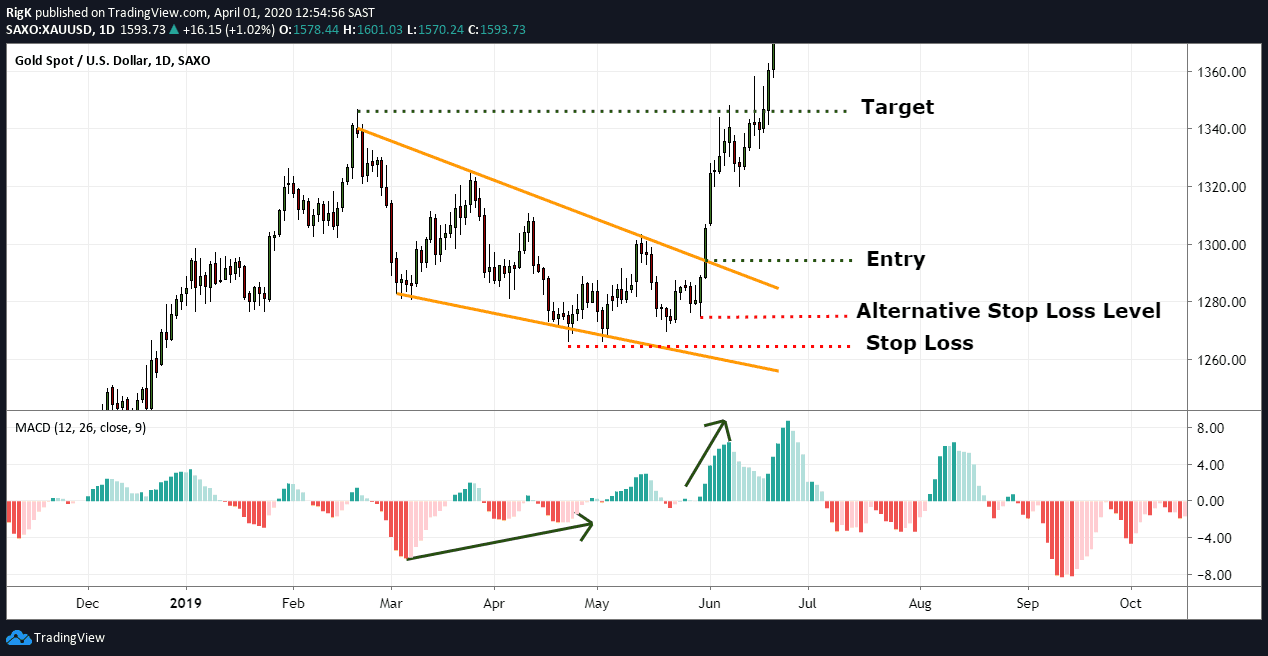
                          yeh opr deya geya mera last chart hey jokeh market kaygold kay chart ko nechay gertay hovay dekha sakta hey jes kay end honay kay sath trade jare rah sakte hey es kesam kay chart pattern mei qadamat pasand trader ko enter honay ka chance nahi melta hey
                          bhali kay badlay bhali
                          • <a href="https://www.instaforex.org/ru/?x=ruforum">InstaForex</a>
                          • #14 Collapse

                            Falling Wedge Pattern ka Forex Trading mein Kirdar

                            Forex trading mein different chart patterns ka bohat aham kirdar hota hai. Un mein se ek "falling wedge pattern" hai jo traders ko potential trend reversal aur price movement ke bare mein hints deta hai. Is article mein hum discuss karengay ke falling wedge pattern ka forex trading mein kaisa kirdar hota hai aur kaise isko samjha ja sakta hai.
                            1. Falling Wedge Pattern kya hai?


                            Falling wedge pattern ek bullish reversal pattern hai jo market ke bearish phase ke dauran develop hota hai. Is pattern mein price gradually lower highs aur lower lows banata hai, lekin support level ke qareeb aa kar yeh downtrend slow hota jata hai. Yeh pattern aakhir mein bullish breakout ki taraf ishara karta hai.
                            2. Pattern ka Structure kaise banata hai?


                            Falling wedge pattern do trendlines ke beech banta hai. Upper trendline lower highs ko connect karti hai aur lower trendline lower lows ko connect karti hai. Dono lines converging hoti hain, yani ek dosray ke qareeb aati hain, jo pattern ke squeeze hone ka ishara deti hain.
                            3. Bullish Breakout ka Mafhoom


                            Jab market falling wedge pattern ko poora karti hai aur price resistance line ko break karta hai, to yeh bullish breakout ka signal hota hai. Iska matlab hota hai ke ab market ne apna bearish trend khatam kar liya hai aur bullish side mein jana shuru karega. Yeh traders ke liye ek trading opportunity ka waqt hota hai.
                            4. Falling Wedge aur Downtrend


                            Falling wedge aksar ek lambe downtrend ke baad banta hai. Jab price ek lambe arsay tak girti rehti hai aur phir wedge pattern banta hai, to iska matlab hota hai ke sellers ka momentum kam ho raha hai aur buyers market mein wapas aa rahe hain.
                            5. Entry Points ka Tayeun


                            Falling wedge pattern ke breakout ke baad, ek trader entry point ko dhund sakta hai. Entry ka acha waqt tab hota hai jab price upper trendline ko break karta hai aur market bullish movement dikhata hai. Yeh confirm karta hai ke trend reversal ho gaya hai.
                            6. Support aur Resistance ka Kirdar


                            Is pattern mein support aur resistance ka kirdar bohat aham hota hai. Lower trendline jo support ka kaam karti hai, yeh point hota hai jahan price reversal ke chances badhtay hain. Upper trendline jo resistance ka kaam karti hai, uske break hone par bullish trend ka agaz hota hai.
                            7. Volume ka Ahmiyat


                            Falling wedge pattern ke sath volume ka barhna bhi zaroori hota hai. Jab breakout ke dauran volume increase hota hai, to yeh confirm karta hai ke market mein strength hai aur price ek naye trend mein move karega. Kam volume breakout par thoda risky hota hai.
                            8. False Breakouts se Bachao


                            False breakouts aksar forex trading mein dekhay jatay hain. Yani kabhi kabar price upper trendline ko break karta hai lekin phir wapas bearish trend mein chala jata hai. Is liye false breakouts se bachnay ke liye, confirmation ka wait karna zaroori hota hai, jaise ke high volume ya moving averages.
                            9. Risk Management


                            Har chart pattern ke sath risk management bohat zaroori hota hai. Falling wedge pattern mein agar aapki entry breakout ke baad hoti hai, to apni stop loss order ko support level ke neechay rakhna chahiye. Agar price wapas wedge ke andar chala jata hai, to yeh aapko unnecessary losses se bacha sakta hai.
                            10. Profit Targets ka Tayeun


                            Profit targets ka tayeun karna bhi important hota hai. Aam tor par, falling wedge pattern ke breakout ke baad price jitni height wedge ki hoti hai, utni door tak move kar sakti hai. Aap apni trades ka profit target isko mad-e-nazar rakh kar set kar sakte hain.
                            11. Falling Wedge in Different Timeframes


                            Yeh pattern har timeframe mein dekha ja sakta hai, chahe woh daily chart ho ya hourly chart. Lekin larger timeframes par falling wedge ka breakout zyada strong aur reliable hota hai. Short timeframes par false breakouts ke chances zyada hotay hain.
                            12. Fibonacci Levels aur Falling Wedge


                            Kayi traders falling wedge pattern ko Fibonacci retracement levels ke sath use karte hain. Jab price ek wedge pattern mein ho aur fibonacci levels ke sath align karta ho, to yeh ek mazid confirmation deta hai ke market mein reversal ke chances hain.
                            13. Common Mistakes in Wedge Trading


                            Ek common mistake jo traders karte hain, wo yeh hai ke pattern ko jaldi samajh lete hain aur entry early kar lete hain. Hamesha pattern ke poora hone ka intezar karna chahiye aur confirmation ka signal milne ke baad entry leni chahiye.
                            14. Wedge Pattern ka Application in Forex Trading


                            Forex trading mein falling wedge pattern ko samajhna aur uska sahi tareeqe se istemal karna ek valuable skill hai. Is pattern ka sahih analysis aur timing profitable trades ka sabab ban sakti hai. Agar aap pattern ke tamam elements ko samajh kar trading karain, to aap better decision making aur risk management ke zariye apne profits ko maximize kar sakte hain.

                            Natija
                            Falling wedge pattern forex trading mein ek bullish reversal indicator ke tor par kaam karta hai. Agar traders isko sahi tareeqe se pehchanain aur breakout ke waqt sahi entry karain, to is pattern se bohat si trading opportunities hasil ki ja sakti hain. Ye pattern khas tor par long-term downtrends ke baad aata hai aur ek strong bullish move ki nishani hota hai. Traders ke liye zaroori hai ke wo is pattern ke saath risk management ko bhi madde-nazar rakhein.

                            اب آن لائن

                            Working...
                            X