Cup aur Handle Chart Patterns.
X
  • وقت
  • دکھائیں
Clear All
new posts
  • #1 Collapse

    Cup aur Handle Chart Patterns.
    Introduction.

    Cup aur handle chart pattern ek mashhoor technical analysis tool hai jo investors aur traders ko madad karta hai future price movements ko predict karne mein. Yeh pattern aam tor par bullish continuation pattern hota hai jo price ki uptrend ko continue karne ka ishara deta hai.

    Cup Pattern.

    Cup pattern aik rounding bottom ki tarah dikhta hai. Yeh pattern tab banta hai jab price pehle girta hai, phir stabilize hota hai, aur phir dheere dheere recover karta hai.

    Kuch khas characteristics:
    • Depth: Cup ka depth vary kar sakta hai, magar aam tor par yeh shallow hota hai.
    • Duration: Cup ko form hone mein kuch weeks se lekar kuch months tak lag sakte hain.

    Click image for larger version

Name:	images (41).jpeg
Views:	17
Size:	44.6 کلوبائٹ
ID:	13076315

    Handle Pattern.

    Handle cup ke baad form hota hai aur yeh ek short-term consolidation phase ko represent karta hai. Handle pattern horizontal ya thoda sa downward sloping channel ki shakal mein hota hai.

    Kuch khas characteristics:
    • Depth: Handle ka depth aam tor par shallow hota hai, jo cup ka 1/3 ya kam part hota hai.
    • Duration: Handle ko form hone mein kuch din se kuch weeks lag sakte hain.

    Pattern Formation ka Tareeqa.
    1. Initial Drop: Pehle price girti hai aur yeh cup ka left side banata hai.
    2. Stabilization: Phir price stable hoti hai aur cup ka bottom form hota hai.
    3. Recovery: Iske baad price recover karti hai aur cup ka right side banata hai.
    4. Handle Formation: Cup complete hone ke baad, price thoda sa consolidate karti hai aur handle banata hai.
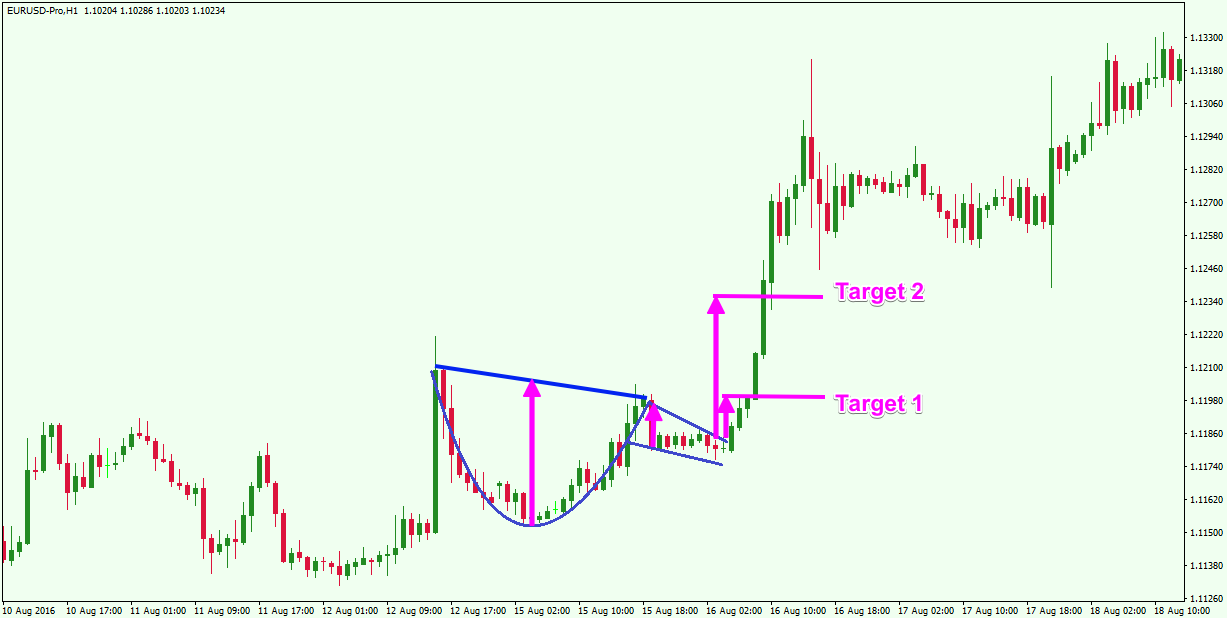
    5. Breakout: Jab handle complete hota hai aur price handle ke upper resistance level ko tor deti hai, yeh bullish breakout ka ishara hota hai.

    Trading Strategy.
    1. Entry Point: Jab price handle ki resistance line ko break karti hai, yeh entry ka signal hota hai.
    2. Stop Loss: Handle ke lowest point ke thoda niche stop loss set karna chahiye.
    3. Profit Target: Price ka target estimate karne ke liye, cup ki depth ko measure karke breakout point se add karna hota hai.

    Practical Example.

    Agar kisi stock ka price pehle $50 se girkar $40 par aa jaye, phir $50 tak recover ho, aur phir $45 par consolidate kare, toh yeh cup aur handle pattern banta hai. Jab price $50 ki resistance ko break karti hai, toh yeh bullish signal hota hai aur yeh expect kiya jata hai ke price aur upar jayegi.

    Benefits aur Limitations.

    Benefits:
    • Reliability: Aam tor par yeh pattern kaafi reliable hota hai.
    • Easy Identification: Visual form ki wajah se isse identify karna asaan hota hai.

    Limitations:
    • Time-consuming: Cup aur handle form hone mein waqt lagta hai.
    • False Signals: Kabhi kabhi false breakouts bhi ho sakte hain jo losses ka sabab ban sakte hain.
  • <a href="https://www.instaforex.org/ru/?x=ruforum">InstaForex</a>
  • #2 Collapse

    Cup aur Handle Chart Pattern kya hai?

    Cup aur Handle chart pattern aik bullish continuation pattern hota hai jo price consolidation aur trend continuation ko indicate karta hai. Ye pattern typically existing uptrend ke baad form hota hai aur potential breakout signal karta hai.

    Features of Cup and Handle Pattern

    Cup
    • Shape: Cup ka shape round ya "U"-shaped hota hai. Ye deeper aur more rounded hota hai, jo typical bottoming process ko indicate karta hai.
    • Depth: Cup ke depth market conditions aur volatility par depend karta hai. Shallow cup bhi bullish signal hota hai, lekin deeper cup stronger signal hota hai.
    • Duration: Cup formation mein weeks ya months lag sakte hain, depending on the timeframe.
    Handle
    • Formation: Cup ke formation ke baad, price thoda pullback hota hai, jo handle ka formation karta hai. Handle ka shape downward sloping ya sideways hota hai.
    • Depth: Handle ka depth typically cup ke depth ka 1/3 se 1/2 hota hai.
    • Duration: Handle formation mein typically 1-4 weeks lagte hain.
    Click image for larger version

Name:	images (85).png
Views:	14
Size:	4.9 کلوبائٹ
ID:	13076371

    Trading Strategy with Cup and Handle Pattern

    Identification and Confirmation
    1. Identify the Cup: Cup ko identify karne ke liye round bottom aur gradual slope ko dekhein. Ensure karein ke price steadily decline aur phir equally steadily rise ho.
    2. Identify the Handle: Cup ke baad handle ka formation dekhein, jo typically downward sloping ya sideways channel mein hota hai.
    3. Volume Analysis: Cup ke bottom ke near volume decrease hoti hai aur handle ke formation ke doran volume relatively low hoti hai. Breakout ke waqt volume increase hota hai.
    Entry and Exit Points
    1. Bullish Breakout:
      • Entry Point: Jab price handle ke upper trend line ko breakout ke sath cross kare aur volume increase ho, to buy entry consider kar sakte hain.
      • Stop Loss: Stop loss ko handle ke lower trend line ke neeche place karein.
      • Take Profit: Profit target ko pattern ke depth (cup ke bottom se top tak) ko measure karke set karein. Ye depth breakout point se project karke take profit level decide karein.
    Example of a Trading Scenario
    1. Identify the Cup: Assume a currency pair is forming a cup on the daily chart with a rounded bottom and gradual slope.
    2. Identify the Handle: After the cup formation, price pulls back slightly to form the handle.
    3. Volume Analysis: Notice that the volume decreases during the formation of the cup and handle, but surges during the breakout.
    4. Bullish Breakout: The price breaks above the upper trend line of the handle with an increase in volume.
      • Buy Entry: Enter a buy position just above the breakout point.
      • Stop Loss: Place a stop loss just below the lower trend line of the handle.
      • Take Profit: Measure the depth of the cup and project this distance from the breakout point to set the take profit level.
    Click image for larger version

Name:	images (84).png
Views:	12
Size:	7.1 کلوبائٹ
ID:	13076372

    Practical Trading Tips
    1. Regular Monitoring: Regularly market conditions aur cup and handle pattern ke signals ko monitor karna chahiye taake timely signals identify kiya ja sake aur sahi trading decisions liye ja sakein.
    2. Combining with Other Patterns: Cup and handle pattern ko doosre candlestick patterns aur technical indicators ke sath combine karke use karna chahiye taake stronger signals aur confirmations mil saken.
    Click image for larger version

Name:	images (83).png
Views:	12
Size:	11.6 کلوبائٹ
ID:	13076373

    Conclusion

    Cup aur Handle chart pattern forex trading mein potential trend continuation aur breakout scenarios ko identify karne mein madadgar hota hai. Iska sahi istemaal trading performance ko enhance kar sakta hai aur profitable opportunities ko identify karne mein madadgar ho sakta hai. Proper confirmation, risk management, aur additional indicators ka sath istemaal trading decisions ko improve karne mein madad kar sakta hai aur successful trades ke chances ko increase kar sakta hai.
    • #3 Collapse

      Cup Aur Handle Chart Patterns: Ek Mukammal Rehnumai

      1. Cup Aur Handle Pattern Ka Taaruf
      Cup aur handle chart pattern aik mashhoor technical analysis tool hai jo stock aur forex markets mein trend reversal aur continuation ke signals provide karta hai. Is pattern ko samajhne ke liye, sabse pehle humein yeh samajhna hoga ke yeh pattern kis tarah se develop hota hai aur iski key features kya hain. Cup aur handle pattern aksar bullish market conditions mein dekha jata hai, lekin kuch cases mein bearish scenarios bhi create ho sakte hain.

      Cup aur handle pattern ka design do primary components se mil kar bana hota hai: cup aur handle. Cup ka formation ek rounded U-shape ke tarah hota hai jo market ke gradual decline aur phir gradual recovery ko represent karta hai. Iske baad, handle part banata hai jo consolidation ya minor pullback ko dikhata hai, aur phir price breakout ke signal ke liye prepare hoti hai. Yeh pattern price movements ke behavior aur market trends ko analyze karne ke liye traders aur investors ke liye aik valuable tool hai.

      Cup aur handle pattern ko samajhne ke liye, humein iske formation process ko detail mein dekhna hoga. Cup aur handle pattern ka analysis karne se pehle, yeh zaroori hai ke hum market trends aur price movements ke basic concepts ko samjhein. Yeh pattern technical analysis ke tools aur techniques ko apply karte hue market ke future movements ko predict karne mein madad karta hai. Is pattern ki reliability ko samajhne ke liye historical data aur practical examples ka analysis karna bhi zaroori hota hai.

      2. Cup Ka Formation
      Cup ka formation ek gradual aur smooth U-shape ke design ka hota hai, jo market ke decline aur phir recovery ko represent karta hai. Cup ke formation ke doran, pehle market mein decline hoti hai jo selling pressure ke wajah se hoti hai. Yeh decline gradual aur consistent honi chahiye, jisse ke market mein strong bearish trend ki indication milti hai. Cup ka initial phase market ke top se decline ke sath start hota hai.

      Decline ke baad, market ek stage par aati hai jahan price stabilize hoti hai aur ek base form karti hai. Yeh base cup ke bottom ko represent karta hai aur yeh stabilization phase market ke selling pressure ke theek hone aur ek new bullish trend ke start hone ki indication hoti hai. Cup ke bottom ke baad, price gradually recovery phase mein enter karti hai, jo cup ke upper rim ke paas tak pohnchti hai. Yeh recovery phase smooth aur consistent honi chahiye, jisse cup ka rounded shape clearly visible hota hai.

      Cup ke formation ke dauran, price movement ko closely monitor karna zaroori hota hai. Traders ko dekhna hota hai ke cup ka shape perfect U-shape ban raha hai ya nahi. Agar cup ke formation mein kisi bhi tarah ki irregularity ya sudden spikes ho rahe hain, to yeh pattern ke reliability ko impact kar sakti hai. Isliye, cup ke formation ko accurately identify karna aur analyze karna traders ke liye critical hota hai.

      3. Handle Ka Formation
      Cup ke formation ke baad, handle ka formation hota hai jo consolidation ya minor pullback ko represent karta hai. Handle ka shape usually cup ke upper rim ke around hota hai aur yeh pattern ki continuation aur confirmation ke liye zaroori hota hai. Handle ke formation ke dauran, price ek sideway ya slightly downward move show karti hai jo cup ke upper portion ke saath aligned hoti hai.

      Handle ke formation ke doran, market mein consolidation phase hota hai jahan price narrow range mein move karti hai. Yeh consolidation phase usually short term hota hai aur handle ke duration ke dauran volume kam hota hai. Handle ke complete hone ke baad, price breakout ke signal ke liye prepare hoti hai. Handle ke formation ke baad, price ek upward movement show karti hai jo cup ke upper resistance level ko break karti hai.

      Handle ke formation ke dauran, volume analysis bhi important hota hai. Handle ke formation ke dauran volume usually kam hota hai aur handle ke complete hone ke baad volume mein significant increase hona chahiye. Yeh increase in volume handle ke break out aur pattern ke confirmation ko indicate karta hai. Handle ke shape aur volume analysis ko sahi tarah se samajhna aur interpret karna traders ke liye zaroori hota hai.

      4. Cup Aur Handle Pattern Ki Pehchaan
      Cup aur handle pattern ko pehchaan na tab hota hai jab cup aur handle ke elements clearly visible aur distinguishable hote hain. Cup ki shape ek smooth U-shape hoti hai jo price ke gradual decline aur recovery ko show karti hai. Handle ka formation cup ke upper portion ke around hota hai aur yeh consolidation ya minor pullback ko represent karta hai. Is pattern ki pehchaan ke liye, cup aur handle ke formation ke key features ko accurately identify karna zaroori hota hai.

      Cup aur handle pattern ki pehchaan ke liye, humein price movements aur market trends ko closely monitor karna hota hai. Cup aur handle ka formation clear aur distinct hona chahiye taake pattern ko accurately identify kiya ja sake. Agar cup aur handle ke elements mein kisi bhi tarah ki irregularity ya deviations ho rahe hain, to yeh pattern ke reliability ko impact kar sakti hai. Isliye, pattern ke formation aur pehchaan ko sahi tarah se analyze karna zaroori hai.

      Cup aur handle pattern ki pehchaan ke liye, historical data aur practical examples ka analysis bhi helpful hota hai. Traders aur investors ko previous patterns aur market trends ko analyze karna chahiye taake woh pattern ke behavior aur performance ko samajh saken. Yeh analysis pattern ke pehchaan aur interpretation ke liye valuable insights provide karta hai.

      5. Cup Aur Handle Pattern Ki Time Frame
      Cup aur handle pattern kisi bhi time frame mein develop ho sakta hai, lekin long-term charts par yeh pattern zyada reliable hota hai. Daily aur weekly charts par yeh pattern zyada prominent aur reliable hota hai, kyunki long-term charts price movements aur market trends ko better reflect karte hain. Short-term charts par pattern ki accuracy aur reliability thodi kam ho sakti hai.

      Long-term charts par cup aur handle pattern ko dekhna aur analyze karna zyada effective hota hai kyunki yeh pattern market ke broader trends aur movements ko reflect karta hai. Daily aur weekly time frames par pattern ki formation aur confirmation zyada clear hoti hai. Iske ilawa, long-term charts par pattern ke behavior aur performance ka analysis bhi zyada accurate hota hai.

      Short-term charts par cup aur handle pattern ki formation ke dauran market volatility aur sudden price movements ki wajah se pattern ke accuracy aur reliability mein variations aa sakte hain. Short-term charts par pattern ko analyze karne ke liye, traders ko additional indicators aur tools ka istemaal karna padta hai taake pattern ke signals ko confirm kiya ja sake.

      6. Cup Aur Handle Pattern Ka Volume Analysis
      Volume analysis cup aur handle pattern ke liye critical hota hai. Cup ke formation ke dauran volume generally kam hota hai, jab price decline aur consolidation phase mein hoti hai. Volume ka decrease cup ke formation ke part hota hai aur yeh price movement ke gradual nature ko indicate karta hai. Cup ke completion ke baad, handle ke formation ke dauran bhi volume usually low hota hai.

      Handle ke formation ke baad, volume mein significant increase hona chahiye, jo breakout ke signal ko confirm karta hai. Yeh increase in volume handle ke completion aur price ke upward movement ke confirmation ke liye zaroori hota hai. Volume analysis cup aur handle pattern ke reliability aur validity ko confirm karne ke liye use hota hai.

      Volume ka analysis cup aur handle pattern ke different stages par market ke behavior aur trend ko samajhne mein madad karta hai. Traders ko volume ke changes ko closely monitor karna chahiye taake woh pattern ke signals ko accurately interpret kar saken. Volume analysis pattern ke performance aur accuracy ko enhance karne mein madadgar hota hai.

      7. Entry Points
      Cup aur handle pattern mein entry point handle ke breakout ke baad hota hai. Jab price handle ke upper resistance level ko break karti hai, to yeh bullish signal hota hai aur traders entry point consider karte hain. Entry point ko identify karne ke liye, handle ke upper resistance level aur breakout point ko accurately determine karna zaroori hota hai.

      Entry points ko identify karne ke liye, traders ko cup aur handle ke formation ke key levels aur price movements ko closely monitor karna chahiye. Handle ke break out ke baad price ka momentum aur movement ko dekhna zaroori hota hai taake entry point ke accuracy ko confirm kiya ja sake. Entry points ka sahi identification traders ko profitable trades execute karne mein madad karta hai.

      Entry points ke determination ke liye, traders ko technical indicators aur tools ka bhi istemaal karna chahiye. Moving Averages, RSI, aur MACD jaise indicators entry points ke confirmation aur trade decisions ke liye useful hote hain. Yeh indicators entry points ki accuracy aur reliability ko enhance karne mein madadgar hote hain.

      8. Stop-Loss Levels
      Stop-loss levels ko handle ke lowest point ke niche place kiya jata hai. Yeh precautionary measure hai taake agar market unexpected move kare to loss minimize ho sake. Stop-loss level handle ke low ke thoda niche rakha jata hai, jo market ke sudden movements aur price fluctuations ke against protection provide karta hai.

      Stop-loss levels ke placement ko accurately determine karne ke liye, traders ko handle ke formation ke low aur price movements ko closely monitor karna chahiye. Stop-loss levels ka sahi placement risk management aur loss prevention ke liye zaroori hota hai. Yeh levels traders ko market ke unexpected movements ke against safeguard karte hain.

      Stop-loss levels ke placement ke liye, traders ko market conditions aur volatility ko bhi consider karna chahiye. Agar market volatility high hai, to stop-loss levels ko slightly adjust karna pad sakta hai taake unexpected price movements ke against protection ensure kiya ja sake. Risk management strategies ke implementation se trading decisions ko better manage kiya ja sakta hai.

      9. Target Price Calculation
      Target price cup aur handle pattern ke breakout ke baad calculate kiya jata hai. Target price ko cup ke depth se measure karke handle ke breakout point se add kiya jata hai. Yeh calculation traders ko potential profit targets provide karti hai aur trading decisions ko guide karti hai.

      Target price calculation ke liye, cup ke depth ko accurately measure karna zaroori hota hai. Cup ke depth ko handle ke breakout point ke sath add karke target price determine kiya jata hai. Yeh target price traders ko market ke potential movements aur profit targets ke estimation ke liye madad karta hai.

      Target price calculation ke dauran, traders ko market conditions aur volatility ko bhi consider karna chahiye. Agar market conditions favorable hain, to target price ko adjust karna pad sakta hai taake profit potential ko maximize kiya ja sake. Target price calculation se traders ko trading strategies aur decision-making ko better manage kiya ja sakta hai.

      10. Cup Aur Handle Pattern Ki Strength
      Cup aur handle pattern ki strength tab hoti hai jab handle ki consolidation period chhoti hoti hai aur volume breakout ke doran significantly increase hota hai. Strong pattern tab consider hota hai jab cup ke formation aur handle ke consolidation clean aur distinct ho. Pattern ke strength ko accurately evaluate karna traders ke liye zaroori hota hai.

      Pattern ke strength ko assess karne ke liye, cup aur handle ke formation ke key features aur volume analysis ko consider karna zaroori hota hai. Agar cup aur handle ke elements clearly visible aur distinct hain, aur volume analysis breakout ke signal ko confirm karta hai, to pattern ko strong consider kiya jata hai. Pattern ke strength ka accurate assessment trading decisions ke liye crucial hota hai.

      Pattern ke strength ke evaluation ke liye, traders ko historical data aur practical examples ka bhi analysis karna chahiye. Previous patterns aur market trends ke analysis se traders ko pattern ke strength aur performance ke valuable insights milte hain. Yeh insights trading strategies aur decision-making ko better guide karne mein madadgar hoti hain.

      11. Cup Aur Handle Pattern Ki Limitations
      Har pattern ki tarah, cup aur handle pattern bhi perfect nahi hota. Kabhi-kabhi pattern incomplete hota hai ya market conditions ke chalte yeh pattern fail ho sakta hai. Isliye traders ko hamesha risk management aur stop-loss strategies ko implement karna chahiye. Pattern ke limitations aur potential failures ko samajhna traders ke liye zaroori hota hai.

      Pattern ke limitations ko samajhne ke liye, traders ko market conditions aur price movements ko closely monitor karna chahiye. Agar pattern ke formation mein kisi bhi tarah ki irregularity ya deviations ho rahe hain, to yeh pattern ke reliability ko impact kar sakti hai. Risk management strategies aur stop-loss levels ka implementation pattern ke limitations ko manage karne mein madadgar hota hai.

      Pattern ke limitations ke baad bhi, traders ko market conditions aur price movements ke changes ko consider karna chahiye. Kabhi-kabhi market conditions unexpected ho sakti hain aur pattern ke reliability ko impact kar sakti hain. Isliye, trading decisions ko carefully evaluate karna aur risk management strategies ko implement karna zaroori hota hai.

      12. Cup Aur Handle Pattern Ke Variations
      Cup aur handle pattern ke kuch variations bhi hote hain, jaise ki rounded cup aur saucer shape, jo cup ke formation ko thoda modify karte hain. Yeh variations pattern ke analysis ko thoda complex bana dete hain lekin general concept wahi hota hai. Variations ke analysis ke liye, traders ko pattern ke key features aur elements ko closely monitor karna chahiye.

      Cup aur handle pattern ke variations ko accurately identify karne ke liye, traders ko market trends aur price movements ka detailed analysis karna hota hai. Variations ke analysis se traders ko pattern ke behavior aur performance ke better insights milte hain. Yeh insights trading strategies aur decision-making ko guide karne mein madadgar hoti hain.

      Variations ke analysis ke dauran, traders ko historical data aur practical examples ka bhi analysis karna chahiye. Previous patterns aur variations ke analysis se traders ko pattern ke behavior aur performance ke valuable insights milte hain. Yeh insights pattern ke analysis aur interpretation ko enhance karne mein madadgar hoti hain.

      13. Cup Aur Handle Pattern Ka Historical Performance
      Historical data ke according, cup aur handle pattern ka performance kaafi reliable hota hai. Yeh pattern kaafi successful raha hai long-term investments aur swing trading mein. Lekin har market condition aur asset ke liye performance vary kar sakti hai. Historical performance ke analysis se traders ko pattern ke behavior aur performance ke valuable insights milte hain.

      Historical performance ke analysis ke liye, traders ko previous patterns aur market trends ka detailed analysis karna chahiye. Historical data se traders ko pattern ke performance aur reliability ke insights milte hain. Yeh insights trading decisions aur strategies ko guide karne mein madadgar hoti hain.

      Historical performance ke analysis ke dauran, traders ko market conditions aur asset-specific factors ko bhi consider karna chahiye. Kabhi-kabhi market conditions aur asset-specific factors pattern ke performance ko impact kar sakte hain. Isliye, historical data ke analysis ke sath market conditions aur factors ko bhi consider karna zaroori hota hai.

      14. Cup Aur Handle Pattern Ke Saath Other Indicators Ka Istemaal
      Cup aur handle pattern ko confirm karne ke liye dusre technical indicators jaise Moving Averages, RSI (Relative Strength Index), aur MACD (Moving Average Convergence Divergence) ka bhi istemaal kiya jata hai. Yeh indicators pattern ke validity ko confirm karne aur trade decision ko support karne mein madadgar hote hain. Indicators ke istemaal se pattern ke signals ko enhance kiya ja sakta hai.

      Indicators ka istemaal cup aur handle pattern ke analysis ke liye trading decisions aur strategies ko better guide karne mein madadgar hota hai. Moving Averages, RSI, aur MACD jaise indicators pattern ke confirmation aur validation ke liye useful hote hain. Indicators ke analysis se traders ko pattern ke behavior aur performance ke valuable insights milte hain.

      Indicators ke istemaal ke dauran, traders ko pattern ke key features aur volume analysis ko bhi consider karna chahiye. Indicators ke analysis ke sath pattern ke key features aur volume analysis ko combine karke trading decisions ko better manage kiya ja sakta hai. Indicators aur pattern ke combination se trading strategies aur decisions ko enhance kiya ja sakta hai.

      Conclusion
      Cup aur handle chart pattern ek effective aur reliable trading tool hai jo trend reversal aur continuation signals provide karta hai. Is pattern ka sahi istemaal karne ke liye traders ko iske formation, volume analysis, aur risk management strategies ko samajhna zaroori hai. Cup aur handle pattern ko dusre technical indicators ke saath combine karke traders apni trading strategies ko aur bhi effective bana sakte hain. Pattern ke thorough analysis aur understanding se traders market trends aur movements ko better predict kar sakte hain aur profitable trading decisions le sakte hain.
      • #4 Collapse

        Cup aur Handle Chart Patterns

        1. Cup aur Handle Chart Pattern kya hai?

        Cup aur Handle Chart Pattern technical analysis ka ek mashhoor pattern hai jo stock, forex, aur commodities markets mein trends ko samajhne ke liye use hota hai. Ye pattern bullish trend ka indication hota hai aur iska formation ek specific sequence follow karta hai. Cup aur Handle pattern ka design ek coffee cup jaisa hota hai, jisme cup ka shape rounded bottom ko represent karta hai aur handle ek consolidation phase ko dikhata hai. Is pattern ko identify karne se traders ko potential price movements ke bare me insight milti hai aur wo apni trading strategies ko accordingly adjust kar sakte hain.

        Is pattern ki pehchan karne ke liye, traders ko market ke historical data ka analysis karna parta hai. Cup aur Handle pattern ka formation market ki sentiment ko bhi reflect karta hai. Jab market me buying pressure barh jata hai aur sellers ka control kam ho jata hai, tab ye pattern develop hota hai. Cup aur Handle pattern ko samajhna aur correctly identify karna trading ke liye crucial hota hai kyunki ye ek strong buy signal ka indication hota hai. Is pattern ki accuracy aur reliability traders ko market me entry aur exit points ko decide karne me help karti hai.

        Cup aur Handle pattern ki formation ke dauran price action ka closely observe karna zaroori hota hai. Is pattern ka complete hone ke baad, price action usually ek strong bullish trend ko follow karti hai. Ye pattern market me trends aur reversals ko identify karne ke liye ek effective tool hai. Traders ko is pattern ke different stages aur phases ko samajhna chahiye taake wo apni trading decisions ko sahi tarike se le sakein.

        Cup aur Handle pattern ka analysis karte waqt, market conditions aur external factors ko bhi consider karna zaroori hai. Economic indicators, news events, aur market sentiment pattern ke formation aur reliability ko affect kar sakte hain. Traders ko pattern ke formation ke sath-sath market ke broader context ko bhi analyze karna chahiye taake wo accurate trading decisions le sakein.

        2. Cup ki Pehchaan

        Cup ka formation ek rounded shape ko represent karta hai, jiska bottom portion market ke price movement ko reflect karta hai. Iska pehla phase ek significant downtrend ko show karta hai, jisme price ne apna peak achieve kiya hota hai aur phir girti hai. Ye phase market me selling pressure aur bearish sentiment ko reflect karta hai. Cup ke formation ka ye initial stage market ke participants ke sentiment ko depict karta hai aur price ke future movements ko predict karne me madad karta hai.

        Cup ke bottom ke baad, price gradually wapas uhti hai aur ek rounded bottom banati hai. Is phase me market me buying pressure badh jata hai aur selling pressure kam ho jata hai. Traders ko is phase me dekhna chahiye ke kya price smoothly recover ho rahi hai ya nahi. Cup ki depth aur shape price ke strength aur weakness ko indicate karti hai. Rounded bottom ka formation ek strong bullish signal hota hai, jo future me price ke upward movement ko suggest karta hai.

        Cup ke formation ke dauran price ka smooth aur gradual recovery important hoti hai. Sharp declines aur rapid recoveries cup ke ideal formation se hat karte hain aur pattern ke accuracy ko affect kar sakte hain. Traders ko cup ke formation ke dauran price action aur volume ke changes ko closely monitor karna chahiye taake wo pattern ke reliability ko assess kar sakein. Cup ke formation ke complete hone ke baad, price ek resistance level ko test karti hai jo pattern ke handle phase ko initiate karta hai.

        Cup ke formation me volume analysis bhi zaroori hota hai. Ideal situation me, volume cup ke initial decline ke dauran high hota hai aur cup ke rounded bottom ke dauran kam hota hai. Ye volume patterns market ke sentiment aur buying pressure ko reflect karte hain. Traders ko volume aur price action ke combination ko analyze karna chahiye taake wo accurate trading decisions le sakein aur market trends ko accurately predict kar sakein.

        3. Handle ka Formation

        Handle cup ke formation ke baad aata hai aur ek consolidation phase ko represent karta hai. Handle ke formation ke dauran price thodi consolidation aur slight downward movement dikhati hai. Ye phase market ke short-term volatility aur price fluctuations ko capture karta hai. Handle ka formation ek flag ya pennant pattern me hota hai, jisme price sideways ya slight downward trend me move karti hai.

        Handle ke formation ke dauran, price ka ek narrow trading range ban jata hai. Ye phase market me uncertainty aur consolidation ko show karta hai, jisme traders ko dekhna hota hai ke price kis direction me move kar rahi hai. Handle ka formation bullish trend ke continuation ka signal hota hai, jo cup ke rounded bottom ke baad aata hai. Handle ke formation ke dauran, volume bhi important hota hai, jo consolidation phase ke strength ko indicate karta hai.

        Handle ke formation ke time frame ko bhi consider karna zaroori hota hai. Short-term handle patterns fast movements aur high volatility ko show karte hain, jabki long-term handle patterns slower aur gradual movements ko represent karte hain. Traders ko handle ke formation ke dauran price aur volume ke changes ko closely monitor karna chahiye taake wo pattern ke reliability aur accuracy ko assess kar sakein.

        Handle ke formation ke baad, price ka breakout cup ke high ke upar hona chahiye. Ye breakout ek strong bullish signal hota hai jo traders ko buy position lene ke liye encourage karta hai. Handle ke formation aur breakout ke dauran price action aur volume ko analyze karna zaroori hota hai taake traders accurate entry aur exit points identify kar sakein. Handle ke completion ke baad, price ke upward movement ko monitor karna aur trading strategy ko adjust karna bhi important hota hai.

        4. Cup aur Handle ka Duration

        Cup aur Handle pattern ka duration market conditions ke hisaab se vary kar sakta hai. Generally, cup ke formation me 6-8 weeks lagte hain aur handle ke formation me 1-4 weeks lagte hain. Cup aur handle ke duration ko accurately estimate karna trading strategy ke liye important hota hai. Short-term patterns jaldi complete ho jate hain jabki long-term patterns me zyada time lag sakta hai.

        Cup ke duration ke dauran, market me price ka gradual recovery aur consolidation hota hai. Traders ko cup ke formation ke dauran price movements aur volume changes ko closely monitor karna chahiye. Handle ke formation ke dauran, consolidation aur slight downward movement ka observation bhi zaroori hota hai. Ye observations pattern ke reliability aur accuracy ko assess karne me madad karte hain.

        Cup aur Handle pattern ke duration ko estimate karte waqt market conditions aur external factors ko bhi consider karna chahiye. Economic indicators, news events, aur market sentiment pattern ke duration aur accuracy ko affect kar sakte hain. Traders ko broader market context ko analyze karna zaroori hota hai taake wo accurate duration estimates aur trading decisions le sakein.

        Pattern ke duration ke analysis ke dauran, historical data aur past performance ko bhi consider karna chahiye. Historical patterns aur previous trends ke analysis se traders ko current pattern ke duration aur reliability ka insight mil sakta hai. Cup aur Handle pattern ka duration accurately estimate karna trading strategy ke success ke liye crucial hota hai.

        5. Pattern ka Significance

        Cup aur Handle pattern ka significance bullish trend ke indication me hai. Ye pattern ek strong buy signal hota hai, jo market me buying pressure aur bullish sentiment ko reflect karta hai. Cup aur Handle pattern ke formation ke baad, price usually ek strong upward movement ko follow karti hai, jo traders ko profitable trading opportunities provide karta hai.

        Pattern ka significance traders ko market trends ko accurately predict karne me madad karta hai. Cup aur Handle pattern ko identify karne se traders ko potential buy signals milte hain jo unki trading strategies ko enhance karte hain. Ye pattern market ke bullish phase ko capture karta hai aur traders ko timely entry aur exit points provide karta hai.

        Pattern ka significance market ke sentiment aur price action ko reflect karta hai. Jab market me buying pressure barh jata hai aur sellers ka control kam ho jata hai, tab ye pattern develop hota hai. Cup aur Handle pattern ke formation ke baad, price ka upward movement traders ko market me positive trends aur profitable opportunities dikhata hai.

        Cup aur Handle pattern ka significance volume aur price action ke combination me bhi hota hai. Ideal scenario me, volume cup ke formation ke dauran kam hota hai aur handle ke formation ke dauran increase hota hai. Ye volume patterns market ke bullish sentiment aur buying pressure ko indicate karte hain. Traders ko pattern ke significance ko samajhne ke liye volume aur price action ka analysis zaroori hota hai.

        6. Entry Point

        Cup aur Handle pattern me entry point handle ke high ke breakout par hota hai. Jab price handle ke high ko break karti hai, to ye ek strong buy signal hota hai. Entry point ko accurately identify karna trading strategy ke success ke liye crucial hota hai. Traders ko breakout point ke sath price action aur volume changes ko closely monitor karna chahiye.

        Entry point ke selection me pattern ke accuracy aur reliability ko bhi consider karna chahiye. Cup aur Handle pattern ke formation ke dauran price ka gradual recovery aur handle ke consolidation phase ko observe karna zaroori hota hai. Entry point tab hota hai jab price handle ke high ko successfully break karti hai aur market me bullish trend ko confirm karti hai.

        Entry point ko determine karte waqt stop loss placement aur target price calculation bhi important hoti hai. Traders ko entry point ke sath stop loss ko handle ke lowest point ke neeche set karna chahiye. Ye ensure karta hai ke agar pattern fail ho jaye to loss limit me rahe. Target price calculation me cup ke depth ko handle ke breakout point se add karna hota hai, jo potential profit ko estimate karne me madad karta hai.

        Entry point ke selection me market conditions aur external factors ko bhi consider karna zaroori hota hai. Economic indicators, news events, aur market sentiment entry point ke accuracy aur reliability ko affect kar sakte hain. Traders ko broader market context ko analyze karna chahiye taake wo accurate entry points aur trading decisions le sakein.

        7. Stop Loss Placement

        Stop loss placement Cup aur Handle pattern ke trading strategy ka ek important aspect hai. Stop loss ko handle ke lowest point ke neeche set kiya jata hai, jo pattern ke failure ke case me loss ko limit karta hai. Ye traders ko unexpected price movements aur market volatility ke against protection provide karta hai.

        Stop loss placement ke liye, traders ko handle ke formation ke dauran price action aur volume changes ko observe karna chahiye. Handle ke lowest point ko accurately identify karna zaroori hota hai, jo stop loss ke placement me madad karta hai. Agar price handle ke lowest point ke neeche girti hai, to ye pattern ke failure ka indication hota hai aur traders ko loss ko limit karna hota hai.

        Stop loss ko set karte waqt risk management strategy ko bhi consider karna chahiye. Risk management strategy ke according, stop loss ko pattern ke reliability aur accuracy ke hisaab se adjust kiya jata hai. Traders ko stop loss placement ko carefully plan karna chahiye taake wo market volatility aur price fluctuations ke against effective protection provide kar sakein.

        Stop loss placement ke dauran market conditions aur external factors ko bhi consider karna zaroori hota hai. Economic indicators, news events, aur market sentiment stop loss placement ke effectiveness ko affect kar sakte hain. Traders ko stop loss placement ko broader market context ke hisaab se adjust karna chahiye taake wo accurate trading decisions le sakein.

        8. Target Price Calculation

        Target price calculation Cup aur Handle pattern me potential profit ko estimate karne ke liye zaroori hoti hai. Target price ko calculate karne ke liye, cup ke depth ko handle ke breakout point se add kiya jata hai. Ye calculation traders ko price ke future movements aur profit potential ko estimate karne me madad karti hai.

        Cup ke depth ko accurately measure karna target price calculation me critical hota hai. Depth ko measure karne ke liye, cup ke peak aur bottom ke beech ka distance calculate kiya jata hai. Handle ke breakout point se is depth ko add karne se target price ka estimation milta hai, jo traders ko potential profit ko assess karne me help karta hai.

        Target price calculation me volume analysis aur market conditions ko bhi consider karna zaroori hota hai. Ideal scenario me, volume cup ke formation ke dauran kam hota hai aur handle ke formation ke dauran increase hota hai. Ye volume patterns target price calculation ke accuracy aur reliability ko affect karte hain. Traders ko volume aur price action ke combination ko analyze karna chahiye taake wo accurate target price estimate kar sakein.

        Target price calculation ke dauran risk management strategy ko bhi consider karna chahiye. Risk management strategy ke according, target price ko adjust kiya jata hai aur profit potential ko maximize kiya jata hai. Traders ko target price calculation ko carefully plan karna chahiye taake wo market trends aur price movements ke hisaab se effective trading decisions le sakein.

        9. Pattern ke Variations

        Cup aur Handle pattern ke variations market conditions aur external factors ke hisaab se vary kar sakte hain. Is pattern ke variations me deep cup, shallow cup, aur long handle shamil hain. Har variation ka apna significance aur trading strategy hoti hai jo traders ko market trends ko accurately predict karne me madad karti hai.

        Deep cup variations me, cup ka bottom significantly deep hota hai aur handle ke formation ke dauran consolidation phase bhi prolonged hota hai. Ye variations market ke bearish sentiment aur selling pressure ko reflect karti hain. Shallow cup variations me, cup ka bottom relatively shallow hota hai aur handle ka consolidation phase bhi short-term hota hai. Ye variations market ke bullish sentiment aur buying pressure ko indicate karti hain.

        Long handle variations me, handle ka consolidation phase long-term hota hai aur price thodi volatility dikhati hai. Ye variations market ke uncertainty aur consolidation ko reflect karti hain. Traders ko pattern ke variations ko identify karna aur unke significance ko samajhna chahiye taake wo apni trading strategies ko accordingly adjust kar sakein.

        Pattern ke variations ke analysis me historical data aur past performance ko bhi consider karna chahiye. Historical patterns aur previous trends ke analysis se traders ko current pattern ke variations aur reliability ka insight mil sakta hai. Pattern ke variations ko accurately analyze karne se traders ko market trends aur trading opportunities ko better understand karne me madad milti hai.

        10. Volume Analysis

        Volume analysis Cup aur Handle pattern me crucial hota hai, jo pattern ke formation aur reliability ko determine karta hai. Ideal scenario me, volume cup ke formation ke dauran kam hota hai aur handle ke formation ke dauran increase hota hai. Ye volume patterns market ke sentiment aur buying pressure ko reflect karte hain aur pattern ke accuracy ko assess karne me madad karte hain.

        Volume analysis ke liye, traders ko price action aur volume ke combination ko closely monitor karna chahiye. Cup ke formation ke dauran, volume ka low hona market ke consolidation aur recovery phase ko indicate karta hai. Handle ke formation ke dauran, volume ka increase hona bullish trend ke continuation aur buying pressure ko reflect karta hai. Ye volume patterns pattern ke reliability aur accuracy ko confirm karte hain.

        Volume analysis me market conditions aur external factors ko bhi consider karna zaroori hota hai. Economic indicators, news events, aur market sentiment volume analysis ko affect kar sakte hain. Traders ko volume aur price action ke combination ko broader market context ke hisaab se analyze karna chahiye taake wo accurate trading decisions le sakein.

        Volume analysis ke dauran historical data aur past performance ko bhi consider karna chahiye. Historical volume patterns aur previous trends ke analysis se traders ko current pattern ke volume changes aur reliability ka insight mil sakta hai. Volume analysis ko accurately perform karne se traders ko market trends aur trading opportunities ko better understand karne me madad milti hai.

        11. Cup aur Handle Pattern ki Limitations

        Har technical analysis pattern ke kuch limitations hote hain aur Cup aur Handle pattern bhi isse mukhtasir nahi hai. Cup aur Handle pattern ka formation market conditions aur external factors ke hisaab se vary kar sakta hai. Is pattern ki limitations ko samajhna aur trading strategy ko accordingly adjust karna zaroori hota hai.

        Pattern ki limitations me false breakouts aur market volatility shamil hain. Cup aur Handle pattern me false breakouts ke chances hote hain, jahan price handle ke high ko break karne ke baad wapas gir sakti hai. Market volatility aur unexpected price movements pattern ke accuracy ko affect kar sakte hain aur trading decisions ko challenging bana sakte hain.

        Pattern ke limitations ke analysis me market conditions aur external factors ko consider karna zaroori hota hai. Economic indicators, news events, aur market sentiment pattern ke formation aur reliability ko affect kar sakte hain. Traders ko pattern ke limitations ko samajhna aur apni trading strategies ko adjust karna chahiye taake wo market trends aur price movements ko better manage kar sakein.

        Pattern ke limitations ke dauran risk management aur stop loss placement bhi important hota hai. Risk management strategy ke according, stop loss ko pattern ke failure ke case me loss ko limit karne ke liye set kiya jata hai. Traders ko pattern ke limitations ko accurately assess karna aur effective risk management strategy ko implement karna chahiye taake wo trading decisions ko accurately execute kar sakein.

        12. Cup aur Handle Pattern ki Analysis

        Cup aur Handle pattern ki analysis me historical data aur past performance ko consider karna zaroori hota hai. Historical patterns aur previous trends ke analysis se traders ko current pattern ke formation aur reliability ka insight mil sakta hai. Pattern ki analysis me price action, volume changes, aur market conditions ko closely monitor karna chahiye.

        Pattern ki analysis me traders ko price movements aur volume ke changes ko observe karna chahiye. Cup ke formation ke dauran price ka gradual recovery aur handle ke consolidation phase ko dekhna zaroori hota hai. Ye observations pattern ke reliability aur accuracy ko determine karne me madad karte hain. Traders ko pattern ke different stages aur phases ko analyze karna chahiye taake wo accurate trading decisions le sakein.

        Pattern ki analysis me market conditions aur external factors ko bhi consider karna zaroori hota hai. Economic indicators, news events, aur market sentiment pattern ke formation aur reliability ko affect kar sakte hain. Traders ko broader market context ko analyze karna chahiye taake wo pattern ke accuracy aur reliability ko better understand kar sakein.

        Pattern ke analysis ke dauran risk management aur stop loss placement bhi important hota hai. Risk management strategy ke according, stop loss ko pattern ke failure ke case me loss ko limit karne ke liye set kiya jata hai. Traders ko pattern ke analysis ko accurately perform karna chahiye taake wo effective trading decisions le sakein aur market trends ko manage kar sakein.

        13. Conclusion

        Cup aur Handle Chart Pattern ek reliable bullish signal hota hai jo traders ko market trends ko accurately predict karne me madad karta hai. Ye pattern ka formation, entry points, stop loss placement, target price calculation, aur pattern ke variations ko samajhna zaroori hota hai. Volume analysis aur pattern ki limitations ko consider karna bhi trading strategy ke effectiveness ko determine karne me madad karta hai.

        Cup aur Handle pattern ki analysis me historical data aur past performance ko consider karna zaroori hota hai. Traders ko price action, volume changes, aur market conditions ko closely monitor karna chahiye taake wo accurate trading decisions le sakein. Pattern ke different stages aur phases ko analyze karna aur risk management strategy ko implement karna bhi zaroori hota hai.

        Overall, Cup aur Handle Chart Pattern ek effective trading strategy hai jo market trends aur price movements ko accurately predict karne me madad karta hai. Traders ko pattern ke formation aur analysis ko carefully perform karna chahiye taake wo successful trading decisions le sakein aur profit potential ko maximize kar sakein.
        • #5 Collapse

          Cup aur handle chart pattern ek popular technical analysis tool hai jo traders aur investors use karte hain taake price movements ka analysis kar saken aur potential trading opportunities identify kar saken. Ye pattern aksar bullish market scenarios mein nazar aata hai, jahan asset ka price pehle decline hota hai, phir recover hota hai, aur uske baad ek short-term consolidation phase se guzarta hai. Is pattern ko samajhna aur sahi tareeke se identify karna stock market aur forex trading mein madadgar sabit ho sakta hai. Cup aur handle pattern ek chart formation hai jo resemble karta hai ek tea cup aur uski handle se. Is pattern ko 1960s mein William J. O'Neil ne popularize kiya, jo Investor's Business Daily ke founder hain. Cup ka portion ek "U" shape hota hai, jisme price pehle girta hai, phir neeche se support le kar upar jaata hai, aur handle ek consolidation phase ko represent karta hai jo breakout ke qareeb hota hai.


          Ye pattern aksar ek bullish continuation signal hota hai. Matlab ye hai ke agar koi security ya asset pehle se ek uptrend mein hai aur phir cup aur handle pattern form karta hai, to aksar iska result upward price movement hota hai. Lekin, sabhi cases mein ye bullish nahi hota, aur kaafi zyada analysis aur confirmation signals ki zaroorat hoti hai taake risk minimize kiya ja sake.

          Cup ka Structure
          Cup ka structure ek curved bottom se resemble karta hai, jise "U" shape kehte hain. Is curve ke neeche aane ka matlab hota hai ke market ya asset ka price ek downward trend ko follow kar raha hai. Ye decline aksar moderate aur gradual hota hai, lekin kabhi kabhi yeh steep bhi ho sakta hai. Cup ka ideal shape ek rounded bottom hota hai, jo ek healthy market correction ya consolidation phase ko represent karta hai.

          Cup ki key characteristics
          1. Depth of the Cup: Depth ya gehraayi cup ka ek ahem hissa hoti hai. Iska matlab hai ke price kitna neeche gira. Shuruwaat se le kar lowest point tak ka difference jitna gehra hoga, utna zyada price recover hone ke chances honge. Lekin, bohot zyada gehra cup ek bearish sign bhi ho sakta hai. Isliye traders ko is aspect par khayal rakhna chahiye.
          2. Duration of the Cup: Cup ka duration bhi important hai. Ek well-formed cup pattern ko banne mein kuch weeks ya months lagte hain. Jo cup jaldi form ho, wo aksar kam reliable hota hai kyunki market ko proper time nahi milta ke wo consolidate kar sake.
          3. Volume: Volume analysis bhi bohot zaroori hai jab cup aur handle pattern ko dekhte hain. Cup ke bottom mein volume aksar kam hoti hai, lekin jab price wapis recover hoti hai, to volume mein izafa hota hai. Ye confirm karta hai ke buyers market mein wapas aa rahe hain aur price ko higher levels tak push kar rahe hain.
          Handle ka Structure
          Jab cup ka formation complete ho jata hai aur price apne pehle high ke aas paas hota hai, us waqt ek consolidation phase start hoti hai jise "handle" kehte hain. Handle ka formation aksar ek flag ya pennant pattern ko resemble karta hai. Is phase mein price thoda neeche aata hai, lekin ye ek temporary move hota hai jo price ko future mein breakout karne ke liye tayar karta hai.

          Handle ki key characteristics
          1. Duration: Handle ka duration aksar cup se chhota hota hai. Handle sirf kuch dinon ya hafton mein form ho jata hai. Agar handle zyada lamba ho jaye, to wo market mein uncertain behavior ko dikhata hai.
          2. Depth of the Handle: Handle ki depth aksar shallow hoti hai, matlab price thoda neeche aata hai lekin zyada nahi. Handle ka ideal retracement level 10% se 15% hota hai.
          3. Volume: Handle formation ke dauran volume again decrease hoti hai. Lekin jab price breakout karta hai handle se, to volume mein significant izafa hona chahiye, jo breakout ko confirm karta hai.
          Bullish Breakout
          Jab cup aur handle pattern form ho jata hai, to next step hota hai breakout ka. Breakout ka matlab hai ke price handle ke resistance level ko cross kar ke higher levels tak chala jata hai. Ye aksar ek bullish move ko indicate karta hai, aur iska matlab hota hai ke trend continuation ke chances bohot zyada hain.

          Breakout ke waqt volume ka dekhna bohot important hota hai. Agar volume high hai breakout ke waqt, to ye ek confirmation signal hota hai ke breakout genuine hai. Agar volume low hai, to shayad breakout fail ho jaye aur price wapas consolidation ya decline phase mein chali jaye.

          How to Trade Cup aur Handle Pattern
          Cup aur handle pattern ko dekh kar sahi trade karna ek art hai. Yahan kuch important strategies hain jo aap follow kar sakte hain:
          1. Entry Point: Ideal entry point tab hota hai jab price handle ke resistance level ko break karta hai. Is waqt traders aksar buy karte hain, kyunki ye point bullish breakout ka indicator hota hai.
          2. Stop Loss Placement: Stop loss lagana bohot zaroori hota hai taake aap apne risk ko minimize kar saken. Ideal stop loss level handle ke neeche thoda gap par set kiya jaata hai. Agar price wapas neeche jata hai, to ye stop loss trigger hoga aur aapki trade loss se bach jaye gi.
          3. Target Price: Cup aur handle pattern ka target price aksar cup ke depth ke barabar hota hai. Agar cup ka depth 20 points hai, to breakout ke baad price move 20 points ka ho sakta hai.
          Cup aur Handle Pattern ke Limitations
          Jaise ke har technical analysis tool ke kuch limitations hote hain, waise hi cup aur handle pattern ke bhi kuch challenges hain:
          1. False Breakouts: Har breakout valid nahi hota. Bohot baar false breakouts hote hain jisme price breakout ke baad wapas neeche aata hai. Is liye volume ko dekhna aur other confirmation signals lena zaroori hota hai.
          2. Timeframe Issues: Yeh pattern har timeframe mein kaam nahi karta. Short-term charts par ye pattern less reliable hota hai kyunki small movements mein noise bohot zyada hoti hai. Is liye long-term charts par focus karna better hota hai.
          3. Subjectivity: Cup aur handle pattern ko dekhna kabhi kabhi subjective hota hai. Har trader alag tareeke se patterns ko interpret karta hai. Aapko practice aur experience se pattern ko identify karna seekhna padta hai.
          Cup aur Handle Pattern Variations
          Cup aur handle pattern ke kuch variations bhi hote hain jo alag market conditions mein form hote hain:
          1. Inverse Cup aur Handle: Inverse cup aur handle pattern ek bearish pattern hota hai jisme pehle price upar jaata hai, phir ek rounded top banata hai, aur uske baad ek handle formation hoti hai. Is pattern ka breakout neeche hota hai aur ye ek downtrend ka indicator hota hai.
          2. V-shaped Cup: Kabhi kabhi cup ka bottom bohot steep hota hai, jo ek "V" shape banata hai. Ye pattern less reliable hota hai kyunki isme market ko proper consolidation ka time nahi milta.
          Cup aur handle pattern ek powerful tool hai technical analysis mein, lekin isse sahi tareeke se interpret karna aur use karna practice aur understanding ki zaroorat hoti hai. Yeh pattern aksar bullish scenarios mein nazar aata hai aur traders ko trading opportunities identify karne mein madad karta hai. Lekin, ye zaroori hai ke aap is pattern ke limitations aur challenges ko samjhen aur doosre confirmation tools ke saath combine karke trade karein. Cup aur handle pattern ka success rate tabhi zyada hota hai jab aap iska sahi interpretation aur risk management strategy use karein.
          Believe in yourself and your abilities. When you fight for your dreams, you can achieve anything.
          • #6 Collapse

            **Cup aur Handle Chart Pattern kya hai?**
            Cup aur Handle chart pattern ek bullish continuation pattern hai jo price chart par ban kar market ke upward trend ke continue hone ka signal deta hai. Ye pattern do hisson par mabni hota hai: "Cup" aur "Handle". Is pattern ka structure ek deep rounding bottom jaisa hota hai (cup) aur uske baad ek chhoti consolidation phase aati hai jo handle ki shakal mein hoti hai. Ye pattern aksar long-term bullish markets mein banta hai aur iske baad price mein ek breakout hota hai.

            **Key Points:**

            1. **Cup ka Structure**:
            - Cup ka shape ek round bottom jaisa hota hai jo price ke gradual decline aur phir recovery ko dikhata hai.
            - Is pattern mein price pehle downtrend mein jati hai, lekin dheere dheere wapas upar aakar apne previous high ko touch karti hai, jis se cup ka formation complete hota hai.
            - Cup ka bottom smooth aur round hota hai, jisme market bohot steady aur slow tarike se bottom se recover karti hai.

            2. **Handle ka Formation**:
            - Jab cup ka formation complete hota hai, to uske baad price mein thodi consolidation hoti hai jo handle ki shakal mein hoti hai.
            - Handle mein price sideways ya slightly downward move karti hai, lekin yeh move bohot chhota aur temporary hota hai.
            - Is phase ke baad, market breakout ke liye tayar hoti hai, jo pattern ke bullish nature ko confirm karta hai.

            3. **Breakout ka Signal**:
            - Handle ke consolidation ke baad jab price handle ki upper resistance line ko break karti hai, to isko breakout kaha jata hai.
            - Breakout bullish signal hota hai aur ye indicate karta hai ke price ab upar ki taraf significant move karne wali hai.
            - Strong breakout ka matlab hota hai ke buyers market mein control le rahe hain aur price further bullish trend mein move karegi.

            4. **Bullish Continuation Pattern**:
            - Cup aur Handle ek bullish continuation pattern hota hai, yaani ye pehle se chalti bullish trend ke continue hone ka signal deta hai.
            - Ye pattern aksar market ke long-term uptrend mein banta hai, jab price temporarily consolidation ke baad nayi highs ki taraf move karti hai.

            5. **Volume ka Asar**:
            - Cup aur Handle pattern mein volume ka bhi bohot important role hota hai. Cup ke formation ke doran volume gradually decrease hoti hai, lekin jab handle ke baad breakout hota hai, to volume mein sharp increase aata hai.
            - Volume ka increase breakout ke valid hone ko confirm karta hai aur signal deta hai ke market mein buyers ki strength zyada hai.

            6. **Traders ke Liye Faida**:
            - Cup aur Handle pattern ko dekh kar traders apne entry aur exit points identify kar sakte hain.
            - Jab handle ka breakout hota hai, to yeh ek acha entry point hota hai, kyun ke iske baad price mein upward movement expected hoti hai.
            - Is pattern ka use swing traders aur long-term investors karte hain, jo bullish market trends ko capitalize karna chahte hain.

            Cup aur Handle chart pattern ek reliable aur effective bullish continuation pattern hai jo price mein long-term upward movement ko signal deta hai. Is pattern ka sahi analysis aur breakout ke time par entry traders ke liye profitable ho sakti hai.
            • #7 Collapse

              ### Cup aur Handle Chart Patterns
              **1. Muqaddima**

              Cup aur handle chart pattern ek popular technical analysis pattern hai jo traders aur investors ke liye important signal provide karta hai. Is pattern ka structure kuch aisa hota hai ke ye ek cup aur phir uske upar ek handle ki tarah nazar aata hai. Yeh pattern aksar bullish trend ke liye istemal hota hai, aur iska istemal long-term trading strategies mein kiya jata hai.

              **2. Cup ka Takhleeq**

              Cup ka hissa aksar do distinct phases mein divided hota hai. Pehla phase hota hai jab price ek downtrend mein chali jati hai, jo ke cup ki left side banata hai. Iske baad price thodi der ke liye stabilize hoti hai, aur phir upar ki taraf nikalti hai, jo cup ki right side banati hai. Yeh complete hone par ek rounded shape banata hai, jo is pattern ki pehchaan hai.

              **3. Handle ka Takhleeq**

              Handle ka hissa cup ke upar ki taraf hota hai. Yeh typically chhoti price corrections ya consolidation hoti hai. Handle ka formation chaar se das dino tak ho sakta hai. Is doraan, price thodi der ke liye niche aati hai, jo handle ki shape ko tayyar karta hai. Handle ka istemal breakout ka indicator hota hai, jo bullish trend ki taraf ishara karta hai.

              **4. Pattern ki Pehchaan**

              Cup aur handle pattern ko pehchanne ke liye kuch key features hain. Cup ka shape rounded hona chahiye, aur iski depth 30% se zyada nahi honi chahiye. Handle ki formation kaafi choti aur narrow honi chahiye, aur iski depth bhi 15% tak honi chahiye. Is pattern ka sabse important hissa breakout hai, jo handle ke upper boundary se hota hai.

              **5. Volume ka Role**

              Is pattern ki trading mein volume ka bohot bada role hota hai. Cup ke formation ke doran volume gradual decrease hona chahiye, jabke handle ke doraan volume bhi kam hona chahiye. Lekin jab price breakout hota hai, tab volume mein sharp increase dekhne ko milta hai. Yeh volume ki increase confirmation deta hai ke trend bullish hai.

              **6. Entry Point ki Strategy**

              Cup aur handle pattern ke breakout ke baad entry point kaafi crucial hota hai. Traders aksar handle ki upper boundary par entry karte hain, jab price is boundary ko cross karti hai. Is point par volume ki increase aur bullish sentiment confirmation ke liye dekha jata hai. Yeh point wo hai jab traders ko lagta hai ke price aage badhne wala hai.

              **7. Stop Loss Placement**

              Stop loss placement is strategy ka ek aur important hissa hai. Traders aksar apne stop loss ko handle ke niche rakhte hain, taake agar price wapas niche aaye toh unka loss control mein rahe. Yeh stop loss placement ek risk management strategy hai jo traders ko unnecessary losses se bachati hai.

              **8. Target Price ka Takhleeq**

              Cup aur handle pattern ke target price ko calculate karne ka ek simple tareeqa hota hai. Traders aksar cup ki maximum height ko handle ke breakout price se jodte hain. Is tareeqe se unhe expected target price milta hai. Yeh target price traders ko entry aur exit decisions lene mein madad karta hai.

              **9. Time Frame ki Ahmiyat**

              Cup aur handle pattern ko identify karte waqt time frame ka bhi bohot ahmiyat hota hai. Yeh pattern chhote aur bade time frames dono par banta hai. Lekin, long-term charts par is pattern ki reliability zyada hoti hai. Is wajah se traders aksar daily ya weekly charts par is pattern ko dekhte hain.

              **10. Common Mistakes**

              Traders aksar kuch common mistakes karte hain jab wo cup aur handle pattern ko istemal karte hain. In mistakes mein false breakouts aur handle ki incorrect formation shamil hain. Yeh mistakes traders ko loss ka shikaar bana sakti hain. Isliye, traders ko in mistakes se bachne ke liye pattern ki proper identification aur volume analysis par focus karna chahiye.

              **11. Other Indicators ka Istemal**

              Cup aur handle pattern ko trade karte waqt, traders aksar dusre technical indicators ka bhi istemal karte hain. Moving averages, RSI (Relative Strength Index), aur MACD (Moving Average Convergence Divergence) jaise indicators ka istemal kiya jata hai. Yeh indicators traders ko confirmation dete hain aur entry aur exit points ko enhance karte hain.

              **12. Market Sentiment ka Asar**

              Cup aur handle pattern ke successful formation ke liye market sentiment ka bhi asar hota hai. Jab market bullish sentiment mein hota hai, to is pattern ke formation ki chances zyada hote hain. Is wajah se traders ko market ki overall sentiment ko samajhna chahiye taake wo better trading decisions le sakein.

              **13. Practice aur Experience**

              Cup aur handle pattern ko effectively trade karne ke liye practice aur experience zaroori hai. Traders ko is pattern ki identification aur trading strategies ko samajhne ke liye real market scenarios ka analysis karna chahiye. Isse unki skills improve hoti hain aur wo zyada confident hote hain.

              **14. Nateeja**

              Cup aur handle chart pattern ek powerful trading tool hai jo traders ko bullish market trends ko identify karne mein madad karta hai. Is pattern ki proper identification, volume analysis, aur market sentiment ka samajhna zaroori hai. Traders ko is pattern ko samajhne ke liye practice aur patience ki zaroorat hai, taake wo isse effectively trade kar sakein. Is tarah se, cup aur handle pattern ko apne trading arsenal mein shamil karna aapke profits ko enhance kar sakta hai.
              • #8 Collapse

                Cup aur Handle Chart Patterns

                Taaruf


                Cup aur handle chart pattern aik mashhoor technical analysis ka tool hai jo stock aur cryptocurrency markets mein istemal hota hai. Yeh pattern price movements ko samajhne aur market trends ko pehchanne mein madadgar hota hai. Is maqale mein hum cup aur handle pattern ke maqsad, banawat, aur iski trading strategies par nazar dalenge.
                Cup aur Handle Kya Hai?


                Cup aur handle pattern do hisson par mushtamil hota hai: cup aur handle. Cup aksar ek "U" shakal mein hota hai, jabke handle choti aur zyada horizontal hoti hai. Is pattern ka dekhna aur samajhna trading ke liye bohot ahmiyat rakhta hai.
                Cup Ki Banawat


                Cup ka hissa price ke gradual decline se shuru hota hai, jo baad mein phir se upar ki taraf badhta hai. Is phase ko consolidation bhi kaha jata hai. Cup ki shape ek smoothly curved line ki tarah hoti hai, jo market ke bullish hone ka izhar karti hai.
                Handle Ki Banawat


                Handle pattern cup ke upar banata hai, jo thoda sa downward trend ya sideways movement hota hai. Yeh handle ka hissa aam tor par short-term profit-taking ya consolidation ka nishan hota hai, jo traders ko entry point dhoondhne mein madad karta hai.
                Cup aur Handle Ka Nisaab


                Is pattern ki pehchan karne ke liye kuch maqsadi shiraatein hain. Cup ki depth 30% se 50% tak honi chahiye, aur handle ka hissa 10% se 15% tak ho sakta hai. Yeh measurements ek acha cup aur handle pattern banane mein madadgar hote hain.
                Chart Patterns ki Importance


                Cup aur handle pattern ko samajhne se traders ko market trends ka andaza lagane mein madad milti hai. Yeh pattern bullish market ka izhar karta hai, aur traders ko entry aur exit points ki pehchan karne ka moka deta hai.
                Trading Strategy


                Is pattern ka istemal karte waqt kuch trading strategies ka khayal rakhna chahiye. Entry point cup ke upper resistance level par hota hai, jab price handle se bahar nikalti hai. Yahan se trader ko apna stop-loss set karna chahiye.
                Stop-Loss Aur Target Setting


                Stop-loss set karna ek zaroori strategy hai. Yeh handle ke neeche 1-2% ke as-pass hona chahiye. Is se trader ko loss se bachne ka moka milta hai. Target setting cup ki height ko handle ke breakout se jod kar ki jati hai.
                Volume ka Role


                Cup aur handle pattern ke dauran volume bhi bohot ahmiyat rakhta hai. Cup ke dauran volume kam hota hai, lekin handle ke breakout ke waqt volume ka izafa zaroori hai. Yeh bullish trend ka nishan hota hai.
                Fake Breakouts


                Market mein kabhi kabhi fake breakouts bhi hotay hain. Yeh woh situations hain jahan price temporarily resistance ko break karti hai lekin phir wapas niche aa jati hai. Is liye traders ko confirmation signals ka intezar karna chahiye.
                Psychological Aspects


                Cup aur handle pattern ka psychological aspect bhi hai. Traders ka dhyan is pattern par hota hai, jo unhe bullish trend ka izhar karne mein madad karta hai. Jab zyada log is pattern ko pehchan lete hain, to price mein izafa hone ki umeed hoti hai.
                Cup aur Handle ke Advantages


                Cup aur handle pattern ka istemal karne ke kai faide hain. Yeh pattern traders ko clear entry aur exit points deta hai. Iske ilawa, yeh long-term trends ko samajhne ka bhi mauqa deta hai.
                Limitations


                Har pattern ki tarah, cup aur handle pattern bhi kuch limitations rakhta hai. Yeh hamesha reliable nahi hota, aur kabhi kabhi market ki volatility is pattern ko disrupt kar sakti hai. Is liye traders ko hamesha market conditions ka khayal rakhna chahiye.
                Nishkarsh


                Cup aur handle pattern aik powerful tool hai jo traders ko market trends ko samajhne aur trade karne mein madadgar hota hai. Is pattern ko samajhna aur istemal karna, traders ko zyada informed decisions lene mein madad de sakta hai. Lekin, is pattern ke sath sath market ke other indicators ka bhi khayal rakhna zaroori hai taake profitable trades ki jayein.
                Aakhri Batain


                Aakhir mein, cup aur handle chart pattern ko samajhne se traders ko apni trading strategies ko behtar banane ka moka milta hai. Yeh pattern ek strong bullish signal ka izhar karta hai aur sahi time par entry karne se traders ko faida ho sakta hai. Har trader ko chahiye ke wo is pattern ko apni trading toolkit mein shamil karein aur iske sath sath risk management ka bhi khayal rakhein.
                • <a href="https://www.instaforex.org/ru/?x=ruforum">InstaForex</a>
                • #9 Collapse

                  Cup aur Handle Chart Pattern: Ek Mukammal Rahnumai

                  Cup aur Handle chart pattern aik mashhoor technical analysis ka tool hai jo traders aur investors ke liye khud bhi kaafi zaroori hota hai jab woh market trends aur price movements ko samajhne ki koshish karte hain. Is pattern ka naam uske shakal ke mutabiq rakha gaya hai jo bilkul ek cup (pyala) aur handle (dasta) ki terhan lagti hai. Yah pattern aksar bullish markets mein dekhne ko milta hai aur yeh is baat ka ishara deta hai ke price ek break-out ke liye tayar hai. Is article mein hum Cup aur Handle pattern ko tafseel se samjhaingay, ke yeh kis tarhan kaam karta hai aur kis tarhan se isko trade kar sakte hain.
                  1. Cup aur Handle Kya Hai?


                  Cup aur Handle ek bullish continuation pattern hai jo aam tor par stock aur commodity markets mein paaya jata hai. Jab market mein aik lambi downtrend ke baad price bottom tak aa jati hai, to phir yeh wapis upar jaane ka aghaz karti hai jo ek cup banaati hai. Iske baad, ek chhota sa consolidation phase hota hai jo handle kehlata hai. Yeh pattern price ke aglay rise ka signal hota hai.
                  2. Cup Ka Shape


                  Is pattern mein cup ki shakal ghair mutma’een hoti hai, yaani yeh deep ya shallow ho sakti hai. Ideal cup ki shape ek rounded bottom hoti hai, jo market mein gradual buying aur selling pressure ko zahir karti hai. Agar yeh cup bilkul 'V' shape mein ho, to iska matlab yeh hai ke market mein sudden price changes huay hain, jo is pattern ki reliability ko kam kar dete hain.
                  3. Handle Ka Structure


                  Handle, cup ke baad ek chhoti si consolidation hoti hai. Yeh handle aksar sideways ya slightly downward hoti hai, jo buyers aur sellers ke darmiyan aik short-term resistance ko zahir karti hai. Jab yeh consolidation period khatam hota hai, to price aksar ek upward move karti hai jo ke is pattern ke completion ka signal hota hai.
                  4. Breakout Ka Signal


                  Cup aur Handle pattern ka asal signal us waqt milta hai jab price handle ke baad breakout karti hai. Yeh breakout aksar strong buying pressure ke sath hota hai, jo market mein ek nayi bullish trend ko zahir karta hai. Traders is waqt mein buy signal ko dekhte hain aur market mein apni positions banate hain.
                  5. Cup aur Handle Ka Timeframe


                  Yeh pattern aksar daily ya weekly charts mein dekha jata hai, lekin kisi bhi timeframe par bana sakta hai. Is pattern ka timeframe kaafi varying hota hai, lekin aksar 1 se 6 mahine ka period iske liye ideal samjha jata hai. Shorter timeframes mein yeh pattern utna strong nahi hota, lekin lambe timeframes par iski reliability barh jati hai.
                  6. Volume Ka Kirdar


                  Volume ka analysis is pattern ko samajhne mein bohat zaroori hota hai. Cup ke dauran, volume kam hota hai lekin jaise jaise price rise hoti hai, volume barh jata hai. Handle ke dauran bhi volume relatively kam hota hai, lekin jab breakout hota hai to volume mein dramatic increase dekha jata hai, jo ke strong signal hota hai ke trend change ho rahi hai.
                  7. Cup aur Handle Pattern Mein Ghaltiyan


                  Aksar traders ko Cup aur Handle pattern ko samajhne mein ghalti hoti hai, kyunki har curve ya consolidation period is pattern ki nishani nahi hoti. Fake breakouts aur galat analysis aksar trading losses ka sabab ban sakte hain. Is liye, doosray technical indicators ke sath is pattern ko combine karna zaroori hota hai.
                  8. Cup aur Handle Ka Asal Istemaal


                  Cup aur Handle ka asal istemaal long-term trades mein hota hai, kyunki yeh aksar market ke lambi duration ke trends ko indicate karta hai. Is pattern ko identify karna aur sahi waqt par entry lena bohat zaroori hota hai taake investor zyada se zyada profit hasil kar sake.
                  9. Entry Points


                  Cup aur Handle pattern ke tamam hisson ko samajhne ke baad, aik trader ke liye entry ka sahi point identify karna bohat ahem hota hai. Aksar traders handle ke consolidation ke baad breakout ke waqt apni position kholte hain. Is waqt price increase ka potential hota hai, jo ke profitable trade ban sakta hai.
                  10. Stop Loss Aur Risk Management


                  Jab bhi Cup aur Handle pattern ko trade kiya jata hai, to risk management ka khayal bohat zaroori hota hai. Is pattern mein ideal stop-loss point handle ke bottom ke pass hota hai, jahan se agar price wapis neeche aaye to yeh signal ho sakta hai ke breakout false tha.
                  11. Target Ka Tayiun


                  Cup aur Handle pattern mein price ka target aksar handle ke breakout ke baad cup ke depth ke barabar hota hai. Yaani agar cup 10 points deep tha, to handle ke breakout ke baad price mein 10 points ka further increase expect kiya jata hai.
                  12. Market Conditions


                  Yeh pattern tabhi zyada successful hota hai jab overall market bullish ho. Agar market bearish trend mein ho, to yeh pattern utna effective nahi hota. Iss liye, market ki overall direction ko samajhna zaroori hota hai jab yeh pattern trade kiya jata hai.
                  13. Cup aur Handle Pattern Ka Application


                  Is pattern ko sirf stocks mein nahi, balke commodities aur forex markets mein bhi istemal kiya jata hai. Yeh har jagah kaam kar sakta hai jahaan demand aur supply ka farq hota hai aur price action ko samjha jata hai.
                  14. Technical Indicators Ka Istemaal


                  Cup aur Handle pattern ko zyada effectively trade karne ke liye technical indicators jaise ke Moving Averages, Relative Strength Index (RSI), aur Fibonacci Retracement ko bhi dekhna chahiye. Yeh indicators traders ko aur zyada confidence detay hain jab woh is pattern ke signal ko follow karte hain.
                  Khulasah


                  Cup aur Handle pattern aik strong bullish continuation pattern hai jo market mein trend reversal ko identify karne mein madadgar hota hai. Yeh pattern kaafi reliable hota hai, lekin isko sahi tarike se samajhna aur doosray technical analysis tools ke sath combine karna zaroori hai. Jab sahi waqt par entry li jaye aur risk management ka khayal rakha jaye, to yeh pattern kaafi profitable trading opportunities provide kar sakta hai.

                  اب آن لائن

                  Working...
                  X