Three Black Crows Candlestick Pattern
X
  • وقت
  • دکھائیں
Clear All
new posts
  • #1 Collapse

    Three Black Crows Candlestick Pattern


    Taaruf


    Three Black Crows candlestick pattern ek bearish reversal pattern hai jo aksar market ki bullish trend ke baad dekha jata hai. Ye pattern teen consecutive black (ya red) candlesticks par mashoor hai, jo ke market ki tension aur investors ke bearish jazbat ka izhar karti hai. Is pattern ka samajhna trade ke liye bohot zaroori hai, khaas kar un logo kay liye jo technical analysis main maharat rakhte hain.
    Pattern ki Pehchaan


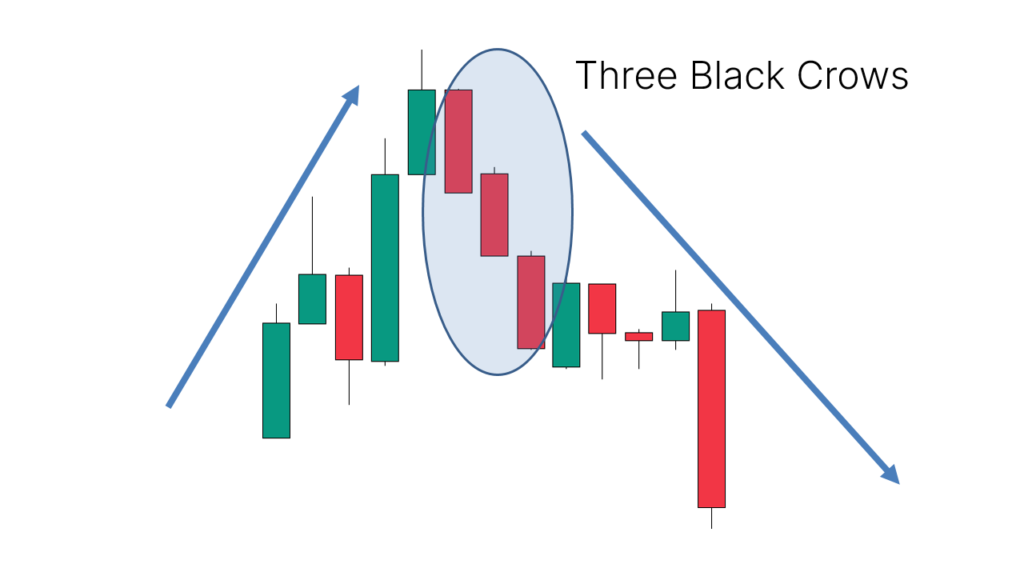
    Three Black Crows pattern ki pehchaan us waqt ki jaati hai jab teen consecutive candlesticks market ke niche ki taraf band hoti hain, aur har ek candlestick pichli candlestick ki closing se neeche band hoti hai. Har candlestick ka body bada aur shadow chhota hota hai, jo market ki selling pressure ko dikhata hai.
    Candlestick ki Takhleeq
    1. Pehli Candlestick: Ye bullish trend ka last candlestick hota hai jo ke market ki taqat ko bayan karta hai.
    2. Dusi Candlestick: Ye pehli candlestick se neeche banta hai aur bearish closing dikhata hai.
    3. Teesri Candlestick: Ye dusri candlestick se bhi neeche band hota hai, jo ke continuation ko darshata hai.
    Fawaid

    1. Behtar Trading Signals


    Three Black Crows pattern traders ko behtar signals faraham karti hai ke market bearish ho raha hai. Ye pattern jab dekha jata hai to ye logon ko ye jaag rahi hoti hai ke wo apne positions ko manage karein ya profit booking karein.
    2. Kharidari Ka Fursat


    Jab ye pattern achey tarikon se confirm ho jata hai, toh traders ko short selling ya derivatives trading mein fursat mil sakti hai. Is se wo market ke girne ka faida uthate hain.
    3. Portfolio Management


    Ye pattern portfolio management mein madadgar hoti hai. Agar koi trader bullish positions rakhta hai, toh ye pattern unhain is taraf ishara karta hai ke wo apne investment ko manage karein aur market ke bearish trend ka faida uthayen.
    Nuqsan

    1. Fake Signals


    Kabhi kabar, ye pattern fake signals bhi de sakta hai. Agar market ki volatility zyada ho toh ye logo ko galat faislay tak le ja sakta hai. Isliye, always confirm this pattern with other indicators.
    2. Trade Timing ka Masla


    Is pattern ko samajhne ke liye accents bohot zaroori hain. Kabhi kabhi traders samaj nahi pate ke kab trade lena hai aur kab nahi, jo unhein ghalat entry ya exit points tak le ja sakta hai.
    3. Overconfidence


    Doosre traders ke liye, is pattern ka analysis karne par overconfidence aa jata hai, jo trading decisions ko affect karta hai. Wo samajhte hain ke wo hamesha is pattern se faida uthayenge, jo ek galat fehmi hoti hai.
    Analysis Aur Examples

    Example 1: Aksar Ka Tajarba


    Maanlein ke aapne market ko observe kiya hai aur ye pattern dekha. Ab aap is pattern ko samajh kar apne trading decisions ko badal sakte hain. Agar ye pattern aata hai, toh aap short selling ke liye entry kar sakte hain.
    Example 2: Indicator ke Sath


    Achi trading practice ye hai ke ye pattern ko kisi aur indicator, jaise moving averages ya RSI, ke sath istemal karein. Agar aap dekhte hain ke Three Black Crows pattern ke sath RSI bhi overbought hai, toh ye aur bhi zyada confirm hota hai ke market gir sakta hai.
    Real-life Example


    Bohot se traders ne 2020 ke financial crisis ke doran ye pattern dekha, jis se unhon ne behtar decisions liye aur losses ko avoid kiya. Ye pattern na sirf stocks, balki forex aur commodities mein bhi dekha gaya hai.
    Strategies for Entry and Exit

    Entry Strategy
    • Confirmation: Ye zaroori hai ke aap is pattern ka confirmation dekhein. Jaise hi teesri candlestick close hoti hai, agar volume high hai toh ye trade lene ke liye acha sahara hai.
    • Stop Loss: Kabhi kabar stop loss ko hamesha apne entry point se thoda upar rakhein, taake market agar wapas upar chala jaye toh aap ka loss limited rahe.
    Exit Strategy
    • Profit Booking: Agar aapne short position li hui hai aur market gir raha hai, toh profit booking ka time zaroori hota hai. Aksar traders is pattern ke baad profit lete hain jab market me choti rally hoti hai.
    • Trailing Stop Loss: Ye ek acha method hai jisse aap profit ko lock kar sakte hain. Agar market aapke favor mein ja raha hai, toh stop loss ko market price ke sath adjust karein.
    Conclusion


    Three Black Crows candlestick pattern ek helpful tool hai jo traders ko market ke bearish trend ke baare mein agah karta hai. Is pattern ka samajhna aur better trading strategies ko banana aapki trading success ko doom kar sakta hai. Lekin, ye bhi zaroori hai ke aap sahi confirmation aur risk management strategies ka istemal karein.

    Kya aap is pattern ke zariye trading mein maharat hasil karne ke liye tayyar hain? Ye pattern aapko markets mein best decisions lene mein madadgar ho sakta hai, lekin hamesha caution ke sath trading karein.
  • <a href="https://www.instaforex.org/ru/?x=ruforum">InstaForex</a>
  • #2 Collapse

    Three Black Crows candlestick pattern aik bearish reversal pattern hai jo aksar bullish trend ke baad aata hai. Yeh pattern tab banta hai jab teen lagataar bearish candles (kaali candles) banti hain, jo trend reversal ka ishara deti hain. Har candle pehle candle ke closing price se niche khulti hai aur din ke end mein apni opening price se bhi niche band hoti hai. Yeh pattern traders ko batata hai ke ab buying ka trend khatam ho gaya hai aur market mein bearish trend shuru ho gaya hai.

    Pattern ki Pehchan


    Teen kaale kawwe pattern ko pehchan-ne ke liye, hamein teen consecutive bearish candles dekhnay hoti hain. Har candle pehle candle ke closing price se thoda niche khulti hai. Pehli candle bullish trend ke baad aati hai, doosri candle pehli candle ke body ke andar khulti hai lekin pehle candle se niche band hoti hai, aur teesri candle bhi isi tarah behave karti hai. Yeh candles usually lambi hoti hain aur unki shadow choti hoti hai, jo strong selling pressure ka ishara karti hain.


    Trading Strategy


    Three Black Crows pattern ka signal milne ke baad traders aksar apni long positions close karte hain aur new short positions open karte hain. Trading strategy mein, jab yeh pattern identify hota hai to trader apni position ko bearish banane ke liye short sell karta hai. Stop loss ko pehli candle ke top pe rakhna chahiye, taake risk manage ho sake. Target price ke liye trader support level ya moving averages ka istimaal kar sakte hain. Agar market strong support level ko tod deta hai, to yeh further downside ka signal de sakta hai.Risk management trading ka aik aham hissa hai, khas tor par jab Three Black Crows jaise bearish patterns identify hote hain. Stop loss orders zaroori hain taake unexpected market movements se bacha ja sake.

    Click image for larger version

Name:	images - 2024-08-07T184652.359.png
Views:	31
Size:	12.6 کلوبائٹ
ID:	13075845


    Is pattern ka follow-up karte waqt, trading volume ko bhi dekhna chahiye. Agar volume zyada hai to pattern ka signal zyada reliable hota hai. Trader ko apna portfolio diversify karna chahiye aur ek trade pe zyada depend nahi karna chahiye, taake risk ko spread kiya ja sake.
    Misinterpretation se Bachna


    Dear traders aap kay knowledge main izafah karta chaloon k Three Black Crows pattern kabhi kabar false signals bhi de sakta hai, isliye isay aur bhi technical indicators ke sath combine karna chahiye, jaise ke RSI (Relative Strength Index) ya MACD (Moving Average Convergence Divergence). Yeh indicators confirm karte hain ke market truly bearish hai ya nahi. Agar sirf Three Black Crows pe rely karenge, to kabhi kabar market ka small pullback bhi is pattern ki tarah lag sakta hai. Isliye trading decision lene se pehle comprehensive analysis karna zaroori hai.

    Dear friends aap ko btata chaloon kay is tarha say Three Black Crows pattern ko samajhna aur usay effectively use karna trading mein successful hone ke liye zaroori hai. Proper analysis aur risk management ke sath, yeh pattern trading ke faislay lene mein madadgar ho sakta
    • #3 Collapse

      ### Three Black Crows Candlestick Pattern
      Three Black Crows Candlestick Pattern ek bearish reversal pattern hai jo technical analysis mein market ke downtrend ka signal dene ke liye use hota hai. Yeh pattern market ki strength aur trend direction ko indicate karta hai aur typically uptrend ke baad banta hai. Is post mein hum Three Black Crows pattern ki formation, characteristics, aur trading strategies ko detail mein discuss karenge.

      **Three Black Crows Pattern Ki Definition:**

      Three Black Crows pattern teen consecutive black (bearish) candlesticks par مشتمل hota hai jo ek clear bearish reversal signal provide karta hai. Yeh pattern market ke previous uptrend ke baad banta hai aur downtrend ki shuruat ka indication hota hai.

      **Pattern Ki Formation:**

      1. **Candlestick Characteristics:**
      - **First Candlestick:** Pehli candlestick strong bearish hoti hai aur ek long black body ke saath close hoti hai. Yeh candlestick previous uptrend ko khatam karti hai.
      - **Second Candlestick:** Dusri candlestick bhi bearish hoti hai aur pehli candlestick ke close se lower close hoti hai. Yeh candlestick pehli candlestick ke close ke neeche open hoti hai aur body bhi long hoti hai.
      - **Third Candlestick:** Teesri candlestick bhi bearish hoti hai aur second candlestick ke close se lower close hoti hai. Yeh candlestick dusri candlestick ke close ke neeche open hoti hai aur body bhi long hoti hai.

      2. **Pattern Characteristics:**
      - **Consistent Bearish Bodies:** Teenon candlesticks ka body long aur bearish hota hai, jo market ke strong selling pressure ko indicate karta hai.
      - **No Upper Shadows:** Ideal Three Black Crows pattern mein, candlesticks ke upper shadows chhote ya absent hote hain, jo market ke strong downward momentum ko show karta hai.

      **Trading Strategies:**

      1. **Entry Points:**
      - **Sell Signal:** Three Black Crows pattern ke formation ke baad, traders bearish positions open kar sakte hain. Yeh pattern ke completion ke baad market ke further downtrend ko signal karta hai.
      - **Confirmation:** Entry signal ko additional technical indicators jaise RSI, MACD, ya Moving Averages ke saath confirm karna zaroori hai. Yeh indicators market ke bearish momentum ko confirm karte hain.

      2. **Stop Loss Aur Take Profit:**
      - **Stop Loss:** Stop loss levels ko pattern ke upper boundary ke around set kiya jata hai. Yeh unexpected price reversals se protect karta hai aur losses ko limit karta hai.
      - **Take Profit:** Take profit targets ko recent support levels ke around set kiya jata hai. Traders apne profit targets ko pattern ke expected price movements ke hisaab se define kar sakte hain.

      **Key Considerations:**

      1. **Trend Confirmation:**
      - **Previous Uptrend:** Three Black Crows pattern ki effectiveness tabhi hoti hai jab yeh ek strong uptrend ke baad banta hai. Market ka previous trend bearish reversal ke signal ko strong banaata hai.

      2. **Volume Analysis:**
      - **High Volume:** Pattern ke formation ke dauran high trading volume market ke bearish signal ko reinforce karta hai. Volume analysis se pattern ki validity ko confirm kiya ja sakta hai.

      **Conclusion:**

      Three Black Crows Candlestick Pattern ek effective bearish reversal signal hai jo market ke strong downtrend ko indicate karta hai. Pattern ki accurate formation aur candlestick characteristics ko samajh kar, traders market ke bearish opportunities ko efficiently capitalize kar sakte hain. Effective entry aur exit strategies aur risk management ke saath, Three Black Crows pattern trading results ko significantly enhance kar sakta hai.
      • #4 Collapse

        **Three Black Crows Candlestick Pattern**

        Forex trading aur stock market analysis mein candlestick patterns ka bohot bara role hota hai. Ye patterns traders ko market ke movements aur possible trends ka idea dete hain. Aaj hum ek ahem candlestick pattern "Three Black Crows" ke bare mein baat karein ge. Ye pattern trading community mein bearish trend ke indication ke liye mashhoor hai.

        ### Three Black Crows Pattern kya hai?

        Three Black Crows ek bearish candlestick pattern hai jo ke typically ek uptrend ke baad form hota hai. Is pattern mein teen consecutive bearish candles hoti hain jo ke steadily neeche ki taraf move karti hain. Iska matlab ye hai ke market mein selling pressure barh raha hai aur buyers ka control khatam ho raha hai.

        Ye pattern is wajah se "Three Black Crows" kehlata hai kyun ke ye teeno candles red ya black hote hain (traditional chart colors) jo ke ek ke baad ek neeche ki taraf decline ko represent karte hain.

        ### Pattern ka Structure

        1. **Pehli Candle:** Ye candle peechle uptrend ke baad form hoti hai aur ek clear bearish move ko initiate karti hai. Ye candle apne high se neeche close hoti hai, jo ke selling pressure ko indicate karti hai.

        2. **Dusri Candle:** Ye candle bhi bearish hoti hai aur pehli candle ke close ke neechay open hoti hai. Dusri candle pehli candle ki range ke andar reh kar close hoti hai, jo ke confirmation deti hai ke market mein selling pressure zyada hai.

        3. **Teesri Candle:** Teesri candle bhi bearish hoti hai aur dusri candle ke close ke neeche open hoti hai. Ye candle lower lows aur lower closes bana kar complete pattern ko confirm karti hai.

        ### Pattern ka Significance

        Three Black Crows pattern indicate karta hai ke market trend reversal hone wala hai. Is pattern ko dekh kar traders apne long positions ko liquidate karte hain aur short selling ki taraf dekhte hain. Ye pattern typically ek overbought market ya bullish trend ke end par form hota hai.

        ### Trading Strategy

        Three Black Crows ko dekh kar trading decision lena critical ho sakta hai. Agar aap is pattern ko identify karte hain, toh aapko confirmatory indicators ko bhi dekhna chahiye, jese ke volume analysis, RSI (Relative Strength Index), aur moving averages. Ye indicators aapko trend ke strength aur continuation ka idea denge.

        1. **Entry Point:** Teesri candle ke close ke baad aap short position le sakte hain.

        2. **Stop Loss:** Apna stop loss teesri candle ke high par lagayein.

        3. **Take Profit:** Profit target set karte waqt support levels aur risk-to-reward ratio ko mad-e-nazar rakhein.

        ### Conclusion

        Three Black Crows candlestick pattern ek powerful bearish indicator hai jo market ki trend reversal ko indicate karta hai. Is pattern ko samajhna aur use karna trading success ke liye ahem ho sakta hai. Lekin, hamesha yaad rakhein ke kisi bhi trading strategy mein risk management aur confirmatory indicators ka use lazmi hai. Trading mein patience aur discipline hi aapko consistent profits dilwa sakte hain.
        • #5 Collapse

          Three Black Crows Candlestick Pattern

          Three Black Crows Pattern Ka Taaruf

          Three Black Crows ek candlestick pattern hai jo market ki downward trend ko indicate karta hai. Ye pattern teen consecutive bearish candlesticks par مشتمل hota hai, jo market mein bearish sentiment ka izhar karti hai. Har ek candlestick ke close price pichle candlestick ke close price se kam hoti hai, aur is pattern ki formation se traders ko market mein girawat ka signal milta hai.

          Pattern Ki Pehchaan

          Three Black Crows pattern ko pehchanne ke liye, aapko teen consecutive red candlesticks ki zaroorat hoti hai. Har candlestick ka body bara hona chahiye aur shadow (wick) chhoti honi chahiye. In teen candlesticks ka close price pehle se kam hote jana chahiye, jo pattern ko complete karta hai. Ye pattern zyada tar downtrends ke dauran banata hai aur iska formation market mein bearish trend ke majboot hone ka izhar karta hai.

          Pattern Ki Formation

          Three Black Crows ka pattern tab banta hai jab market ek uptrend ke baad transition hota hai. Pehli candlestick strong bearish close ke saath finish hoti hai, jo ki market mein girawat ke start ko dikhata hai. Dusri candlestick bhi bearish hoti hai aur pehli candlestick ke close price ke neeche close hoti hai. Teesri candlestick bhi bearish hoti hai aur dusri candlestick ke close price ke neeche finish hoti hai. Is tarah se, pattern complete hota hai aur market mein bearish sentiment ko confirm karta hai.

          Pattern Ki Significance

          Three Black Crows pattern ko samajhna aur identify karna traders ke liye zaroori hai, kyunke ye ek strong bearish signal provide karta hai. Is pattern ke banne ke baad market mein girawat aane ke chances hote hain. Lekin, is pattern ke analysis ke sath, other technical indicators aur overall market conditions ko bhi madde nazar rakhna zaroori hai. Isse traders ko better decision making mein madad milti hai aur risk management ko bhi improve kiya ja sakta hai.

          Conclusion

          Three Black Crows pattern ek powerful bearish signal hai jo market ke downward trend ko indicate karta hai. Is pattern ko correctly identify karna aur samajhna traders ko market ki current conditions aur future movements ko analyze karne mein madad karta hai. Lekin, hamesha yaad rakhein ke kisi bhi trading decision ke liye technical indicators ke sath sath market ki overall conditions ka bhi analysis zaroori hai.
          • #6 Collapse

            **Three Black Crows Candlestick Pattern:**
            1. **Definition:**
            - **Three Black Crows Pattern:** Yeh ek bearish reversal candlestick pattern hai jo uptrend ke baad market ke downtrend ki indication deta hai. Is pattern mein teen consecutive long bearish (red) candles hoti hain jo pehle ke uptrend ko reverse karti hain.

            2. **Pattern Formation:**
            - **First Candle:** Pehli candle ek long bearish candle hoti hai jo uptrend ke end ko signal karti hai. Iska body lamba hota hai aur closing price open price se significantly lower hoti hai.
            - **Second Candle:** Doosri candle bhi ek long bearish candle hoti hai jo pehli candle ke body ko completely engulf karti hai. Yeh candle previous candle ke close price se lower close hoti hai.
            - **Third Candle:** Teesri candle bhi ek long bearish candle hoti hai jo doosri candle ke body ko engulf karti hai. Yeh candle market mein strong selling pressure ko indicate karti hai aur previous candle ke close price se lower close hoti hai.

            3. **Components:**
            - **Bearish Candles:** Teenon candles bearish hoti hain aur unka body lamba hota hai. Yeh candles market mein selling pressure aur bearish trend ki strength ko represent karti hain.
            - **Lower Shadows:** Is pattern mein lower shadows chhoti hoti hain, jo selling pressure ke dominance ko dikhati hain. Yeh pattern ke confirmation mein madad karta hai.

            4. **Significance:**
            - **Trend Reversal:** Three Black Crows pattern ek strong trend reversal signal hai. Yeh pattern uptrend ke end aur downtrend ke start ko indicate karta hai.
            - **Market Sentiment:** Pattern market mein negative sentiment aur strong selling pressure ko reflect karta hai. Yeh traders ko bearish trend ki expectation dene mein madad karta hai.

            5. **Trading Strategy:**
            - **Entry Point:** Trading ke liye entry point pattern ke formation ke baad hota hai. Jab teenon candles complete ho jati hain aur market bearish momentum dikhaati hai, tab entry consider karni chahiye.
            - **Stop-Loss Orders:** Risk management ke liye stop-loss orders ko pattern ke high ke upar set karein. Yeh aapko potential losses se bachane aur trade ko protect karne mein madad karega.
            - **Take-Profit Levels:** Take-profit levels ko market ke downtrend aur pattern ke potential price movement ke basis par set karein.

            6. **Confirmation:**
            - **Volume:** Pattern ki confirmation ke liye volume ka analysis zaroori hai. Higher volume bearish confirmation ko strengthen karta hai aur pattern ki reliability ko validate karta hai.
            - **Follow-Up Candles:** Pattern ke baad follow-up bearish candles bhi confirmation provide karti hain. Yeh additional selling pressure aur trend continuation ko signal karti hain.

            7. **Limitations:**
            - **False Signals:** Three Black Crows pattern kabhi-kabhi false signals bhi generate kar sakta hai, especially during market consolidation. Market noise aur volatility se bachne ke liye careful analysis zaroori hai.
            - **Context Dependence:** Pattern ki effectiveness market context aur price action ke upar depend karti hai. Pattern ko context ke sath analyze karna zaroori hai.

            8. **Risk Management:**
            - **Risk Assessment:** Trade ke liye risk assessment aur management strategies ko apply karein. Yeh aapke capital ko protect karne aur potential losses ko minimize karne mein madad karta hai.
            - **Position Sizing:** Proper position sizing aur trade management se risk ko effectively handle karein. Yeh aapki overall trading portfolio ko balanced aur risk-free banata hai.

            9. **Practical Application:**
            - **Integration with Indicators:** Three Black Crows pattern ko technical indicators jaise Moving Averages, RSI, aur MACD ke sath combine karna beneficial hota hai. Indicators se additional confirmation aur accuracy milti hai.
            - **Demo Trading:** Pattern ko demo trading ke zariye practice karein. Yeh aapko pattern ke behavior aur trading strategy ko test karne ka mauka deta hai.

            10. **Continuous Learning:**
            - **Educational Resources:** Three Black Crows pattern aur other candlestick patterns ke baare mein educational resources ko regularly study karein. Knowledge ko enhance karke trading skills ko improve karein.
            - **Market Analysis:** Market trends aur patterns ke changes ke sath updated rahna zaroori hai. Yeh aapki trading decisions aur strategies ko optimize karne mein madad karta hai.

            Three Black Crows Candlestick Pattern ek valuable tool hai jo market reversals aur bearish trends ko identify karne mein madad karta hai. Accurate analysis aur effective trading strategies ke sath iska optimal use kiya ja sakta hai.
             
            • #7 Collapse

              Three Black Crows Candlestick Pattern


              1. Three Black Crows Ka Taaruf
              Three Black Crows candlestick pattern ek bearish reversal signal hai jo trading charts par bearish market trends ko identify karne ke liye use hota hai. Yeh pattern teen consecutive black candlesticks par mushtamil hota hai jo ek specific formation follow karti hain. Har candle ki body ka size lamba hota hai aur har ek candle ka closing price pichli candle ke closing price se neeche hota hai. Jab yeh pattern market mein develop hota hai, to yeh traders ko signal deta hai ke market bearish ho sakti hai aur downward trend shuru ho sakta hai. Is pattern ko samajhna aur sahi waqt par identify karna trading strategies ko enhance kar sakta hai.

              Three Black Crows pattern ka formation market sentiment ke bearish mood ko reflect karta hai. Jab market me is pattern ka formation hota hai, to yeh trading activity me increasing selling pressure aur declining prices ko indicate karta hai. Traders is pattern ko bullish trends ke reversal ke liye use karte hain, jo ke ek important strategy hai. Yeh pattern tab develop hota hai jab market me sellers ki dominance barh rahi hoti hai aur buyers ki strength kam hoti hai.

              Pattern ka naam "Three Black Crows" isliye rakha gaya hai kyunki teen consecutive black candles ko ek 'crows' ke roop me dekha ja sakta hai. Har candle ke body black aur long hote hain jo market ke downward pressure ko reflect karte hain. Yeh visual representation traders ko bearish market sentiment ko clearly samajhne mein madad karta hai.

              Pattern ke formation ka samajhna aur uski pehchaan trading decisions ko better bana sakti hai. Traders is pattern ko dekh kar anticipate kar sakte hain ke market kis direction me move kar sakti hai aur accordingly positions open kar sakte hain. Yeh pattern ek important tool hai jo market ke future trends ko predict karne mein madad karta hai.

              2. Pattern Ki Pehchaan
              Three Black Crows pattern ki pehchaan karne ke liye, traders ko teen consecutive long black candlesticks ki formation ko dekhna hota hai. Har candle ki body ka size lamba hona chahiye aur closing price pehli candle ke closing price se neeche hona chahiye. Is pattern ka formation bearish trend ke indication ko clear karta hai aur market ki direction ko determine karne mein madad karta hai.

              Pehli candle ek long black candle hoti hai, jiska opening price high hota hai aur closing price low hota hai. Doosri candle bhi long black hoti hai, aur iska opening price pehli candle ke closing price ke near ya uske upar hota hai, lekin closing price pehli candle ke closing price se neeche hoti hai. Teesri candle bhi similar hoti hai, jisme opening price doosri candle ke closing price ke near ya uske upar hota hai aur closing price doosri candle ke closing price se neeche hoti hai.

              Is pattern ki pehchaan mein candles ka size aur position important hota hai. Agar candles ka size chhota hota hai ya unki bodies overlapping hoti hain, to pattern ki validity compromise hoti hai. Traders ko ensure karna chahiye ke pattern ka formation clear aur distinct ho. Ye bhi important hai ke candles ki bodies ki length aur colors consistent hon.

              Three Black Crows pattern ko identify karne ke liye traders ko market ki overall trend ko bhi dekhna chahiye. Agar market pehle se bullish hai aur sudden bearish reversal dekhne ko milta hai, to is pattern ka impact zyada hota hai. Traders ko pattern ke context ko samajhna zaroori hai, taake wo accurate trading decisions le sakhein.

              3. Pattern Ki Formation
              Three Black Crows pattern ki formation ek specific sequence me hoti hai. Pehli candle ki formation tab hoti hai jab market ka opening price high hota hai aur closing price low hota hai. Is candle ka length zyada hota hai aur iska color black hota hai, jo bearish sentiment ko reflect karta hai.

              Doosri candle ki formation pehli candle ke close ke baad hoti hai. Is candle ka opening price pehli candle ke closing price ke near ya usse upar hota hai, lekin closing price pehli candle ke closing price se neeche hoti hai. Yeh pattern ke bearish sentiment ko confirm karta hai aur market me downward pressure ko indicate karta hai.

              Teesri candle ki formation doosri candle ke close ke baad hoti hai. Is candle ka opening price doosri candle ke closing price ke near ya usse upar hota hai aur closing price doosri candle ke closing price se neeche hoti hai. Yeh third candle pattern ko complete karti hai aur bearish reversal ko confirm karti hai.

              Pattern ke formation ke dauran market ke volume ka bhi analysis zaroori hai. Agar pattern ke formation ke dauran volume high hota hai, to yeh bearish trend ki strength ko indicate karta hai. Traders ko pattern ki formation ke waqt volume aur market sentiment ko bhi consider karna chahiye.

              4. Pattern Ki Significance
              Three Black Crows pattern ki significance bearish trend ko identify karne aur market me potential reversal points ko predict karne me hai. Yeh pattern signal karta hai ke market me selling pressure zyada ho raha hai aur buyers ki strength kam ho rahi hai. Is pattern ka identification traders ko market ke downward movement ka anticipation karne me madad karta hai.

              Pattern ke significance ko samajhne ke liye traders ko historical performance aur pattern ke accuracy ko analyze karna chahiye. Agar pattern consistently bearish trends ko predict karta hai, to iska effectiveness increase hota hai. Historical data ke analysis se traders pattern ke reliability ko assess kar sakte hain.

              Is pattern ka significance market sentiment ke understanding me bhi hai. Jab Three Black Crows pattern form hota hai, to yeh market me bearish sentiment ko reflect karta hai aur traders ko signal deta hai ke market downward trend me ja sakti hai. Is signal ko dekh kar traders short positions open kar sakte hain aur profit gain kar sakte hain.

              Pattern ki significance ko enhance karne ke liye traders ko additional technical indicators ka use karna chahiye. Indicators jaise Moving Averages, RSI aur MACD pattern ki confirmation ko strengthen karte hain aur trading decisions ko better banate hain.

              5. Entry Points
              Three Black Crows pattern ke dekhne ke baad, traders ko entry points decide karna hota hai. Ideal entry point wo hota hai jahan pattern ke teesre candle ke closing price ke neeche market entry ki jaye. Yeh level bearish trend ki continuation ka signal deta hai aur market me downward movement ki anticipation ko confirm karta hai.

              Entry points ko set karte waqt traders ko pattern ki formation ke accuracy ko ensure karna chahiye. Agar pattern ka formation incomplete hai ya candles ka size chhota hai, to entry point ka signal weak ho sakta hai. Traders ko ensure karna chahiye ke pattern clear aur distinct ho.

              Entry points ke decision ke sath stop loss aur target setting bhi important hai. Stop loss ko pattern ki formation ke basis par set karna chahiye, taake unexpected market movements se bachne ke liye protection mil sake. Target setting ke liye previous support levels ko dekhna chahiye jo market ke potential reversal points ko indicate karte hain.

              Traders ko market ke current conditions aur trend ko bhi consider karna chahiye. Agar market already bearish trend me hai aur pattern ka signal strong hai, to entry points zyada reliable hote hain. Is tarah se, accurate entry points ko identify karna market me successful trading decisions ko ensure kar sakta hai.

              6. Stop Loss Setting
              Three Black Crows pattern ka use karte waqt stop loss ko sahi tarah se set karna zaroori hai. Stop loss ko pattern ki pehli black candle ke high ke level par set karna chahiye. Yeh level traders ko unexpected market movements se protect karta hai aur losses ko minimize karta hai.

              Stop loss setting ke liye traders ko market ki volatility aur pattern ki accuracy ko consider karna chahiye. Agar market me volatility high hai, to stop loss ko slightly wide set karna chahiye taake market fluctuations se trigger na ho. Yeh risk management ka ek important aspect hai.

              Traders ko stop loss ko dynamic way me adjust karna chahiye. Jaise hi market move hota hai aur pattern ka bearish trend continue hota hai, traders apne stop loss ko bhi adjust kar sakte hain. Yeh technique trailing stop loss ke naam se jani jati hai aur profit ko lock karne me madad karti hai.

              Proper stop loss setting ke sath traders ko risk-reward ratio ko bhi balance karna chahiye. Risk-reward ratio ko calculate karke traders market ke potential gains aur losses ko analyze kar sakte hain. Yeh approach trading decisions ko optimize karne me madad karti hai.

              7. Target Setting
              Three Black Crows pattern ke sath target setting trading strategy ka ek essential part hai. Target setting ke liye traders ko previous support levels ko dekhna chahiye jo market ke potential reversal points ko indicate karte hain. Yeh levels market ke historical price movements ke basis par identify kiye jate hain.

              Target levels ko set karte waqt traders ko market ke current conditions aur pattern ki accuracy ko bhi consider karna chahiye. Agar market me strong bearish trend hai aur pattern ka signal valid hai, to target levels bhi zyada reliable hote hain. Historical data ke analysis se target levels ko accurately set kiya ja sakta hai.

              Risk-reward ratio ko balance karna bhi zaroori hai. Traders ko ensure karna chahiye ke target levels aur stop loss levels ke beech ratio favorable ho. Is approach se traders profit ko maximize aur risk ko minimize kar sakte hain.

              Target setting ke liye traders ko market ke volume aur trend ko bhi analyze karna chahiye. Agar market volume high hai aur bearish trend continue ho raha hai, to target levels bhi effectively achieve kiye ja sakte hain. Yeh approach successful trading decisions ko ensure kar sakti hai.

              8. Risk Management
              Three Black Crows pattern ka istemaal karte waqt risk management strategies ko follow karna zaroori hai. Effective risk management se traders apne trading capital ko protect kar sakte hain aur losses ko minimize kar sakte hain. Risk management ke key aspects mein stop loss setting, position sizing, aur market volatility analysis shamil hain.

              Stop loss setting risk management ka ek important aspect hai. Stop loss ko pattern ke formation aur market conditions ke basis par set karna chahiye. Yeh unexpected market movements se protection provide karta hai aur losses ko limit karta hai. Traders ko stop loss ko dynamically adjust karna chahiye jaise market move hota hai.

              Position sizing bhi risk management ka ek essential part hai. Traders ko apni position size ko market conditions aur pattern ke accuracy ke basis par adjust karna chahiye. Larger positions zyada risk ko involve karti hain, isliye position sizing ko cautiously plan karna chahiye.

              Market volatility ka analysis bhi risk management me important hota hai. Agar market volatility high hai, to risk management strategies ko adjust karna chahiye. Yeh approach traders ko market fluctuations se protect karne me madad karti hai aur trading decisions ko optimize karti hai.

              9. Confirmation Signals
              Three Black Crows pattern ki validity ko confirm karne ke liye additional technical indicators ka use kiya ja sakta hai. Indicators jaise Moving Averages, RSI (Relative Strength Index), aur MACD (Moving Average Convergence Divergence) pattern ke confirmation ko strengthen karte hain aur trading decisions ko better banate hain.

              Moving Averages ko use karke traders pattern ke long-term trend ko analyze kar sakte hain. Agar Moving Averages bearish trend ko confirm karti hain aur Three Black Crows pattern ke sath align hoti hain, to pattern ka signal zyada reliable hota hai. Moving Averages se market ke overall trend ko samajhna asaan hota hai.

              RSI indicator se market ke overbought ya oversold conditions ko identify kiya ja sakta hai. Agar RSI indicator bearish signal de raha hai aur Three Black Crows pattern ke sath coincide karta hai, to pattern ka effectiveness increase hota hai. RSI se market ke momentum ko assess karna asaan hota hai.

              MACD indicator bhi pattern ke confirmation me madad karta hai. MACD se traders market ke trend changes aur momentum ko dekh sakte hain. Agar MACD bearish signal provide karta hai aur Three Black Crows pattern ke sath align hota hai, to pattern ka signal strong hota hai.

              10. Common Mistakes
              Three Black Crows pattern ka use karte waqt kuch aam mistakes hoti hain jo trading decisions ko impact kar sakti hain. In mistakes ko avoid karna zaroori hai taake successful trading results achieve kiye ja sakein.

              Ek common mistake pattern ki incomplete formation ko ignore karna hai. Agar pattern ke candles ka size chhota hai ya unki bodies overlapping hain, to pattern ka signal weak hota hai. Traders ko ensure karna chahiye ke pattern ka formation clear aur distinct ho.

              Dusri mistake market conditions ko properly analyze na karna hai. Agar market already bearish trend me hai aur pattern ka signal dekhne ko milta hai, to pattern ka impact zyada hota hai. Market ke overall trend aur conditions ko samajhna zaroori hai.

              Teesri mistake confirmation signals ko ignore karna hai. Pattern ke confirmation ke liye additional technical indicators ka use zaroori hai. Agar confirmation signals pattern ke signal ko validate nahi karte, to pattern ka effectiveness kam hota hai.

              Pattern ke analysis me patience aur discipline ka hona bhi zaroori hai. Traders ko market ki fluctuations aur pattern ki formation ko samajhne me waqt lag sakta hai. In common mistakes ko avoid karna successful trading decisions ko ensure kar sakta hai.

              11. Historical Performance
              Three Black Crows pattern ke historical performance ka analysis traders ko pattern ki reliability aur effectiveness ko assess karne me madad karta hai. Historical data ke analysis se traders ko pattern ke past performance aur success rate ka idea milta hai.

              Historical performance ko dekh kar traders pattern ki accuracy aur effectiveness ko evaluate kar sakte hain. Agar pattern consistently bearish trends ko predict karta hai aur market ke downward movements ko accurately capture karta hai, to iska reliability increase hota hai. Historical data se pattern ke performance ko validate kiya ja sakta hai.

              Pattern ke historical performance ka analysis market conditions aur trends ke sath align hota hai. Traders ko historical data ke basis par pattern ke past performance ko assess karna chahiye aur current market conditions ko compare karna chahiye. Is analysis se traders ko better trading decisions lene me madad milti hai.

              Historical performance ka analysis traders ko pattern ke limitations aur potential risks ko bhi highlight karta hai. Agar pattern past me kisi specific conditions me effective raha hai, to traders ko current market conditions ko bhi consider karna chahiye. Yeh approach pattern ke effectiveness ko enhance kar sakti hai.

              12. Market Conditions
              Three Black Crows pattern ka effectiveness market conditions par depend karta hai. Pattern ko analyze karte waqt market ke current conditions aur trends ko dekhna zaroori hai. Trending markets me pattern zyada effective hota hai jab ke ranging markets me pattern ka signal misleading ho sakta hai.

              Agar market already bearish trend me hai aur Three Black Crows pattern ka signal dekhne ko milta hai, to pattern ka impact zyada hota hai. Market ke downward trend ke continuation ka signal pattern ke accuracy ko validate karta hai. Traders ko market ke overall trend aur conditions ko samajhna chahiye.

              Ranging markets me pattern ka signal less reliable ho sakta hai. Agar market me sideways movement ho rahi hai aur pattern form hota hai, to pattern ka impact limited ho sakta hai. Traders ko market ke conditions aur pattern ke alignment ko carefully analyze karna chahiye.

              Market ke volatility aur volume ka analysis bhi important hota hai. High volatility aur volume market ke trend ke strength ko indicate karte hain. Agar pattern ke formation ke waqt market me high volatility aur volume hai, to pattern ke signals zyada reliable hote hain.

              13. Psychological Aspect
              Three Black Crows pattern market ki psychological aspect ko bhi reflect karta hai. Yeh pattern bearish sentiment ko indicate karta hai aur traders ko bearish positions lene ki signal deta hai. Pattern ke psychological impact ko samajhna trading decisions ko better banane me madad karta hai.

              Pattern ka psychological aspect market participants ke sentiment ko samajhne me help karta hai. Jab pattern form hota hai, to yeh market me sellers ki dominance aur buyers ki weakness ko reflect karta hai. Yeh psychological factors market ke direction aur trends ko influence karte hain.

              Traders ko pattern ke psychological impact ko consider karna chahiye. Agar pattern bearish sentiment ko confirm karta hai aur market me selling pressure high hai, to trading decisions ko accordingly adjust karna chahiye. Psychological aspect ko samajhne se trading strategies ko optimize kiya ja sakta hai.

              Pattern ke psychological aspect ko market ke broader trends aur sentiment ke sath align karna zaroori hai. Traders ko market ki mood aur sentiment ko samajhna chahiye taake accurate trading decisions le sakein aur pattern ke signals ko effectively utilize kar sakein.

              14. Conclusion
              Three Black Crows candlestick pattern ek important tool hai jo bearish market trends ko identify karne ke liye use hota hai. Pattern ke accurate formation, confirmation signals, aur risk management ke sath istemaal se traders ko successful trading decisions lene me madad milti hai.

              Pattern ki understanding aur analysis market ke future trends ko better predict karne me madad karti hai. Traders ko pattern ke formation, entry points, stop loss settings, aur target setting ko carefully analyze karna chahiye. Historical performance, market conditions, aur psychological aspects ko bhi consider karna zaroori hai.

              Three Black Crows pattern ke effectiveness ko enhance karne ke liye additional technical indicators ka use karna chahiye. Indicators jaise Moving Averages, RSI aur MACD pattern ke confirmation ko strengthen karte hain aur trading decisions ko better banate hain. Proper risk management aur trading strategies se market me successful trading results achieve kiye ja sakte hain.
              • #8 Collapse

                1. Introduction


                Three Black Crows candlestick pattern aik bohat hi powerful bearish reversal pattern hai jo ke market trend ke reversal ko indicate karta hai. Yeh pattern technical analysis mein bohat zyada popular hai aur traders isse markets mein potential downtrends ko identify karne ke liye use karte hain. Is pattern ka naam “Three Black Crows” is liye rakha gaya hai kyun ke ismein continuously teen bearish candlesticks banti hain jo ke bilkul crows ki tarah dikhai deti hain.

                Yeh pattern tab form hota hai jab ek uptrend ke baad market mein selling pressure increase ho jata hai aur is pressure ke wajah se continuously teen bearish candlesticks banti hain. Har candlestick ka closing price previous candlestick ke close se neeche hota hai, jo ke yeh indicate karta hai ke market mein sellers dominate kar rahe hain aur buyers weak ho rahe hain. Yeh pattern aksar market ke top par form hota hai aur downtrend ki shuruaat ko indicate karta hai.

                Technical analysis mein candlestick patterns ka istimaal market ke trends aur reversals ko identify karne ke liye hota hai. Three Black Crows pattern bhi inhi patterns mein se aik hai jo ke traders ko market ke bearish reversal ke bare mein warn karta hai. Is pattern ko samajhna aur isse trade karna har trader ke liye zaroori hai jo ke market mein bearish signals ko identify karna chahta hai.

                Three Black Crows pattern ka study karna aur isse market mein identify karna har trader ke liye beneficial ho sakta hai. Yeh pattern market ke sentiment ko reflect karta hai aur trading decisions ko enhance karne mein madad karta hai. Is article mein hum is pattern ke different aspects ko detail mein discuss karenge taake traders isse asaani se samajh saken aur apni trading strategies mein use kar saken.
                2. Pattern ki Pehchaan


                Three Black Crows pattern ko pehchanne ke liye yeh zaroori hai ke aap is pattern ke characteristics ko samjhen. Yeh pattern tab form hota hai jab market mein continuously teen din tak bearish candlesticks banti hain. Har candlestick ka closing price previous candlestick ke close se neeche hota hai, aur opening price bhi previous candlestick ke body ke beech mein hota hai. Yeh indicate karta hai ke market mein sellers dominate kar rahe hain aur buyers ki strength kam ho rahi hai.

                Yeh pattern aksar ek uptrend ke baad form hota hai jab market mein buying pressure khatam hota hai aur sellers control mein aa jate hain. Is pattern ki pehchaan karte waqt aapko yeh dekhna chahiye ke har candlestick ka body lamba ho aur shadows choti hon. Agar shadows bohat lambi hain to yeh pattern reliable nahi hota kyun ke yeh indicate karta hai ke market mein hesitation hai.

                Three Black Crows pattern ko identify karna traders ke liye bohat zaroori hai kyun ke yeh pattern market ke reversal ko indicate karta hai. Is pattern ko dekh kar traders apni positions ko adjust kar sakte hain aur potential downtrend ke liye prepare ho sakte hain. Is pattern ko identify karte waqt aapko volume analysis bhi karni chahiye taake pattern ki reliability ko confirm kiya ja sake.

                Pattern ki pehchaan karte waqt aapko market ke overall trend ko bhi dekhna chahiye. Agar market mein strong uptrend tha aur uske baad Three Black Crows pattern form ho raha hai to yeh strong bearish signal hota hai. Lekin agar market already downtrend mein hai aur yeh pattern form ho raha hai to yeh utna significant nahi hota.
                3. Pattern Ka Asal Maqsad


                Three Black Crows pattern ka asal maqsad market ke bearish reversal ko indicate karna hota hai. Yeh pattern traders ko warn karta hai ke market mein selling pressure increase ho raha hai aur buyers market se nikal rahe hain. Is pattern ke baad aksar market mein bearish trend start ho jata hai jo ke traders ke liye ek significant trading signal hota hai.

                Yeh pattern market ke sentiment ko reflect karta hai. Jab market mein continuously teen bearish candlesticks banti hain to yeh indicate karta hai ke sellers dominate kar rahe hain aur buyers weak ho rahe hain. Yeh pattern aksar market ke top par form hota hai jab buying pressure khatam hota hai aur sellers control mein aa jate hain.

                Three Black Crows pattern ka maqsad market ke trend ko reverse karna hota hai. Is pattern ke baad market mein downtrend start hota hai jo ke sellers ke liye ek profitable trading opportunity hoti hai. Yeh pattern traders ko market ke reversal ke bare mein warn karta hai aur unhe apni trading strategies ko adjust karne ka mauka deta hai.

                Is pattern ka maqsad sirf market ke reversal ko indicate karna nahi hota balki yeh pattern market ke overall sentiment ko bhi reflect karta hai. Yeh pattern market mein fear aur panic ko bhi indicate kar sakta hai jab buyers market se nikal rahe hote hain aur sellers dominate kar rahe hote hain. Is pattern ka study karna traders ke liye zaroori hai taake wo market ke sentiment ko samajh saken aur apni trading decisions ko accordingly adjust kar saken.
                4. Pattern Ki Structure


                Three Black Crows pattern ki structure ko samajhna traders ke liye bohat zaroori hai. Yeh pattern mein teen consecutive bearish candlesticks hoti hain jo ke market mein selling pressure ko indicate karti hain. In candlesticks ki bodies kaafi lambi hoti hain aur shadows (wicks) choti hoti hain, jo yeh indicate karti hain ke selling pressure zyada tha aur buyers ka pressure kam ho gaya tha.

                Har candlestick ka opening price previous candlestick ke body ke andar hota hai aur closing price previous candlestick ke close se neeche hota hai. Yeh pattern aksar ek strong uptrend ke baad form hota hai jab market mein buyers ka pressure khatam hota hai aur sellers dominate karte hain. Is pattern ki structure ko dekh kar traders market ke sentiment ko samajh sakte hain.

                Pattern ki structure mein har candlestick ki body lambi hoti hai aur shadows choti hoti hain. Agar shadows lambi hain to yeh pattern reliable nahi hota kyun ke yeh indicate karta hai ke market mein hesitation hai. Yeh pattern tab reliable hota hai jab candlesticks ki bodies lambi hon aur shadows choti hon.

                Is pattern ki structure ko samajhte waqt traders ko market ke overall trend ko bhi dekhna chahiye. Agar market mein strong uptrend tha aur uske baad yeh pattern form ho raha hai to yeh strong bearish signal hota hai. Lekin agar market already downtrend mein hai aur yeh pattern form ho raha hai to yeh utna significant nahi hota.

                Pattern ki structure ko samajhte waqt volume analysis bhi zaroori hoti hai. Agar pattern form hone ke dauran volume increase ho raha hai to yeh selling pressure ko confirm karta hai aur pattern ki reliability ko enhance karta hai. Volume analysis ke saath pattern ki structure ko dekh kar traders market ke sentiment ko better samajh sakte hain.
                5. Pattern Ki Shartain


                Three Black Crows pattern ki shartain ko samajhna traders ke liye bohat zaroori hai taake wo is pattern ko accurately identify kar sakein. Yeh zaroori hai ke har candlestick ka closing price previous candlestick ke close se neeche ho aur opening price previous candlestick ke body ke andar ho. Agar in candlesticks ke shadows bohat lambi hain to yeh pattern reliable nahi hota.

                Yeh pattern tab form hota hai jab market mein continuously teen din tak bearish candlesticks banti hain. Har candlestick ka closing price previous candlestick ke close se neeche hota hai aur opening price previous candlestick ke body ke andar hota hai. Yeh indicate karta hai ke market mein sellers dominate kar rahe hain aur buyers weak ho rahe hain.

                Pattern ki shartain ko samajhte waqt traders ko market ke overall trend ko bhi dekhna chahiye. Agar market mein strong uptrend tha aur uske baad yeh pattern form ho raha hai to yeh strong bearish signal hota hai. Lekin agar market already downtrend mein hai aur yeh pattern form ho raha hai to yeh utna significant nahi hota.

                Pattern ki shartain ko samajhte waqt volume analysis bhi zaroori hoti hai. Agar pattern form hone ke dauran volume increase ho raha hai to yeh selling pressure ko confirm karta hai aur pattern ki reliability ko enhance karta hai. Volume analysis ke saath pattern ki shartain ko dekh kar traders market ke sentiment ko better samajh sakte hain.
                6. Confirmation Ka Zaroori Hona


                Three Black Crows pattern ko confirm karne ke liye yeh dekhna zaroori hai ke pattern ke baad price action kaisa rehta hai. Agar pattern ke baad bhi market mein selling pressure barkarar rehta hai to yeh strong bearish signal hota hai. Confirmation ke bina pattern ko blindly trade karna risky ho sakta hai.

                Yeh zaroori hai ke pattern ke form hone ke baad price action ko closely monitor kiya jaye. Agar pattern ke baad market mein selling pressure increase ho raha hai aur prices neeche ja rahi hain to yeh pattern ko confirm karta hai. Lekin agar pattern ke baad prices recover ho rahi hain to yeh pattern reliable nahi hota.

                Confirmation ke liye volume analysis bhi zaroori hoti hai. Agar pattern ke form hone ke dauran volume increase ho raha hai to yeh selling pressure ko confirm karta hai aur pattern ki reliability ko enhance karta hai. Volume analysis ke saath pattern ko confirm karke traders apni trading decisions ko better bana sakte hain.

                Confirmation ke liye support aur resistance levels ko bhi dekhna chahiye. Agar pattern ke baad price support level ko break kar rahi hai to yeh strong bearish signal hota hai. Lekin agar price resistance level ke paas aa kar reverse ho rahi hai to yeh pattern reliable nahi hota.

                Confirmation ke bina pattern ko trade karna risky ho sakta hai. Is liye pattern ke form hone ke baad price action ko closely monitor karna chahiye aur volume analysis ke saath support aur resistance levels ko dekh kar pattern ko confirm karna chahiye.
                7. Trend Reversal Indication


                Three Black Crows pattern aksar ek uptrend ke baad form hota hai aur market ke trend reversal ko indicate karta hai. Yeh pattern tab form hota hai jab market mein continuously teen din tak bearish candlesticks banti hain. Har candlestick ka closing price previous candlestick ke close se neeche hota hai, jo ke yeh indicate karta hai ke market mein sellers dominate kar rahe hain aur buyers weak ho rahe hain.

                Yeh pattern market ke sentiment ko reflect karta hai. Jab market mein continuously teen bearish candlesticks banti hain to yeh indicate karta hai ke sellers dominate kar rahe hain aur buyers weak ho rahe hain. Yeh pattern aksar market ke top par form hota hai jab buying pressure khatam hota hai aur sellers control mein aa jate hain.

                Three Black Crows pattern ka maqsad market ke trend ko reverse karna hota hai. Is pattern ke baad market mein downtrend start hota hai jo ke sellers ke liye ek profitable trading opportunity hoti hai. Yeh pattern traders ko market ke reversal ke bare mein warn karta hai aur unhe apni trading strategies ko adjust karne ka mauka deta hai.

                Yeh pattern market ke sentiment ko reflect karta hai aur market ke reversal ko indicate karta hai. Traders is pattern ko dekh kar apni positions ko adjust kar sakte hain aur potential downtrend ke liye prepare ho sakte hain. Is pattern ka study karna aur isse market mein identify karna har trader ke liye beneficial ho sakta hai.

                Three Black Crows pattern ka trend reversal indication market ke overall sentiment ko samajhne mein madad karta hai. Yeh pattern market mein fear aur panic ko bhi indicate kar sakta hai jab buyers market se nikal rahe hote hain aur sellers dominate kar rahe hote hain. Is pattern ka study karna traders ke liye zaroori hai taake wo market ke sentiment ko samajh saken aur apni trading decisions ko accordingly adjust kar saken.
                8. Pattern Ki Reliability


                Three Black Crows pattern ki reliability ko samajhna traders ke liye bohat zaroori hai. Yeh pattern tab reliable hota hai jab iske form hone ke baad price action ko closely monitor kiya jaye aur volume analysis ke saath support aur resistance levels ko dekh kar pattern ko confirm kiya jaye. Agar pattern ke form hone ke dauran volume increase ho raha hai to yeh selling pressure ko confirm karta hai aur pattern ki reliability ko enhance karta hai.

                Pattern ki reliability ko enhance karne ke liye yeh zaroori hai ke har candlestick ka closing price previous candlestick ke close se neeche ho aur opening price previous candlestick ke body ke andar ho. Agar in candlesticks ke shadows bohat lambi hain to yeh pattern reliable nahi hota. Yeh pattern tab reliable hota hai jab candlesticks ki bodies lambi hon aur shadows choti hon.

                Pattern ki reliability ko enhance karne ke liye yeh zaroori hai ke pattern ke form hone ke baad price action ko closely monitor kiya jaye. Agar pattern ke baad market mein selling pressure increase ho raha hai aur prices neeche ja rahi hain to yeh pattern ko confirm karta hai. Lekin agar pattern ke baad prices recover ho rahi hain to yeh pattern reliable nahi hota.

                Pattern ki reliability ko enhance karne ke liye volume analysis bhi zaroori hoti hai. Agar pattern ke form hone ke dauran volume increase ho raha hai to yeh selling pressure ko confirm karta hai aur pattern ki reliability ko enhance karta hai. Volume analysis ke saath pattern ki reliability ko dekh kar traders apni trading decisions ko better bana sakte hain.

                Pattern ki reliability ko enhance karne ke liye support aur resistance levels ko bhi dekhna chahiye. Agar pattern ke baad price support level ko break kar rahi hai to yeh strong bearish signal hota hai. Lekin agar price resistance level ke paas aa kar reverse ho rahi hai to yeh pattern reliable nahi hota.
                9. Pattern Ki Limitations


                Three Black Crows pattern ki kuch limitations bhi hain jo traders ko samajhni chahiyein. Yeh pattern aksar market ke top par form hota hai jab buying pressure khatam hota hai aur sellers control mein aa jate hain. Lekin agar market already downtrend mein hai aur yeh pattern form ho raha hai to yeh utna significant nahi hota.

                Yeh pattern tab reliable hota hai jab iske form hone ke baad price action ko closely monitor kiya jaye aur volume analysis ke saath support aur resistance levels ko dekh kar pattern ko confirm kiya jaye. Agar pattern ke form hone ke dauran volume increase ho raha hai to yeh selling pressure ko confirm karta hai aur pattern ki reliability ko enhance karta hai. Lekin agar volume analysis ke bagair pattern ko trade kiya jaye to yeh risky ho sakta hai.

                Pattern ki limitations ko samajhte waqt traders ko market ke overall trend ko bhi dekhna chahiye. Agar market already downtrend mein hai aur yeh pattern form ho raha hai to yeh utna significant nahi hota. Yeh pattern aksar ek uptrend ke baad form hota hai jab market mein buyers ka pressure khatam hota hai aur sellers dominate karte hain.

                Pattern ki limitations ko samajhte waqt support aur resistance levels ko bhi dekhna chahiye. Agar pattern ke baad price support level ko break kar rahi hai to yeh strong bearish signal hota hai. Lekin agar price resistance level ke paas aa kar reverse ho rahi hai to yeh pattern reliable nahi hota.

                Pattern ki limitations ko samajhte waqt confirmation ke bina pattern ko trade karna risky ho sakta hai. Is liye pattern ke form hone ke baad price action ko closely monitor karna chahiye aur volume analysis ke saath support aur resistance levels ko dekh kar pattern ko confirm karna chahiye.
                10. Pattern Ki Strategy


                Three Black Crows pattern ko trade karne ke liye ek specific strategy ka hona zaroori hai. Is pattern ko trade karne ke liye traders ko pehle pattern ko accurately identify karna chahiye aur phir confirmation ke baad trade enter karni chahiye. Pattern ko confirm karne ke liye volume analysis aur support aur resistance levels ka study zaroori hota hai.

                Pattern ko trade karne ke liye ek strong risk management strategy ka hona bhi zaroori hai. Traders ko apne stop loss aur take profit levels ko accurately set karna chahiye taake market ke unexpected movements se bach sakein. Pattern ke baad market mein downtrend start hota hai jo ke sellers ke liye ek profitable trading opportunity hoti hai.

                Pattern ko trade karne ke liye yeh zaroori hai ke traders market ke overall trend ko dekh kar apni positions ko adjust karen. Agar market mein strong uptrend tha aur uske baad yeh pattern form ho raha hai to yeh strong bearish signal hota hai. Lekin agar market already downtrend mein hai aur yeh pattern form ho raha hai to yeh utna significant nahi hota.

                Pattern ko trade karne ke liye volume analysis bhi zaroori hoti hai. Agar pattern ke form hone ke dauran volume increase ho raha hai to yeh selling pressure ko confirm karta hai aur pattern ki reliability ko enhance karta hai. Volume analysis ke saath pattern ko dekh kar traders apni trading decisions ko better bana sakte hain.

                Pattern ko trade karne ke liye support aur resistance levels ko bhi dekhna chahiye. Agar pattern ke baad price support level ko break kar rahi hai to yeh strong bearish signal hota hai. Lekin agar price resistance level ke paas aa kar reverse ho rahi hai to yeh pattern reliable nahi hota. Pattern ko trade karne ke liye in sab factors ko dekh kar apni strategy banani chahiye.
                11. Risk Management Techniques


                Three Black Crows pattern ko trade karte waqt risk management techniques ka hona bohat zaroori hai. Yeh pattern market ke bearish reversal ko indicate karta hai jo ke sellers ke liye ek profitable trading opportunity hoti hai. Lekin market mein unexpected movements aur volatility ke wajah se risk management techniques ka hona zaroori hota hai.

                Risk management techniques mein sabse pehle stop loss aur take profit levels ko accurately set karna hota hai. Stop loss level ko aise set karna chahiye ke agar market aapke against jaye to aapka loss limited rahe. Take profit level ko aise set karna chahiye ke aapka profit maximize ho. Yeh levels market ke current trend aur volatility ko dekh kar set karne chahiye.

                Risk management techniques mein position sizing bhi bohat zaroori hoti hai. Position size ko aise set karna chahiye ke agar market aapke against jaye to aapka loss manageable rahe. Position size market ke current volatility aur aapke trading capital ko dekh kar set karne chahiye. Is se aap apne trading risk ko effectively manage kar sakte hain.

                Risk management techniques mein trailing stop loss ka use bhi bohat effective hota hai. Trailing stop loss ko aise set karna chahiye ke agar market aapke favor mein jaye to aapka stop loss level bhi adjust ho jaye aur aapka profit secure ho. Trailing stop loss market ke current trend aur volatility ko dekh kar set karne chahiye.

                Risk management techniques mein diversification bhi ek important aspect hota hai. Apne trading portfolio ko diversify karke aap apne overall risk ko reduce kar sakte hain. Different assets aur instruments mein invest karke aap apne trading risk ko effectively manage kar sakte hain. Yeh techniques market ke unexpected movements aur volatility se bachne mein madad karti hain.
                12. Technical Indicators Ke Saath Integration


                Three Black Crows pattern ko trade karne ke liye technical indicators ka use karna bohat beneficial hota hai. Technical indicators market ke trend aur momentum ko analyze karne mein madad karte hain aur pattern ki reliability ko enhance karte hain. Different technical indicators ka use karke traders apni trading strategies ko better bana sakte hain.

                Technical indicators mein moving averages ka use bohat common hota hai. Moving averages market ke overall trend ko analyze karne mein madad karte hain. Three Black Crows pattern ke baad agar market ke price moving averages ke neeche trade kar rahi hai to yeh strong bearish signal hota hai. Moving averages ko use karke pattern ko confirm karne ke liye traders apni trading decisions ko better bana sakte hain.

                Technical indicators mein Relative Strength Index (RSI) ka use bhi bohat effective hota hai. RSI market ke overbought aur oversold conditions ko analyze karne mein madad karta hai. Three Black Crows pattern ke baad agar RSI oversold condition ko indicate kar raha hai to yeh strong bearish signal hota hai. RSI ko use karke pattern ko confirm karne ke liye traders apni trading decisions ko better bana sakte hain.

                Technical indicators mein MACD (Moving Average Convergence Divergence) ka use bhi bohat common hota hai. MACD market ke trend aur momentum ko analyze karne mein madad karta hai. Three Black Crows pattern ke baad agar MACD bearish crossover ko indicate kar raha hai to yeh strong bearish signal hota hai. MACD ko use karke pattern ko confirm karne ke liye traders apni trading decisions ko better bana sakte hain.

                Technical indicators mein Bollinger Bands ka use bhi bohat effective hota hai. Bollinger Bands market ke volatility aur trend ko analyze karne mein madad karte hain. Three Black Crows pattern ke baad agar price Bollinger Bands ke neeche trade kar rahi hai to yeh strong bearish signal hota hai. Bollinger Bands ko use karke pattern ko confirm karne ke liye traders apni trading decisions ko better bana sakte hain.
                13. Practical Trading Examples


                Three Black Crows pattern ko samajhne ke liye practical trading examples ka hona bohat zaroori hai. Practical examples se traders pattern ko accurately identify karna seekh sakte hain aur apni trading strategies ko better bana sakte hain. Different trading scenarios ko dekh kar traders pattern ko trade karne ke liye effective techniques develop kar sakte hain.

                Practical trading example mein ek scenario ko dekhte hain jahan market ek strong uptrend mein hai aur uske baad Three Black Crows pattern form hota hai. Pattern ke form hone ke baad market mein downtrend start hota hai jo ke sellers ke liye ek profitable trading opportunity hoti hai. Is scenario ko dekh kar traders pattern ko accurately identify kar sakte hain aur apni trading strategies ko adjust kar sakte hain.

                Practical trading example mein ek aur scenario ko dekhte hain jahan market ek weak uptrend mein hai aur uske baad Three Black Crows pattern form hota hai. Pattern ke form hone ke baad market mein consolidation start hoti hai jo ke pattern ki reliability ko question karta hai. Is scenario ko dekh kar traders pattern ko accurately identify kar sakte hain aur apni trading strategies ko adjust kar sakte hain.

                Practical trading example mein ek scenario ko dekhte hain jahan market ek strong downtrend mein hai aur uske baad Three Black Crows pattern form hota hai. Pattern ke form hone ke baad market mein strong downtrend continue hota hai jo ke sellers ke liye ek profitable trading opportunity hoti hai. Is scenario ko dekh kar traders pattern ko accurately identify kar sakte hain aur apni trading strategies ko adjust kar sakte hain.

                Practical trading example mein ek aur scenario ko dekhte hain jahan market ek sideways trend mein hai aur uske baad Three Black Crows pattern form hota hai. Pattern ke form hone ke baad market mein consolidation start hoti hai jo ke pattern ki reliability ko question karta hai. Is scenario ko dekh kar traders pattern ko accurately identify kar sakte hain aur apni trading strategies ko adjust kar sakte hain.
                Conclusion


                Three Black Crows pattern forex trading mein ek important bearish reversal pattern hota hai jo ke market ke trend reversal ko indicate karta hai. Is pattern ko accurately identify karna aur iske baad confirmation karna bohat zaroori hota hai taake trading decisions better bana sakein. Pattern ko accurately identify karne ke liye candlestick structure, price action, aur volume analysis ka study karna zaroori hota hai.

                Three Black Crows pattern ki identification ke baad confirmation ke liye volume analysis aur support aur resistance levels ka study zaroori hota hai. Pattern ko trade karne ke liye ek strong risk management strategy ka hona zaroori hota hai jisme stop loss aur take profit levels ko accurately set karna hota hai. Technical indicators ka use karke pattern ko confirm karne ke liye trading strategies ko better bana sakte hain.

                Pattern ko trade karne ke liye practical trading examples ka hona zaroori hota hai taake traders pattern ko accurately identify karna seekh saken aur apni trading strategies ko adjust kar saken. Practical examples se traders pattern ko trade karne ke liye effective techniques develop kar sakte hain aur apni trading decisions ko better bana sakte hain.

                Overall, Three Black Crows pattern ko samajhna aur isse effectively trade karna forex trading mein profitable trading opportunities provide kar sakta hai. Traders ko is pattern ka study karna chahiye aur isse accurately identify karna seekhna chahiye taake apni trading strategies ko better bana saken aur market ke trend reversal ke liye prepare ho saken.
                • #9 Collapse

                  **Three Black Crows Candlestick Pattern: Ek Tafseeli Jaiza**
                  **1. Introduction**
                  - Three Black Crows Candlestick Pattern ek bearish reversal pattern hai jo market ke uptrend ke baad banta hai.
                  - Ye pattern market ke potential downtrend ko signal karta hai aur typically strong selling pressure ko indicate karta hai.

                  **2. Pattern Ki Formation**
                  - **Three Candlesticks**: Is pattern ka formation teen consecutive bearish (red) candlesticks ke combination se hota hai.
                  - **Candlestick Characteristics**:
                  - Har candlestick ki body lambi aur previous candlestick ke close se opening price niche hoti hai.
                  - Har successive candlestick lower close aur lower open banati hai, jo market mein continuous selling pressure ko reflect karta hai.

                  **3. Pattern Ki Characteristics**
                  - **Long Bodies**: Pattern ke har candlestick ka body lamba hota hai, jo strong bearish sentiment aur selling pressure ko indicate karta hai.
                  - **Minimal Wicks**: Pattern ke candlesticks ki wicks chhoti hoti hain ya absent hoti hain, jo market ke strong downward movement ko show karta hai.
                  - **Close Proximity**: Har candlestick ka closing price pichle candlestick ke low ke paas ya usse niche hota hai, jo downward momentum ko show karta hai.

                  **4. Pattern Ki Interpretation**
                  - **Bearish Reversal**: Three Black Crows Pattern uptrend ke baad banta hai aur ye market ke bearish reversal ka indication hota hai.
                  - **Market Sentiment**: Pattern market ke sentiment ko bearish direction mein shift karta hai aur strong selling pressure ko highlight karta hai.

                  **5. Trading Strategy**
                  - **Entry Point**: Traders generally pattern ke third candlestick ke close ke baad sell position open karte hain. Entry point pattern ke completion ke baad set kiya jata hai.
                  - **Stop Loss**: Stop loss ko pattern ke third candlestick ke high ke thoda upar set kiya jata hai taake unexpected upward movement ko cover kiya ja sake.
                  - **Target**: Targets ko previous support levels ya percentage move ke basis par set kiya jata hai. Traders profit-taking levels ko pattern ke previous low ke around set karte hain.

                  **6. Confirmation**
                  - **Follow-up Candlesticks**: Pattern ke baad follow-up candlesticks ko monitor karna zaroori hai. Agar price downward movement continue karti hai, to signal strong hota hai.
                  - **Additional Indicators**: Technical indicators jaise moving averages, RSI, ya MACD bhi pattern ki confirmation ko enhance karte hain aur trading decisions ko support karte hain.

                  **7. Limitations**
                  - **False Signals**: Kabhi kabhi Three Black Crows Pattern false signals bhi de sakta hai, especially volatile markets mein. Additional analysis zaroori hai.
                  - **Market Conditions**: Pattern ka effectiveness market conditions aur overall trend par depend karta hai. Isliye broader market analysis bhi zaroori hai.

                  **8. Conclusion**
                  - Three Black Crows Candlestick Pattern ek effective bearish reversal signal hai jo market ke downtrend ko identify karne mein madad karta hai.
                  - Pattern ko proper confirmation, additional indicators, aur risk management ke saath use karke, traders apne trading decisions ko enhance kar sakte hain.
                   
                  • #10 Collapse

                    Three black crows candle pattern
                    What is Three black crows candlestick pattern
                    As salam o alaikum dosto, Three black crows candle pattern ak bullish fashion reversal pattern ha jo bullish trend to bearish fashion guy change ker data ha of pattern foreign currency pairs or commodities ok average chart trend of bullish k height is equal to resistance degree k bypass banta ha. Jab market chart then price then high quality karte review Hein To Hamen high quality with different type of pattern mil jaate Hein kyunki Jab ki market movement and movement of Main start Hona Hona hota hy kuya time of different types then pattern Hein agar Ham resistance level per aisi koi candles mil jaati Hy To inse Hamen guarantee mil jaati hy or tab Ham market Main 3 black cross cross candle pattern ko analysis kar sakte hein or iski profitable trade kar sakte hein. Three black crows teen black candles ka ik bearish trend reversal pattern hy, jo k umoman bullish trend ya high prices ko bearish trend reversal pattern me badalta hy. Pattern ki teeno candles ik strong bearish trend me market ki sellers ko represent karti hy, jiss se traders buying ki bajaye selling ko ziada tarjeeh dete hen. Pattern ki teeno candles ik dosre k below ja k close hoti hy jiss candle bagher wicks k banti hy. Ye candles strong bearish candles hoti hy, jo k qeematon ko bohut tezi k sath bearish le kar jati hy.

                    Three types of Three black crows candle pattern
                    1. First Candle: Three black crows pattern ki pehli candle ik strong ya long real body wali bearish candle hoti hy. Ye candle cor main black ya red hoti hy, jo k bullish trend k akhari bullish k baad open ho kar down par close hoti hy. Ye candle bagher upper or lower shadow ki hoti hy.

                    2. Second Candle: Three black crows pattern main shamil dosri candle bhi pehli candle ki trah same bearish candle hoti hy, jiss ka upper or lower side par koi wick ya shadow nahi hota hy. Ye candle pehli candle ki nisbat thori se bari bhi ho sakti hy. Ye candle bhi black ya red color main hoti hy.

                    3. Third Candle: Three black crows pattern main teesri candle same black ya red color wali candle hoti hy, jo k dosri candle k lower ya body main open ho kar nechay close hoti hy. Ye candle bhi ziada tar bagher wick ya shadow hoti hy.


                    Trading strategy of Three black crows candle pattern
                    Three black crows Ka Taaruf: Three black crows (Three Black Crows) ek mashhoor candlestick pattern hy jo technical analysis main use hota hy. Ye pattern bearish reversal signal ke liye jaana jaata hy, or is ka istemal aksar traders market ke girne wale trend ko samajhne ke liye karte hein. Jab ye pattern ban jata hy, to ye aam tor par is baat ka ishara hota hy ke market main girawat aa sakti hy.

                    Pattern Ka Structure: Three black crows pattern teen consecutive black (red) candlesticks se mil kar banta hy. Har candlestick ki body pichle din ke close se lower hoti hy or inki shadows (wicks) bhi choti hoti hein. Pehli candlestick ek strong black body ko dikhati hy, jiska matlab hy ke market main strong bearish momentum hy. Doosri or teesri candlesticks bhi isi trend ko follow karti hein or iska body pehle din se chhoti hoti hy, jo ki continuation ka signal hota hy.

                    Pattern Ki Pehchan: Is pattern ko pehchanne ke liye, traders ko dekhna hota hy ke ye teen consecutive black candles kisi uptrend ke baad ban rahi hein. Agar ye pattern kisi uptrend ke baad ban raha hy, to iska matlab hy ke market main bearish reversal hone wala hy. Ye pattern zyada effective tab hota hy jab market kisi major resistance level ke qareeb hota hy.


                    Click image for larger version

Name:	thrree.jpeg
Views:	21
Size:	12.2 کلوبائٹ
ID:	13089029
                    • #11 Collapse

                      Trading mein candlestick patterns ka apna aik aham maqam hota hai. Yeh patterns traders ko market ke future movement ke baray mein ishara detay hain aur unhein decision-making mein madad detay hain. Aise hi ek popular pattern ka naam Three Black Crows hai, jo ke bearish reversal pattern ke tor par jaana jata hai. Candlestick patterns trading aur technical analysis ka aik aham hissa hain. Yeh patterns traders ko market ke sentiments samajhne mein madad detay hain, aur yeh market ke buyers aur sellers ke darmiyan strength ka bhi pata detay hain. Aik candlestick, market ke aik specific period ke high, low, open aur close ko represent karti hai. Jab yeh candlesticks specific tarah se aik dosray ke sath ban jati hain, toh woh pattern banatay hain jo ke market ke future movement ko predict karne mein madadgar hotay hain. Ab hum Three Black Crows pattern ko samjhtay hain jo ke bearish trend ko indicate karta hai aur aik existing bullish trend ke reversal ka ishara hota hai.


                      Three Black Crows Pattern
                      Three Black Crows aik bearish reversal pattern hai jo ke normally kisi bullish trend ke baad develop hota hai. Yeh pattern consist karta hai teen consecutive bearish (red ya black) candlesticks ka jo ke clearly ek dosray ke neeche close hoti hain. In candlesticks ka har aik lower close aur lower low hota hai, jo market mein downtrend ki shuruaat ko dikhata hai.

                      Yeh pattern jab banta hai toh yeh batata hai ke pehle market bullish trend mein tha, lekin ab sellers ka pressure zyada ho gaya hai, aur buyers apni strength kho chukay hain. Yeh reversal ka aik clear signal hota hai, aur traders ko alert karta hai ke market ab neeche ja sakta hai.

                      Three Black Crows Pattern ki Shakal
                      Is pattern ko samajhna zaroori hai ke iska visual structure kaisa hota hai.
                      1. Pehli Crow (First Candle): Pehli candlestick bullish trend ke baad banti hai, lekin yeh bearish hoti hai. Iska matlab yeh hota hai ke market mein selling pressure increase ho gaya hai. Pehli candlestick ka body choti ya lambi ho sakti hai, lekin yeh green candle ke close ke neeche close hoti hai.
                      2. Doosri Crow (Second Candle): Doosri candlestick bhi bearish hoti hai, aur yeh pehli candle ke close se neeche khulti hai. Yeh candle bhi lower low aur lower close karti hai, jo ke selling momentum ko mazid barhawa detay hain.
                      3. Teesri Crow (Third Candle): Teesri candle bhi bilkul bearish hoti hai, aur yeh doosri candle ke close se neeche close hoti hai. Yeh pattern complete karta hai aur yeh signal deta hai ke ab bearish trend shuru ho gaya hai.
                      In teeno candles ki behtareen example tab hoti hai jab yeh candles relatively bare body ke sath banti hain aur inka shadow chota ya bilkul na ho. Yeh sellers ke control ko aur mazid mazbooti se highlight karta hai.

                      Three Black Crows Ka Matlab Aur Interpretation
                      Three Black Crows pattern ka signal dena yeh hota hai ke bullish trend apna momentum kho chuka hai aur sellers ne market mein control hasil kar liya hai. Is pattern ko dekh kar, traders isko bearish reversal signal ke tor par treat kartay hain aur yeh samajhtay hain ke aane wale dinon mein market neeche ja sakta hai.

                      Is pattern ki interpretation ke liye kuch important points yeh hain:
                      1. Bullish Trend Ka Khatma: Jab market mein bullish trend chal raha ho aur Three Black Crows pattern banay, toh yeh samajhna zaroori hai ke ab bullish trend apna akhir kar raha hai.
                      2. Bearish Trend Ki Shuruaat: Teen bearish candlesticks ka lagataar ban'na yeh dikhata hai ke market bearish hone wala hai aur neeche ki taraf movement expected hai.
                      3. Overbought Condition: Is pattern ka dikhayi dena aksar us waqt hota hai jab market overbought hoti hai, matlab zyada khareedari ki wajah se prices kaafi upar chal gayi hoti hain. Yeh pattern batata hai ke ab market correction karne wali hai.
                      Three Black Crows Pattern Mein Risk
                      Jab aap trading kar rahe hote hain, toh kisi bhi pattern ko blindly follow karna hamesha risky hota hai. Three Black Crows pattern ke sath bhi kuch limitations aur risks attach hotay hain, jo traders ko madad detay hain ke woh isko samajh kar istamaal karen.
                      1. False Signals: Kabhi kabar yeh pattern false signals bhi de sakta hai, especially agar market mein volatility zyada ho. Aise mein, pattern dekh kar aap jaldbazi mein decision le saktay hain jo galat ho sakta hai.
                      2. Market Context: Market ka overall context samajhna zaroori hai. Agar market mein koi fundamental news ya announcement hai, toh yeh pattern apna usual kaam nahi karega. For example, agar koi major economic event ya political news aaye jo market ko influence kare, toh pattern kaam nahi karega.
                      3. Volume Ka Role: Jab yeh pattern banta hai, toh volume bhi dekhna zaroori hai. Agar pattern ban raha ho lekin volume low ho, toh iska matlab yeh ho sakta hai ke sellers mein itna pressure nahi hai jitna dikhai deta hai. High volume ke sath pattern banana zyada reliable signal deta hai.
                      4. Confirmation: Sirf pattern dekh kar trade karna risky ho sakta hai. Isliye confirmation indicators ka use karna zaroori hota hai, jaise ke Relative Strength Index (RSI), Moving Averages, ya MACD (Moving Average Convergence Divergence).
                      Three Black Crows Ko Kaise Trade Kiya Ja Sakta Hai
                      Three Black Crows ko trade karte waqt kuch specific strategies ka dhyan rakhna zaroori hai taake aap galat signals ko avoid kar sakein aur apne risk ko manage kar sakein.
                      1. Confirmation Ke Saath Trade Karein: Jab aapko Three Black Crows pattern nazar aaye, toh sirf is pattern par depend na karein. Is pattern ke baad koi confirmation indicator ka use karein, jaise ke RSI ya Moving Averages, jo aapko yeh bata sakein ke market mein bearish trend waqai shuru ho chuka hai.
                      2. Risk Management: Hamesha stop-loss lagana zaroori hai, khas tor par jab aap reversal patterns ko trade kar rahe hote hain. Three Black Crows ke case mein aap apna stop-loss previous high ke thoda upar laga sakte hain taake aapka loss limited ho.
                      3. Support Aur Resistance Levels: Jab yeh pattern ban raha ho, toh nearby support aur resistance levels ka dhyan rakhna zaroori hai. Agar yeh pattern kisi strong support level ke paas ban raha ho, toh market wahan bounce back kar sakti hai. Isliye, aapko is cheez ka bhi dhyan rakhna hota hai.
                      4. Entry Points: Entry point ka faasla bhi dekhna chahiye. Aam tor par teesri candle ke close par trade entry leni chahiye, lekin aapko yeh bhi dekhna hota hai ke market kis level par hai aur kya koi overbought/oversold signal toh nahi aa raha.
                      Three Black Crows Aur Risk Management
                      Risk management har tarah ki trading mein zaroori hota hai, lekin jab aap reversal patterns ko trade karte hain, toh yeh aur bhi important ho jata hai. Three Black Crows ko trade karte waqt aap kuch ahem risk management techniques ka istimaal kar sakte hain:
                      1. Position Sizing: Position size ko control karna zaroori hai. Aapko apne account size ke mutabiq position size rakhni chahiye taake agar market aapke against chali jaye, toh aapka loss limited rahe.
                      2. Diversification: Sirf ek asset ya ek market par focus na karein. Apna portfolio diversify karein taake ek market ke crash hone par aapke baki investments bach sakein.
                      3. Trailing Stop Loss: Trailing stop loss ka istemal kar ke aap apne profits ko lock kar sakte hain jab market aapke favour mein chalti hai. Yeh strategy khas tor par reversal trading mein kaafi madadgar hoti hai.
                      Three Black Crows Pattern Ka Historical Use
                      Historically, Three Black Crows pattern ko kaafi reliable bearish reversal indicator ke tor par samjha gaya hai. Yeh aksar long-term downtrends ki shuruaat ko indicate karta hai, lekin iska short-term trading mein bhi zikar hota hai. Bohat se expert traders isko stock markets, commodities, aur forex trading mein successful trade decisions ke liye use karte hain.

                      Lekin, har waqt yeh pattern successful nahi hota. Kuch waqt market mein itna strong bullish sentiment hota hai ke yeh pattern banne ke bawajood price recover kar jati hai. Is liye hamesha supplementary tools aur indicators ka use karna chahiye.

                      Three Black Crows candlestick pattern trading mein aik powerful tool hai jo ke bearish reversal ka clear signal deta hai. Yeh pattern market ke turning points ko highlight karta hai aur traders ko batata hai ke ab market neeche jaane wali hai. Lekin hamesha yaad rakhein ke kisi bhi candlestick pattern ko blindly follow karna theek nahi hota. Aapko market ke overall context, volume, aur confirmation indicators ka bhi istemal karna chahiye taake aapki trading strategy successful ho. Risk management bhi trading ka aham hissa hai, aur aapko hamesha apne losses ko minimize karne ke liye stop-loss aur other risk management techniques ka istemal karna chahiye.


                      Agar aap Three Black Crows pattern ka sahi tareeke se analysis karain aur isko baqi technical indicators ke sath use karain, toh aap apne trading decisions ko kaafi improve kar sakte hain aur profitable trades karne ke chances barha sakte hain.
                      Believe in yourself and your abilities. When you fight for your dreams, you can achieve anything.
                      • #12 Collapse

                        **Three Black Crows Candlestick Pattern**
                        Forex trading mein candlestick patterns ka istemal ek common aur reliable technique hai, jo traders ko market trends samajhne mein madad deti hai. Inhi patterns mein se ek important pattern "Three Black Crows" hai. Ye pattern mostly market ke bearish reversal ka ishara deta hai, yani jab market upward trend se downward trend ki taraf shift hota hai.

                        ### Three Black Crows Pattern Kya Hai?

                        Three Black Crows candlestick pattern teen consecutive bearish candles par mushtamil hota hai. Ye pattern tab banta hai jab market pehle ek bullish trend mein hota hai, lekin fir teen lambe bearish candles banne lagti hain. Har candle ka opening price pichli candle ke closing price ke kareeb hota hai, lekin har din ka closing price neeche jata hai.

                        Is pattern ka asal maqsad ye hota hai ke market mein selling pressure bhar gaya hai aur buyers ab price ko upar nahi le ja sakte. Isse yeh andaza lagaya ja sakta hai ke market ka trend ab neeche ki taraf ja raha hai.

                        ### Pattern Ki Pehchan

                        Is pattern ko pehchanne ke liye kuch khas points hote hain:

                        1. **Teen Bearish Candles:** Pehli shart yeh hai ke teen back-to-back bearish candles banayen, jo har ek candle ke opening aur closing prices ko neeche le jaayein.

                        2. **Candles Ka Size:** Har candle ki body kaafi badi hoti hai, jo is baat ka ishara deti hai ke selling pressure kaafi strong hai.

                        3. **Wicks Ka Chota Hona:** Candles ki wicks choti hoti hain ya bilkul nahi hoti, jo yeh batata hai ke market mein buyers ki taraf se koi khas resistance nahi tha.

                        ### Three Black Crows Pattern Ka Istemaal

                        Jab yeh pattern banta hai to iska matlab yeh hota hai ke market ab bearish mode mein enter kar raha hai. Yani ab price neeche jane ke chances barh gaye hain. Is pattern ka istemal karke traders apne short positions ko open kar sakte hain, ya agar wo already invested hain to exit karne ka soch sakte hain.

                        Lekin is pattern ka signal tabhi zyada strong hota hai jab yeh kisi resistance level ya overbought condition ke baad banta hai. Isliye sirf is pattern ko dekh kar trade nahi karna chahiye, balki doosri technical indicators, jaise ke RSI ya Moving Averages ko bhi dekhna chahiye.

                        ### Conclusion

                        Three Black Crows candlestick pattern ek powerful bearish reversal indicator hai jo traders ko market ke trend reversal ka signal deta hai. Lekin, is pattern ka istemal karte waqt hamesha doosre factors ko bhi madde nazar rakhna zaroori hai.
                        • #13 Collapse

                          ### Three Black Crows Candlestick Pattern
                          #### 1. Taaruf

                          Three Black Crows ka candlestick pattern trading ki duniya mein ek ahem nishaan hai jo bearish reversal ki taraf ishara karta hai. Yeh pattern teen consecutive black (red) candlesticks par mushtamil hota hai jo ke ek doosre ke neeche close hote hain. Is pattern ka asar aksar market ki bearish sentiment ko dikhata hai.

                          #### 2. Pattern ki Shakal

                          Is pattern mein teen consecutive bearish candlesticks hote hain. Har candlestick ka body lamba aur dark hota hai, jab ke yeh candlesticks ek doosre ke neeche khulne aur close hone chahiye. Yeh pattern aksar uptrend ke baad banta hai, jo ke yeh dikhata hai ke market ne apni bullish trend khatam kar diya hai.

                          #### 3. Market Sentiment

                          Jab yeh pattern banata hai, toh yeh market ke mood ko tabdeel karta hai. Traders ke liye yeh ek signal hota hai ke unhe apne positions ko re-evaluate karna chahiye. Yeh pattern is baat ki taraf ishara karta hai ke sellers market mein dominant hain aur buyers ne apne positions ko kholne mein dikkat mehsoos ki hai.

                          #### 4. Entry Point

                          Is pattern ka istemal karte waqt, traders ko entry point ka khayal rakhna chahiye. Jab teen black crows ka pattern complete hota hai, toh yeh bearish momentum ko darshata hai. Traders ko next candle ki opening par sell position kholne ki koshish karni chahiye jab candlestick pattern confirm ho jaata hai.

                          #### 5. Stop-Loss ki Ahmiyat

                          Stop-loss ka istemal is pattern ke sath bohot zaroori hai. Traders ko chahiye ke wo apne stop-loss ko pichle high ke upar set karein, taake agar market unke against chali jaaye toh unki losses limited rahein. Yeh strategy risk management ka ek hissa hai jo trading ko zyada safe banata hai.

                          #### 6. Target Setting

                          Is pattern ke zariye target set karna bhi ahem hai. Traders ko apne profit targets ko set karte waqt support levels ka khayal rakhna chahiye. Pehle support levels par profit booking karna aik acha idea ho sakta hai, taake traders apni profits ko secure kar sakein.

                          #### 7. Confirmation Indicators

                          Candlestick patterns ko confirm karne ke liye technical indicators ka istemal karna bohot zaroori hai. Traders ko RSI (Relative Strength Index) ya MACD (Moving Average Convergence Divergence) jese indicators ka istemal karna chahiye taake pattern ki authenticity ko confirm kar sakein.

                          #### 8. Volatility ki Role

                          Yeh pattern tab zyada effective hota hai jab market mein volatility kaafi high ho. High volatility ke doraan, prices ka tezi se girna ya barhna zyada aam hota hai, jo ke yeh pattern ko majbooti deta hai. Isliye traders ko market ki volatility ko dekhna chahiye.

                          #### 9. Risk Management

                          Risk management trading ka ek important pehlu hai. Traders ko apne capital ko protect karne ke liye risk-to-reward ratio ka khayal rakhna chahiye. Yeh unhe yeh samajhne mein madad karta hai ke kis level par unhe risk lena chahiye aur kis level par unhe exit karna chahiye.

                          #### 10. Is Pattern ki Ahmiyat

                          Three Black Crows ka pattern trading mein is liye ahmiyat rakhta hai kyunki yeh ek clear bearish reversal signal deta hai. Iska asar aksar market ke long-term trend par bhi hota hai. Jab yeh pattern banta hai, toh traders ko is par tawajjoh deni chahiye kyunki yeh unhe market ke potential reversals se waqif karata hai.

                          #### 11. Common Mistakes

                          Traders aksar is pattern ko samajhne mein ghaltiyan karte hain. Kuch traders is pattern ko sirf dekh kar trade kar lete hain bina kisi confirmation ke. Yeh ek badi ghalti hai kyunki kisi bhi candlestick pattern ki asal value tab samajh aati hai jab uska confirmation indicators se hota hai.

                          #### 12. Market Conditions

                          Market conditions ka pattern par asar hona bhi zaroori hai. Jab tak market mein downtrend nahi hai, tab tak yeh pattern apna asar nahi dikhata. Isliye traders ko market ke overall trend ko samajhna chahiye taake wo is pattern ka faida utha sakein.

                          #### 13. Practical Application

                          Is pattern ka istemal trading strategies mein bohot aasani se kiya ja sakta hai. Traders ko chahiye ke wo is pattern ko samajhne ke baad practice karte rahein, taake unki trading skills behtar ho sakein. Backtesting karna is pattern ke saath ek acha tareeqa hai taake trader iski effectiveness ko samajh sakein.

                          #### 14. Nakhira Khatam

                          Three Black Crows ka candlestick pattern trading ki duniya mein ek ahem aur powerful tool hai jo bearish reversal ko darshata hai. Is pattern ka istemal karte waqt, traders ko apni strategies ko sahi tarah se plan karna chahiye aur risk management ka khayal rakhna chahiye. Agar yeh sahi tarah se istemal kiya jaaye, toh yeh traders ke liye bohot faida mand sabit ho sakta hai.
                          • #14 Collapse

                            Three Black Crows Candlestick Pattern

                            Taaruf


                            Three Black Crows candlestick pattern aik bearish reversal pattern hai jo aksar uptrend ke baad nazar aata hai. Is pattern ka asar bazar ki mood ko tabdeel karne mein hota hai, aur ye traders ko sell signals dene ke liye mashhoor hai. Is maqale mein hum is pattern ke baare mein tafseeli taur par baat karenge, iski pehchaan, istemal, aur iska maqsad kya hai.
                            Pattern ki Pehchaan


                            Three Black Crows pattern teen consecutive black candlesticks par mabni hota hai. In candlesticks ka rang aksar kaala ya red hota hai, aur inke beech mein koi significant upward movement nahi hoti. Ye pattern tab banta hai jab market mein bearish momentum zyada hota hai, aur is se ye pata chalta hai ke sellers ki shiddat badh rahi hai.
                            Pehli Candlestick


                            Is pattern ki pehli candlestick ek long black body hoti hai. Ye candlestick market mein ek strong bearish sentiment ko dikhati hai. Iski closing price opening price se kaafi neeche hoti hai, jo ye darust karti hai ke sellers ne market par control hasil kar liya hai.
                            Dosri Candlestick


                            Dosri candlestick bhi ek long black body hoti hai jo pehli candlestick ke neeche close hoti hai. Ye pattern ke liye bahut zaroori hai kyunki ye darust karta hai ke sellers ab bhi market par bhari hain aur unhone pehli candlestick ke low ko tod diya hai.
                            Teesri Candlestick


                            Teesri candlestick bhi aik black body hoti hai aur ye dosri candlestick ke neeche close hoti hai. Is candlestick ki presence ye darust karti hai ke market mein bearish pressure ab bhi bana hua hai aur traders ko ye sochne par majboor karti hai ke bullish trend khatam ho gaya hai.
                            Market ki Halaat


                            Three Black Crows pattern aksar tab nazar aata hai jab market pehle se hi bullish trend mein hoti hai. Is pattern ka dikhna yeh darust karta hai ke bullish momentum ab khatam ho raha hai, aur sellers ka bhaari bhai hona market ke mood ko tabdeel kar raha hai.
                            Trading Strategy


                            Is pattern ko samajhkar traders apne trading strategies ko behtar bana sakte hain. Jab ye pattern nazar aaye, toh traders ko sell positions kholne ka sochna chahiye. Lekin, hamesha stop-loss set karna na bhoolen taake market ki unexpected movements se bach sakein.
                            Confirmation ki Zaroorat


                            Three Black Crows pattern ke baad, traders ko confirmation ki zaroorat hoti hai. Ye confirmation kisi aur technical indicator ya pattern se mil sakta hai, jese ke volume ka izafa ya kisi major support level ka tutna. Ye confirmation traders ko ye batata hai ke market mein bearish trend mazboot hai.
                            Risk Management


                            Trading karte waqt risk management ka khayal rakhna bohat zaroori hai. Agar aap Three Black Crows pattern ke sath trade kar rahe hain, toh stop-loss set karna zaroori hai. Is se aap apne losses ko control kar sakte hain agar market aapki khilaaf chale.
                            Market Sentiment


                            Market sentiment ka bhi is pattern par gehra asar hota hai. Agar overall market sentiment bearish hai, toh Three Black Crows pattern ka asar zyada mazboot hota hai. Lekin agar market ka sentiment mixed hai, toh is pattern ka asar kam ho sakta hai.
                            Historical Analysis


                            Is pattern ki pehchan aur istemal ke liye historical analysis ka bhi ahmiyat hai. Traders ko dekhna chahiye ke ye pattern past mein kaise kaam karta hai aur isne kahan successful bearish reversals kiye. Is analysis se traders ko apni trading strategies ko behtar banane mein madad milti hai.
                            Limitations


                            Three Black Crows pattern ki kuch limitations bhi hain. Ye pattern har waqt accurate nahi hota, aur kabhi kabar market unexpected movements dikha sakta hai. Isliye, traders ko hamesha dusre technical indicators ke sath is pattern ka istemal karna chahiye.
                            Conclusion


                            Three Black Crows candlestick pattern traders ko ek behtareen mauka faraham karta hai bearish reversals ko pehchanne ka. Ye pattern aksar strong bearish momentum ka nishan hota hai, lekin traders ko is pattern ko samajhne aur dusre indicators ke sath istemal karne ki zaroorat hai. Risk management aur market sentiment ka khayal rakhna bhi bohat zaroori hai taake successful trading ki ja sake.
                            Aakhir ka Lafz


                            Is maqale ke zariye, humne Three Black Crows candlestick pattern ki tafseelat ko samjha. Is pattern ko pehchan kar, traders apni trading strategies ko mazboot bana sakte hain aur market ke bearish reversals se faida utha sakte hain. Hamesha yaad rakhein, trading ek skill hai jo waqt aur tajurbe se behtar hoti hai.
                            • <a href="https://www.instaforex.org/ru/?x=ruforum">InstaForex</a>
                            • #15 Collapse

                              Three Black Crows Candlestick Pattern: Ek Tafreeqi Taqreeb


                              1. Muqaddima
                              Three Black Crows ka candlestick pattern trading mein ek aham sabak hai. Ye pattern aksar bullish trend ke baad aata hai aur iska maqsad market ke mood ko badalne ki nishani hoti hai. Is pattern ki pehchaan aur iski tafteesh se traders ko ek munasib waqt par positions kholne ya band karne mein madad milti hai.

                              2. Candlestick Patterns ka Ibtidaai Nazariya
                              Candlestick patterns trading ka ek buniyadi hissa hain. Ye patterns market ki price movement ko samajhne ke liye use hote hain. Har candlestick ek khaas waqt ki price movement ko darshati hai, jo ki kharid aur farokht ki majmooi soorat e haal ko bayan karti hai.

                              3. Three Black Crows Pattern ki Shakal
                              Three Black Crows pattern teen consecutive black (yaani red) candlesticks par mushtamil hota hai, jo har ek pichhli candlestick se niche band hoti hai. Ye pattern bullish trend ke baad aata hai aur iski pehchaan karna asaan hai kyunke ye apne samne wali candlestick ke kafi niche band hoti hai.

                              4. Pattern ki Ahmiyat
                              Ye pattern market mein bearish reversal ka nishan hota hai. Jab ye pattern banta hai, to ye is baat ki nishani hoti hai ke market mein sellers ka dominion hai. Ye traders ko yah batata hai ke unhe apne positions ko badalna chahiye ya market se nikal jana chahiye.

                              5. Pattern ka Asal Maqsad
                              Three Black Crows ka asal maqsad market ke bullish sentiment ko khatam karna hai. Ye pattern dikhata hai ke kaise sellers market ko control karte hain, jo ke bullish traders ke liye aik khatar ki nishani hoti hai. Is pattern ko samajhna traders ko risky trades se bacha sakta hai.

                              6. Pattern ki Taqreeb
                              Is pattern ko dekhne ke liye traders ko kisi bullish trend ke baad teen consecutive black candlesticks talash karni chahiye. Har candlestick ka close price pichhli candlestick ke close price se niche hoga. Ye nishani hai ke sellers market ko control kar rahe hain.

                              7. Volume ka Role
                              Three Black Crows pattern ka volume bhi ahmiyat rakhta hai. Agar ye pattern high volume ke saath ban raha ho, to ye is baat ki nishani hai ke market mein sellers ka confidence hai. High volume ke sath banne wala pattern zyada credible hota hai.

                              8. Pattern ka Samna Karna
                              Traders ko is pattern ka samna karte waqt thoda ehtiyaat baratna chahiye. Agar ye pattern banta hai to pehle se tayyar hona chahiye. Ye ek naya bearish trend shuru kar sakta hai, jo ke profit margin ko khatam kar sakta hai agar pehle se tayyar nahi hain.

                              9. Reversal Signals
                              Ye pattern sirf reversal ka signal nahi deta, balki kuch aur technical indicators ke sath milkar zyada strong signal banata hai. Is pattern ko RSI (Relative Strength Index) ya MACD (Moving Average Convergence Divergence) jese indicators ke sath milana traders ke liye behter hota hai.

                              10. Risk Management
                              Three Black Crows pattern ko samajhne ke sath-sath, risk management bhi zaroori hai. Agar aap is pattern ke aas paas trade kar rahe hain, to stop-loss orders ka istemal karna chahiye taake aap apne losses ko control kar sakein. Is se aap market ke unpredictable movements se bach sakte hain.

                              11. Examples aur Case Studies
                              Is pattern ka aik behtareen example stock market mein dekha ja sakta hai. Agar kisi stock ka price pehle kaafi dinon tak barhta raha ho, aur phir suddenly teen black candlesticks ban jayein, to ye ek strong reversal ka nishan hota hai. Is par case studies karke traders ko is pattern ki sahi samajh mil sakti hai.

                              12. Trading Strategies
                              Three Black Crows pattern ke saath trading karne ki kuch strategies hain. Aksar traders is pattern ke baad short position kholte hain ya existing long positions ko band kar dete hain. Is pattern ka istemal karte waqt target price aur stop-loss ko set karna nahi bhoolna chahiye.

                              13. Galtiyon se Seekhna
                              Har trader ko samajhna chahiye ke trading mein galtiyan hoti hain. Ye galtiyan hi traders ko seekhne mein madad karti hain. Is pattern ke sahi istemal se traders ko samajh aata hai ke kaise market ke mood ko samjha jaye aur kis waqt trade kiya jaye.

                              14. Natija
                              Three Black Crows candlestick pattern ek aham trading tool hai. Ye pattern market ki mood ko samajhne aur bearish reversal ki nishani deta hai. Agar traders is pattern ko sahi tarah se samajh kar istemal karein, to ye unhein successful trading mein madad de sakta hai. Market ke har trend ka tajziya karna aur risk management ka khayal rakhna hamesha zaroori hai.


                              اب آن لائن

                              Working...
                              X