Pipe Bottom Candlestick Pattern Ki Pehchan

No announcement yet.
`
X
  • وقت
  • دکھائیں
Clear All
new posts
  • #1 Collapse

    Pipe Bottom Candlestick Pattern Ki Pehchan
    Pipe Bottom Candlestick Pattern Ki Pehchan

    Taaruf


    Forex trading ki duniya mein, candlestick patterns ka kafi ziyada ahmiyat hai. Yeh patterns traders ko market ki ruknatein aur possible reversals ka nazar dete hain. In candlestick patterns mein se aik hai “Pipe Bottom Candlestick Pattern”. Is maqalay mein hum is pattern ki pehchan, iska istemal aur forex trading mein iski ahmiyat ko detail mein samjhenge.
    Pipe Bottom Pattern Ki Pehchan

    1. Definition


    Pipe Bottom Pattern do candlesticks ka aik silsila hai jo market ke reversal ko darshata hai. Yeh aksar bearish trend ke baad aata hai aur inverted hammer ya spinning top ke formaan mein hota hai.
    2. Visual Representation


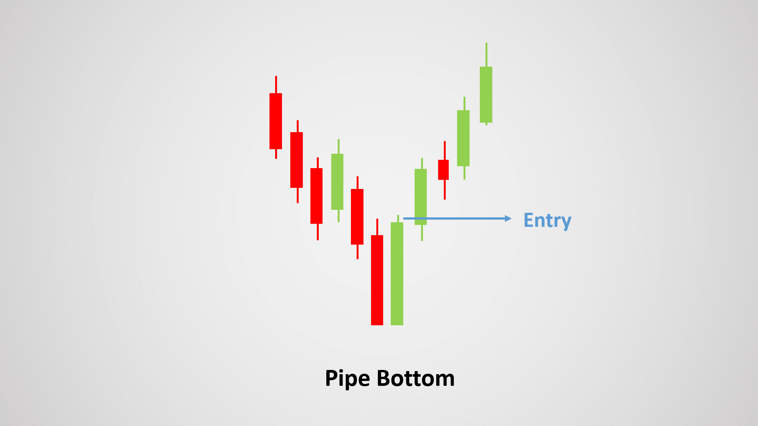
    Is pattern ko dekhne ke liye, sab se pehle aapko do candlesticks ki zaroorat hai:
    • Pehli candlestick neechay ki taraf ek niche banati hai.
    • Doosri candlestick pehle se zyada ujwal (bullish) hoti hai, jo pichhli candlestick ke close price se upar close hoti hai.
    3. Anusaar


    Pipe Bottom Pattern ka anusar yeh signal karta hai ke bearish trend khatam ho raha hai aur bullish trend shuru hone wala hai. Is structure ki pehchan kaafi aasaan hai agar aap candlestick patterns ke rudimentary concepts se waqif hain.
    Forex Trading Mein Istemaal

    1. Entry Points


    Pipe Bottom Pattern ki madad se aap entry point identify kar sakte hain. Jab doosi candlestick ban jaati hai aur yeh first candlestick ke upar close karti hai, tab yeh traders ko yeh khabar deta hai ke market bullish hoti ja rahi hai. Yeh signal hota hai ke aapko buy order place karne chahiye.
    2. Stop Loss


    Is pattern ko istemal karte hue stop loss set karna bhi zaroori hai. Aam tor par stop loss yeh pattern se thoda neeche rakha jata hai, jis se aap apne investment ko zyada se zyada protect kar sakte hain.
    3. Target Price


    Target price set karte waqt, traders kuch days ka historical data dekhte hain jisse unhe previous high ya recent resistance level mil sake.
    Ahmiyat

    1. Market Trends Samajhne Ki Koshish


    Pipe Bottom Candlestick Pattern samjhne par traders ko ek nazar market ke trends par hoti hai. Yeh pattern bullish reversal ko darshata hai, jo ki trend ko samajhne mein madadgar hota hai.
    2. Risk Management


    Is pattern ki madad se risk management bhi sudhar sakti hai. Jab aap stop loss aur target prices ko sahi tareeqe se set karte hain, toh aap apne risks ko behtar tareeqe se handle kar sakte hain.
    3. Emotional Trading Se Bachna


    Yeh pattern traders ko emotional trading se bachne mein madad karta hai. Jab aap kisi structured pattern par base karte hain, toh aapki decisions zyada logical hote hain.
    Fawaid aur Nuqsan

    1. Fawaid

    a. Simple Aur Asaan


    Pipe Bottom Pattern ko samajhna aur identify karna asaan hai, is liye yeh naye traders ke liye bhi kafi faida mand hai.
    b. Accurate Predictions


    Agar sahi tareeqe se istemal kiya jaye, toh yeh pattern market ke reversals ke liye kaafi accurate predictions de sakta hai.
    c. Entry Aur Exit Points


    Yeh pattern entry aur exit points samajhne mein madadgar hota hai, jo traders ko profit kamaane ka mauka deta hai.
    2. Nuqsan

    a. False Signals


    Kuch waqt is pattern se false signals mil sakte hain jisse traders ko losses ka samna karna par sakta hai.
    b. Market Volatility


    Agar market bohot volatile ho, toh yeh pattern achi tarah se kaam nahi karta aur result mein losses ho sakte hain.
    c. Diwali Samajhna


    Aksar traders karar liyatay hain lekin unhe yeh samajh nahi aata ke har candlestick pattern har waqt waise kaam nahi karta, isliye uneh pehlay se hi trade karne se bachna chahiye.
    Conclusion


    Pipe Bottom Candlestick Pattern ek ahem tool hai jo forex trading mein madadgar sabit ho sakta hai. Iski pehchan aur istemal sikh कर, traders apne trades ko behtar tarike se manage kar sakte hain. Lekin hamesha yaad rahe ke kisi bhi trading strategy ka istemal karte waqt apne risk management par khas taur par tawajjoh deni chahiye. Is pattern se fayde uthate waqt, hamesha dhiyan rakhein ke yeh patterns kabhi bhi 100% accurate nahi hote.

    Akhir mein, Forex trading ek art hai, aur jise samajhne aur practice karne ki zaroorat hai. Pipe Bottom Candlestick Pattern is art ka aik zaroori hissa hai, jo understanding aur successful trading mein madadgar sabit ho sakti hai.
  • <a href="https://www.instaforex.org/ru/?x=ruforum">InstaForex</a>
  • #2 Collapse

    Pipe Bottom Candlestick Pattern.

    Introduction.

    Pipe Bottom Candlestick Pattern aik technical analysis ka method hai jo market ke reversal points ko identify karne ke liye istimaal hota hai. Yeh pattern asan taur par bearish trend ke end aur bullish trend ke start ka indication deta hai.

    Pattern Ki Shakal.

    Pipe Bottom Candlestick Pattern do consecutive bearish candlesticks aur do consecutive bullish candlesticks par mushtamil hota hai. Yeh pattern usually nichey (bottom) mein form hota hai. Is pattern ki khasiyat yeh hai ke yeh aik neechay ke baad doosri candlestick ke open aur close points same ya close hote hain.

    Pehli Doosri Bearish Candlestick.

    Pehli bearish candlestick aik lambi body ke sath hoti hai jo ke market mein selling pressure ko darshaati hai. Is candlestick ka shadow chota hota hai jo ke yeh batata hai ke market mein downward trend strong tha.Doosri bearish candlestick bhi pehli ki tarah hoti hai lekin iska closing price pehli candlestick ke close price ke qareeb hota hai. Yeh do bearish candlesticks mil kar neechay ka aik support level banati hain.

    Pehli aur Doosri Bullish Candlestick.

    Pehli bullish candlestick bearish candlesticks ke baad form hoti hai. Yeh candlestick aik lambi body ke sath hoti hai jo ke market mein buying pressure ko darshaati hai. Iska open price pehli bearish candlestick ke close price ke qareeb hota hai.Doosri bullish candlestick bhi pehli ki tarah hoti hai lekin iska close price pehli bullish candlestick ke close price ke qareeb hota hai. Yeh do bullish candlesticks mil kar aik upward trend ko start karti hain.

    Volume Analysis.

    Volume analysis bhi Pipe Bottom Pattern ki pehchan mein madadgar hota hai. Jab pattern form ho raha hota hai to pehli bearish candlestick par volume zyada hoti hai, lekin doosri bearish candlestick par volume kam hoti hai. Phir pehli bullish candlestick par volume barh jati hai jo ke market mein buyers ki mojoodgi ko darshaata hai.

    Confirmation.

    Pipe Bottom Pattern ko confirm karne ke liye traders additional technical indicators ka bhi sahara lete hain. Jaise ke RSI (Relative Strength Index) agar oversold zone mein ho to yeh pattern ki strength ko barhata hai. Moving Averages ko bhi dekh kar traders confirmation lete hain.

    Istimaal.

    Yeh pattern usually short-term trading mein use hota hai. Jab yeh pattern form hota hai to yeh bearish trend ke end aur bullish trend ke start ka indication deta hai. Traders is pattern ko dekh kar buying positions open karte hain taake woh market ke upward movement ka faida utha saken.

    Pipe Bottom Candlestick Pattern ki pehchan aur understanding se traders apne trading strategies ko behtar bana sakte hain. Yeh pattern short-term aur medium-term trading mein bohat faida mand sabit hota hai. Is pattern ki pehchan se traders market mein timely entries aur exits kar sakte hain.
    • #3 Collapse

      ### Pipe Bottom Candlestick Pattern Ki Pehchan

      Pipe Bottom candlestick pattern ek bullish reversal pattern hai jo market mein bottom ya neechay ke level par banta hai. Ye pattern un moments ko indicate karta hai jab selling pressure khatam ho raha hota hai aur buyers market mein aana shuru kar dete hain. Is pattern ko identify karna aur samajhna traders ke liye bohot zaroori hai kyunki ye unhein potential reversal point pe trade karne mein madad de sakta hai.

      #### Pipe Bottom Pattern Ki Structure

      Pipe Bottom pattern do consecutive bearish candles se mil kar banta hai jinki bodies choti hoti hain aur shadows zyada lambi hoti hain. Dono candles ke low points takreeban same hote hain jo support level ko indicate karta hai. Ye pattern tab form hota hai jab pehli bearish candle ke baad, doosri candle bhi bearish hoti hai lekin uski closing price pehli candle se qareeban ya barabar hoti hai.

      **Pattern Ki Characteristics:**

      1. **Do bearish candles:** Pattern mein do lagataar bearish candles hoti hain. Dono candles ka low point takreeban barabar hota hai jo support level ko represent karta hai.

      2. **Long Shadows:** Dono candles ki shadows lambi hoti hain, jo is baat ki taraf ishara karti hain ke market mein sell pressure ke baad buy pressure bhi tha.

      3. **Closing Prices:** Doosri candle ki closing price pehli candle ki closing ke qareeban hoti hai ya us se barabar hoti hai, jo market mein balance ko indicate karta hai.

      #### Pipe Bottom Pattern Ki Pehchan

      Pipe Bottom pattern ko identify karne ke liye, aapko candlestick chart par focus karna hoga. Jab aap dekhen ke do lagataar bearish candles ka low point barabar ho raha hai aur shadows lambi hain, to ye indication hai ke Pipe Bottom pattern ban raha hai. Ye pattern aksar market ke downtrend mein banta hai aur trend reversal ka sign hota hai.

      **Confirmation:**

      1. **Volume:** Pattern ki confirmation ke liye volume ko check karein. Agar doosri candle mein volume zyada hai, to ye sign hai ke buyers market mein interest le rahe hain.

      2. **Third Candle:** Is pattern ke baad agar ek bullish candle form hoti hai jo previous candles ke high ko cross kar deti hai, to ye strong confirmation hai ke market trend reverse karne wala hai.

      #### Pipe Bottom Pattern Ka Istemaal

      Pipe Bottom pattern ka istamaal trading strategy mein effective reversal points identify karne ke liye kiya ja sakta hai. Is pattern ke banne par, traders often long positions initiate karte hain ya existing short positions ko close karte hain. Yeh pattern tab aur bhi significant ho jata hai jab ye kisi strong support level ke qareeban form ho raha ho.

      #### Conclusion

      Pipe Bottom candlestick pattern ek strong bullish reversal signal hai jo market mein bottom ke nazdeek form hota hai. Is pattern ki pehchan aur us ka sahi istamaal kar ke traders significant trading opportunities ko exploit kar sakte hain. Trading mein risk management ka khayal rakhte hue is pattern ko apni strategy mein shaamil karna faydemand ho sakta hai.
      • #4 Collapse

        Pipe Bottom Candlestick Pattern Ki Pehchan in Forex Trading
        1. Taaruf
          Pipe Bottom candlestick pattern forex trading mein ek aham bearish reversal pattern hai. Yeh pattern tab develop hota hai jab market ek lambe downtrend ke baad ek significant reversal signal provide karti hai. Forex trading mein, har trader ko yeh samajhna zaroori hai ke kis tarah se patterns aur signals market ki movement ko predict karte hain. Pipe Bottom pattern bhi aik aise tool hai jo market ke reversal points ko identify karne mein madadgar hota hai. Yeh pattern, jo do distinct candlesticks ka combination hota hai, trading strategies ko behtar aur effective banane mein madad karta hai.

        Is pattern ko pehchan kar, traders ko market ki reversal potential aur trading opportunities ko samajhne mein asani hoti hai. Forex market mein patterns aur indicators ka combination use karke, traders market trends aur movements ko accurately predict kar sakte hain. Pipe Bottom pattern ek strong signal hai jo bearish trend ke khatam hone aur bullish trend ke shuru hone ko indicate karta hai. Is pattern ko samajhkar, traders effective trading decisions le sakte hain aur market ki movement ko better analyze kar sakte hain.

        Forex trading mein patterns ki identification aur unka proper use trading success ke liye zaroori hota hai. Pipe Bottom pattern ki pehchan traders ko potential reversal points identify karne aur apne trading strategy ko optimize karne mein madad karti hai. Yeh pattern, jab sahi market conditions aur technical indicators ke sath use kiya jaye, trading results ko significantly improve kar sakta hai. Traders ko pattern ke formation aur signals ko samajhna chahiye taake woh market ke trends aur movements ko effectively handle kar sakein.
        1. Pattern Ki Tashreeh
          Pipe Bottom pattern ki tashreeh karte waqt, yeh zaroori hai ke aap candlestick chart aur uske elements ko samjhein. Is pattern mein do major candlesticks hoti hain: ek long bearish candlestick aur ek subsequent long bullish candlestick. Pehli candlestick market ke bearish trend ko confirm karti hai, jabke doosri candlestick bullish reversal ko show karti hai. Pehli candlestick ek significant decline ko represent karti hai, jo market ke selling pressure aur weakness ko indicate karti hai.

        Doosri candlestick market mein buying pressure ke badhne ko show karti hai aur yeh indicate karti hai ke bullish trend shuru ho raha hai. Is candlestick ka length pehli candlestick ke comparison mein zyada hoti hai aur closing price bhi pehli candlestick ke closing price se upar hoti hai. Yeh pattern tab complete hota hai jab do candlesticks ek specific sequence mein aati hain aur combined signals market ke reversal point ko signify karte hain.

        Pehli candlestick ki length market ke bearish momentum ko show karti hai aur doosri candlestick market ke bullish reversal ko confirm karti hai. Is pattern ke formation ko accurately samajhne ke liye, candlestick ki length, position, aur closing price par focus karna zaroori hai. Doosri candlestick ka closing price pehli candlestick se upar hona chahiye aur dono candles ke beech ka gap bhi significant hona chahiye. Is pattern ko samajhne aur identify karne ke liye, aapko candlestick charts aur price action ko carefully analyze karna chahiye.
        1. Formation Ka Amal
          Pipe Bottom pattern ka formation tab hota hai jab market ek prolonged downtrend ke baad ek significant bearish candle ke saath close hoti hai. Yeh pattern tab banta hai jab ek strong bearish trend ke baad, ek bullish candlestick emerge hoti hai jo pehli candlestick ke high se upar close hoti hai. Is pattern ki formation ke liye, do consecutive candlesticks zaroori hain: ek long bearish aur ek long bullish. Pehli bearish candlestick market ke continuous decline ko dikhati hai, jabke doosri bullish candlestick market mein buying pressure ke barhne ko indicate karti hai.

        Formation ka amal tab complete hota hai jab pehli bearish candlestick ke baad doosri bullish candlestick market ke bullish reversal ka signal deti hai. Yeh pattern ek strong reversal signal hai jo bearish trend ke khatam hone aur bullish trend ke shuru hone ko indicate karta hai. Pattern ke formation ke dauran, traders ko price action aur market conditions ko closely monitor karna chahiye taake accurate trading decisions le sakein.

        Pehli candlestick ka size bada hona chahiye aur doosri candlestick ka closing price pehli candlestick ke closing price se upar hona chahiye. Yeh pattern ka formation aur uski validity ko check karne ke liye, additional technical indicators aur volume analysis ka use bhi kiya ja sakta hai. Formation ke dauran, market ke overall sentiment aur price action ko samajhna zaroori hota hai taake pattern ke signals ko accurately interpret kiya ja sake.
        1. Pattern Ki Pehchan
          Pipe Bottom pattern ko pehchaanne ke liye, aapko do key factors ko dekhna hota hai: pehli candlestick ki length aur doosri candlestick ki position. Pehli candlestick ka length bada hona chahiye aur doosri candlestick ki closing price pehli candlestick ki closing price se upar honi chahiye. Pattern ke successful formation ke liye, dono candles ke beech ka gap bhi important hota hai. Is pattern ko identify karne ke liye, aapko candlestick charts ko carefully dekhna hota hai.

        Pehli candle ka length market ke bearish momentum ko show karta hai, jabke doosri candle ka bullish nature market ke reversal ko indicate karta hai. Pattern ki pehchan ke liye, aapko market ke price action aur candlestick ki characteristics par focus karna chahiye. Doosri candlestick ke length aur position se, traders ko market ke potential reversal points ko identify karne mein madad milti hai.

        Pattern ki pehchan karte waqt, aapko market ke overall conditions aur technical indicators ko bhi consider karna chahiye. Accurate identification aur analysis se aap effective trading strategies develop kar sakte hain. Pattern ke signals ko market ke conditions ke sath combine karke aap better trading decisions le sakte hain aur market ke movements ko accurately predict kar sakte hain.
        1. Market Conditions
          Pipe Bottom pattern tab zyada effective hota hai jab market ek strong downtrend mein ho. Yeh pattern generally overextended bearish trends ke baad banta hai aur reversal signal ke liye use hota hai. Aapko pattern ko identify karte waqt market ke overall trend aur price action ko consider karna chahiye. Market conditions ka analysis pattern ki effectiveness ko evaluate karne mein madad karta hai aur trading decisions ko accurate banata hai.

        Market conditions ko samajhne ke liye, price action aur trend analysis ko dekhna hota hai. Agar market ek prolonged downtrend mein hai aur Pipe Bottom pattern form hota hai, toh yeh ek strong reversal signal ho sakta hai. Market ke current conditions aur historical trends ko dekhte hue, aap pattern ke potential signals ko assess kar sakte hain aur accurate trading decisions le sakte hain.

        Market conditions ke sath pattern ka combination traders ko accurate trading signals provide kar sakta hai. Market ke overall sentiment aur trend ko samajhna zaroori hota hai takay pattern ke effectiveness ko assess kiya ja sake. Market conditions ko analyze karke aap better trading decisions le sakte hain jo pattern ke signals ko reinforce karti hain aur market ke movements ko accurately predict karti hain.
        1. Trading Signal
          Pipe Bottom pattern ko trading signal ke taur pe use karte waqt, traders ek buy signal dekhte hain jab doosri bullish candlestick ki closing price pehli bearish candlestick ki closing price se upar ho. Yeh signal indicate karta hai ke bearish trend khatam ho raha hai aur bullish trend shuru ho sakta hai. Trading signals ko accurately interpret karna aur unki validity ko check karna zaroori hota hai.

        Trading signal ka interpretation pattern ke formation aur market conditions par depend karta hai. Agar pattern ka signal clear hai aur market conditions bhi supportive hain, toh yeh ek strong buy signal ho sakta hai. Is signal ko confirm karne ke liye, additional technical indicators aur volume analysis ka use bhi kiya ja sakta hai. Accurate signal interpretation se aap better trading strategies develop kar sakte hain jo market ke reversal points ko accurately predict karti hain.

        Signal ke interpretation ke dauran, aapko pattern ke signals ko carefully analyze karna chahiye. Trading decisions ko signals aur market conditions ke combination se evaluate karna zaroori hota hai. Accurate signal interpretation aur proper analysis se aap better trading decisions le sakte hain aur market ke potential reversal points ko accurately identify kar sakte hain.
        1. Entry Point
          Pattern ki confirmation ke baad, traders entry point ke taur pe doosri candlestick ke high ko consider karte hain. Yeh point market ki upward momentum ko confirm karta hai aur aap is point pe buy order place kar sakte hain. Entry point ki selection accurate hona zaroori hai taake aap effective trading kar sakein. Entry point ke selection ke dauran, market ke trend aur pattern ke signals ko consider karna chahiye.

        Entry point ko select karte waqt, traders ko market ki price action aur pattern ke formation ko closely monitor karna hota hai. Doosri candlestick ka high entry point ke liye crucial hota hai kyunki yeh market ke bullish reversal ko confirm karta hai. Entry point ki accuracy trading ke results ko significantly impact kar sakti hai, isliye aapko careful analysis aur pattern ke signals ko follow karna chahiye.

        Entry point ke selection mein, stop loss aur profit target placement ko bhi consider karna zaroori hai. Effective entry point se aap trading ke results ko optimize kar sakte hain aur market ke potential movements ka faida utha sakte hain. Accurate entry point selection aur proper risk management se aap better trading decisions le sakte hain aur market ke signals ko accurately interpret kar sakte hain.
        1. Stop Loss Placement
          Stop loss placement trading ke risk management ka ek important part hota hai. Pipe Bottom pattern ke case mein, stop loss ko pehli bearish candlestick ke low ke paas set karna chahiye. Yeh stop loss placement unexpected market movements se bachata hai aur risk ko manage karne mein madad karta hai. Proper stop loss placement risk management aur trading discipline ko maintain karne mein help karta hai.

        Stop loss placement ke dauran, traders ko market ke volatility aur price action ko consider karna chahiye. Pehli candlestick ke low ko stop loss ke taur pe use karna market ke unexpected movements se protection provide karta hai. Risk management ke principles ko follow karte hue, aap effective stop loss placement aur trading discipline ko maintain kar sakte hain.

        Stop loss placement ke sath, aapko profit targets aur trade management strategies ko bhi define karna chahiye. Proper stop loss placement aur trade management se aap trading ke risks ko minimize kar sakte hain aur potential profits ko maximize kar sakte hain. Risk management ke principles ko follow karke aap better trading decisions le sakte hain aur market ke movements ko effectively handle kar sakte hain.
        1. Profit Taking
          Profit taking ke liye, traders ko target price set karni chahiye jo ke pattern ke formation ke baad expected price movement ko reflect karti hai. Aap apne target ko support levels aur resistance levels ko dekhte hue set kar sakte hain. Profit-taking strategy market conditions aur individual risk tolerance ke hisaab se honi chahiye. Profit targets ko define karte waqt, market ki price action aur pattern ke signals ko consider karna zaroori hai.

        Profit taking ke dauran, aapko market ki overall trend aur price movement ko dekhna chahiye. Target price ko support aur resistance levels ke basis par set karna trading ke results ko significantly impact kar sakta hai. Effective profit-taking strategy se aap apne trading goals ko achieve kar sakte hain aur market ke movement ka faida utha sakte hain. Profit taking ke strategy ko customize karte waqt, aapko apne trading style aur risk tolerance ko bhi consider karna chahiye.

        Profit targets aur risk management ke principles ko follow karke, aap better trading results achieve kar sakte hain. Accurate profit targets aur risk management se trading decisions ko optimize kiya ja sakta hai aur market ke signals ko effectively interpret kiya ja sakta hai. Profit-taking decisions ko market conditions aur trading strategy ke sath align karna zaroori hai.
        1. Volume Analysis
          Pipe Bottom pattern ke sath volume analysis bhi zaroori hota hai. Increased volume during the formation of the pattern indicate karta hai ke reversal ke chances zyada hain. Volume analysis pattern ki strength ko confirm karne mein madad karta hai aur trade ki reliability ko badhata hai. Volume ko analyze karte waqt, aapko pattern ke formation aur market ke overall conditions ko dekhna chahiye.

        Volume analysis se aap pattern ki effectiveness ko better samajh sakte hain. Agar pattern ke formation ke dauran volume high hai, toh yeh market ke bullish reversal ke chances ko indicate karta hai. Volume ki increase se aap pattern ke signals ko confirm kar sakte hain aur trading decisions ko behtar bana sakte hain. Volume analysis ke sath, aapko pattern ke signals aur market conditions ko combine karke trading strategy develop karni chahiye.

        Volume analysis se aapko market ke movements aur trends ka clear picture milta hai, jo trading decisions ko accurate banata hai. Effective volume analysis se trading ke results improve ho sakte hain aur market ke potential signals ko better identify kiya ja sakta hai. Volume analysis ke sath, aapko trading strategy ko optimize karna chahiye taake aap market ke signals ko accurately interpret kar sakein.
        1. Pattern Ki Limitations
          Har pattern ki limitations hoti hain aur Pipe Bottom pattern bhi inse makhlooq nahi hai. Yeh pattern kabhi kabhi false signals bhi generate kar sakta hai agar market conditions ya price action expected trend ke against ho. Isliye, pattern ko other technical indicators ke sath combine karna chahiye. Limitations ko samajhne ke baad, aap pattern ke signals ko accurately evaluate kar sakte hain.

        Pattern ke limitations ke bawajood, yeh pattern ek useful tool ho sakta hai jab sahi market conditions aur technical indicators ke sath use kiya jaye. False signals ko identify karne ke liye, aapko pattern ke sath additional indicators aur volume analysis ka bhi use karna chahiye. Pattern ki limitations ko samajhkar aur trading strategy ko optimize karke aap better results achieve kar sakte hain.

        Limitations ke sath, aapko market conditions aur price action ko bhi closely monitor karna chahiye. Pattern ke signals ko other technical factors ke sath combine karke trading ke results ko improve kiya ja sakta hai. Limitations ko consider karke aap apne trading approach ko refine kar sakte hain aur market ke signals ko better interpret kar sakte hain.
        1. Pattern Ke Examples
          Real-life trading charts par Pipe Bottom pattern ki pehchaan aur uski effectiveness ko dekhna zaroori hota hai. Historical charts aur past patterns ko analyse karne se traders ko yeh samajhne mein madad milti hai ke pattern ka formation aur performance market conditions ke hisaab se kaise vary hota hai. Examples ke through aap pattern ki real-world application aur effectiveness ko better samajh sakte hain.

        Historical charts ko analyze karte waqt, aapko pattern ke formation aur uske signals ko dekhna chahiye. Examples ke zariye, aap pattern ki reliability aur market ke response ko evaluate kar sakte hain. Real-life examples traders ko pattern ke accurate application aur trading decisions ko better samajhne mein madad dete hain.

        Examples ko dekh kar aap pattern ke sahi formation aur trading signals ko identify kar sakte hain. Historical data aur past performance se aapko pattern ki effectiveness aur potential risks ko samajhne mein madad milti hai. Examples ke analysis se aap apne trading strategy ko enhance kar sakte hain aur pattern ke signals ko accurately interpret kar sakte hain.
        1. Additional Indicators
          Pipe Bottom pattern ko confirm karne ke liye, aap additional indicators jaise RSI (Relative Strength Index) aur MACD (Moving Average Convergence Divergence) ka use kar sakte hain. Yeh indicators pattern ke signals ko reinforce karte hain aur trade ke decision-making process ko strengthen karte hain. Additional indicators ka use trading signals ko confirm karne aur pattern ke effectiveness ko improve karne mein madad karta hai.

        RSI aur MACD jaise indicators pattern ke signals ko support karte hain aur market ke reversal points ko identify karne mein madadgar hote hain. RSI overbought aur oversold conditions ko identify karta hai, jabke MACD trend changes aur momentum ko indicate karta hai. In indicators ka combination pattern ke signals ko confirm karne aur trading strategy ko optimize karne mein madad karta hai.

        Additional indicators ke sath pattern ke signals ko combine karke aap trading ke decisions ko accurate aur reliable bana sakte hain. Indicators ki analysis se aap pattern ki strength aur market ke potential movements ko better samajh sakte hain. Effective use of indicators se trading results ko improve kiya ja sakta hai aur market ke signals ko accurately interpret kiya ja sakta hai.
        1. Conclusion
          Pipe Bottom candlestick pattern forex trading mein ek effective tool hai jo bearish trends ke reversal ko identify karne mein madad karta hai. Is pattern ko successfully implement karne ke liye, accurate identification, proper entry aur exit points, stop loss placement aur volume analysis zaroori hai. Trading strategies ko pattern ke signals aur market conditions ke hisaab se customize karna chahiye taake effective trading results mil sakein.

        Pattern ki effective implementation ke liye, aapko market conditions aur pattern ke signals ko carefully analyze karna chahiye. Accurate entry points, stop loss placement aur profit-taking strategies se aap trading ke results ko optimize kar sakte hain. Effective use of Pipe Bottom pattern aur additional indicators se aap better trading decisions le sakte hain aur market ke potential reversal points ko accurately identify kar sakte hain.

        Pattern ki pehchan aur effective use trading strategy ko enhance karne mein madad karta hai. Forex market mein successful trading ke liye, aapko patterns, indicators aur market conditions ke combination se informed decisions lene chahiye. Pipe Bottom pattern ek useful tool hai jo aapko market ke reversal points identify karne aur trading decisions ko improve karne mein madad karta ha
        • #5 Collapse

          Interpret Pipe Bottom Candlestick Pattern in Forex Trading.

          Introduction.

          Candlesticks ka istemaal forex trading mein bohat aham hota hai. Pipe Bottom Candlestick Pattern forex traders ke liye bohat important hai. Is article mein hum Pipe Bottom Candlestick Pattern ke bare mein baat karenge.

          Click image for larger version

Name:	1D208DF1-3301-4007-A943-DA5DBC7D20BC.jpeg
Views:	24
Size:	35.5 کلوبائٹ
ID:	13075847

          What is Pipe Bottom Candlestick Pattern?

          Pipe Bottom Candlestick Pattern ka matlab hota hai ke market mein bearish trend ke baad bullish trend shuru hone wala hai. Jab market mein bearish trend hota hai to traders ko sell karna hota hai. Jab market mein bullish trend shuru hota hai to traders ko buy karna hota hai. Pipe Bottom Candlestick Pattern bullish trend ki shuruat hoti hai.

          Click image for larger version

Name:	18B1F17D-FE81-43E7-B45A-2E7689EC6609.jpeg
Views:	21
Size:	45.7 کلوبائٹ
ID:	13075848

          Recognition of Pipe Bottom Candlestick Pattern.

          Pipe Bottom Candlestick Pattern ki pehchan karne ke liye traders ko candlesticks ki knowledge honi chahiye. Agar traders ko candlesticks ki knowledge nahi hai to wo Pipe Bottom Candlestick Pattern ki pehchan nahi kar sakte. Pipe Bottom Candlestick Pattern mein 3 candles hote hain. Pehli candle bearish hoti hai, dusri candle bhi bearish hoti hai aur teesri candle bullish hoti hai. Teesri candle ki closing price dusri candle ki closing price se upar honi chahiye.

          Click image for larger version

Name:	91535BD7-E302-45F8-B284-66C1B31D2ABE.jpeg
Views:	18
Size:	36.7 کلوبائٹ
ID:	13075849

          Trade Entry of Pipe Bottom Candlestick Pattern.

          Pipe Bottom Candlestick Pattern ki trade entry ke liye traders ko teesri candle ki closing price se upar buy karna hota hai. Stop loss ke liye traders dusri candle ki low price se stop loss laga sakte hain. Take profit ke liye traders ko market trend ke hisaab se take profit level set karna chahiye.

          Click image for larger version

Name:	C6A5A7DC-E61D-480B-83ED-FE12FB4CAA06.png
Views:	18
Size:	6.1 کلوبائٹ
ID:	13075850

          Note:-

          Pipe Bottom Candlestick Pattern forex trading mein bohat important hai. Traders ko iski pehchan karni chahiye aur sahi time par buy karna chahiye. Stop loss aur take profit level ko market trend ke hisaab se set karna chahiye.
          • #6 Collapse

            Pipe Bottom Candlestick Pattern Ki Pehchan
            1. Pipe Bottom Pattern Ka Ta'aruf


            Pipe Bottom candlestick pattern trading aur technical analysis me ek bohot ahmiyat rakhta hai. Yeh pattern bearish trend ke baad appear hota hai aur yeh market me bullish reversal ka indication deta hai. Jab market me lagataar price gir rahi hoti hai aur ek waqt aata hai jab buyers market me enter hote hain aur price ko upar push karte hain, tab Pipe Bottom pattern banta hai. Yeh pattern traders ko market ke bottom ko identify karne me madad karta hai.

            Is pattern ka naam “Pipe Bottom” is liye rakha gaya hai kyunki yeh pipes ki tarah seedha aur parallel lagta hai. Yeh pattern do consecutive bullish candlesticks par mabni hota hai jo ek dousre ke kareeb hote hain. Pehli candlestick bearish hoti hai aur doosri candlestick bullish hoti hai. Dono candlesticks ka length lagbhag barabar hota hai aur yeh market me trend reversal ko zahir karta hai.

            Pipe Bottom pattern ko dekhne ke liye traders usually daily charts ka istemal karte hain. Yeh pattern hourly ya weekly charts par bhi dekha ja sakta hai lekin daily charts par yeh zyada clear hota hai. Is pattern ko pehchan karna thoda mushkil ho sakta hai agar market me zyada volatility ho. Is liye, hamesha confirmation signals ka wait karna chahiye taake false signals se bacha ja sake.

            Pipe Bottom pattern ko samajhne ke liye pehle aapko candlestick patterns ka basic knowledge hona chahiye. Candlestick patterns market ke sentiment ko reflect karte hain aur yeh batate hain ke market me buyers aur sellers kaise behave kar rahe hain. Pipe Bottom pattern ek bullish reversal pattern hai jo batata hai ke market ab bottom se recover karne wala hai.
            2. Candlestick Pattern Ki Ahmiyat


            Candlestick patterns trading me bohot important role play karte hain. Yeh patterns market ke sentiment ko reflect karte hain aur price movements ko predict karne me madad dete hain. Candlestick patterns traders ko market ki psychology ko samajhne aur future price movements ka andaza lagane me madad karte hain. Har candlestick pattern ka apna significance hota hai aur yeh different market conditions me different signals dete hain.

            Candlestick patterns ka istemal technical analysis me bohot purana hai. Japanese traders ne 18th century me in patterns ka istemal shuru kiya tha aur tab se yeh duniya bhar me popular ho gaye hain. Candlestick patterns ko dekh kar traders market ke trend ko identify karte hain aur trading decisions lete hain. Yeh patterns market me bullish aur bearish trends ko identify karne me bohot madadgar hote hain.

            Candlestick patterns ki bohot saari types hoti hain jismein bullish, bearish, reversal aur continuation patterns shamil hain. Har pattern ka apna ek unique structure hota hai aur yeh different market scenarios ko represent karta hai. Bullish patterns market me upward trend ko zahir karte hain jab ke bearish patterns downward trend ko indicate karte hain. Reversal patterns market ke trend me change ka indication dete hain jab ke continuation patterns current trend ke continuation ko zahir karte hain.

            Candlestick patterns ko dekhne ke liye aapko charts aur technical indicators ka istemal karna chahiye. Yeh patterns standalone nahi hote balki inhe dekhne ke liye aapko market ke overall context ko samajhna zaroori hai. Candlestick patterns ko dekh kar aapko trendlines, support aur resistance levels ko bhi consider karna chahiye taake aapko ek comprehensive view mile.

            Candlestick patterns ka istemal trading strategies me bhi hota hai. Traders in patterns ko dekh kar entry aur exit points decide karte hain. Yeh patterns risk management me bhi madadgar hote hain kyunki yeh aapko stop loss aur take profit levels set karne me madad karte hain. Hamesha yeh yaad rakhein ke candlestick patterns 100% accurate nahi hote is liye aapko inhe other technical tools aur indicators ke saath milakar use karna chahiye.
            3. Pipe Bottom Pattern Kaisa Dikhta Hai?


            Pipe Bottom pattern ko dekh kar aapko do consecutive candlesticks dikhai deni chahiye jo lagbhag same size ki hoti hain. Pehli candlestick bearish hoti hai jo market me selling pressure ko zahir karti hai. Iski closing price low hoti hai jo batati hai ke sellers abhi bhi control me hain. Doosri candlestick bullish hoti hai jo market me buying interest ko reflect karti hai. Iski opening price pehli candlestick ki closing price ke kareeb hoti hai aur yeh significantly upar close hoti hai.

            Yeh pattern tab banta hai jab market me bearish trend hota hai aur price continuously gir rahi hoti hai. Jab price ek certain level par pohanchti hai, buyers market me enter hote hain aur price ko upar push karte hain. Yeh buying pressure ek bullish candlestick banata hai jo pehli bearish candlestick ke opposite hota hai. Dono candlesticks lagbhag barabar size ki hoti hain jo market me strong reversal signal ko indicate karti hain.

            Pipe Bottom pattern ko dekhne ke liye aapko daily charts ka istemal karna chahiye. Yeh pattern hourly charts par bhi dekha ja sakta hai lekin daily charts par yeh zyada clear hota hai. Is pattern ko dekh kar aapko market ke trend ko identify karna asaan ho jata hai. Agar aapko yeh pattern dekhai de, to yeh ek indication ho sakta hai ke market me bullish reversal hone wala hai.

            Is pattern ka ek unique characteristic yeh hai ke iski dono candlesticks ki length lagbhag barabar hoti hai. Yeh batata hai ke market me dono sides (buyers aur sellers) me equal strength hai. Jab buyers ka pressure zyada hota hai to bullish candlestick zyada powerful hoti hai jo market me bullish reversal ko confirm karti hai.

            Pipe Bottom pattern ko samajhne ke liye aapko candlestick charting ki basic knowledge honi chahiye. Yeh pattern market me trend reversal ka ek strong signal hota hai lekin hamesha isko confirmation signals ke saath use karna chahiye. Agar market me zyada volatility ho, to yeh pattern false signals de sakta hai is liye aapko other technical indicators ka bhi istemal karna chahiye.
            4. Bearish Trend Ki Shanakht


            Pipe Bottom pattern ko pehchanne ke liye sabse pehle bearish trend ki shanakht zaroori hai. Bearish trend wo hota hai jab market me prices consistently gir rahi hoti hain aur sellers dominate kar rahe hote hain. Yeh trend tab hota hai jab market me negative sentiment hota hai aur investors stocks ko bech rahe hote hain.

            Bearish trend ko identify karne ke liye aapko price chart ko dekhna chahiye. Agar price lagataar lower highs aur lower lows bana rahi hai to yeh bearish trend ki nishani hoti hai. Is trend me market ka sentiment negative hota hai aur investors future me prices ke girne ka andaza laga rahe hote hain. Yeh trend market me pessimism ko zahir karta hai aur yeh tab tak continue hota hai jab tak market me bullish sentiment na aaye.

            Bearish trend ke dauran market me selling pressure zyada hota hai aur buyers kam hote hain. Yeh pressure prices ko niche push karta hai aur yeh trend tab tak chalta hai jab tak market me koi positive news ya catalyst na aaye. Bearish trend ke dauran volume bhi zyada hota hai jo market me sellers ke dominance ko reflect karta hai.

            Bearish trend me technical indicators ka istemal karke aap trend ko identify kar sakte hain. Moving averages, RSI aur MACD jaise indicators bearish trend ko confirm karte hain. Jab price moving average se niche hoti hai aur RSI oversold zone me hota hai to yeh bearish trend ko indicate karta hai. MACD indicator bhi bearish crossover show karta hai jo bearish trend ko confirm karta hai.

            Pipe Bottom pattern ko pehchanne ke liye aapko bearish trend ke saath-saath market ke sentiment ko bhi dekhna chahiye. Agar market me news ya events negative hain to yeh bearish trend ko support karte hain. Bearish trend ke dauran investors market me cautious rehte hain aur prices ke further girne ka andaza laga rahe hote hain. Is trend me Pipe Bottom pattern market me bullish reversal ka pehla signal deta hai jo traders ke liye bohot valuable hota hai.
            5. Pehli Candlestick Ki Ahmiyat


            Pipe Bottom pattern me pehli candlestick bohot ahmiyat rakhti hai. Yeh candlestick bearish hoti hai jo market me selling pressure ko zahir karti hai. Iski closing price low hoti hai jo batati hai ke sellers abhi bhi control me hain. Pehli candlestick ka size aur shape market ke sentiment ko reflect karta hai aur yeh batata hai ke market me abhi bhi negative sentiment hai.

            Pehli candlestick ka length market ke selling pressure ko indicate karta hai. Agar yeh candlestick bohot lambi hai to yeh batata hai ke market me selling pressure bohot zyada hai aur sellers dominate kar rahe hain. Yeh candlestick market ke bearish trend ko confirm karti hai aur yeh signal deti hai ke market abhi bhi downward trend me hai.

            Pehli candlestick ka color bhi important hota hai. Yeh candlestick usually red hoti hai jo market me negative sentiment ko zahir karti hai. Red color buyers ke liye caution signal hota hai aur yeh batata hai ke market me abhi bhi selling pressure hai. Pehli candlestick market me pessimism ko reflect karti hai aur yeh indicate karti hai ke market me abhi bhi sellers dominate kar rahe hain.

            Pehli candlestick ka closing price bhi important hota hai. Agar yeh candlestick low close hoti hai to yeh batata hai ke market me abhi bhi selling pressure hai. Closing price market ke sentiment ko zahir karti hai aur yeh batati hai ke market me abhi bhi negative sentiment hai. Pehli candlestick ka closing price market ke future trend ko indicate karta hai.

            Pehli candlestick ke baad agar market me buying pressure aata hai to yeh market ke trend me reversal ka indication hota hai. Pipe Bottom pattern me pehli candlestick market ke bearish trend ko confirm karti hai aur doosri candlestick bullish reversal ka signal deti hai. Pehli candlestick market ke sentiment ko reflect karti hai aur yeh batati hai ke market me abhi bhi sellers dominate kar rahe hain.
            6. Doosri Candlestick Ki Ahmiyat


            Pipe Bottom pattern me doosri candlestick ki bohot ahmiyat hoti hai. Yeh candlestick bullish hoti hai jo market me buying interest ko reflect karti hai. Iski opening price pehli candlestick ki closing price ke kareeb hoti hai aur yeh significantly upar close hoti hai. Doosri candlestick market me reversal ka pehla signal deti hai aur yeh indicate karti hai ke market me buyers enter ho rahe hain.

            Doosri candlestick ka size aur shape market ke buying pressure ko indicate karta hai. Agar yeh candlestick bohot lambi hai to yeh batata hai ke market me strong buying pressure hai aur buyers dominate kar rahe hain. Yeh candlestick market ke reversal trend ko confirm karti hai aur yeh signal deti hai ke market ab bullish trend me enter ho rahi hai.

            Doosri candlestick ka color bhi important hota hai. Yeh candlestick usually green hoti hai jo market me positive sentiment ko zahir karti hai. Green color sellers ke liye caution signal hota hai aur yeh batata hai ke market me abhi buying pressure hai. Doosri candlestick market me optimism ko reflect karti hai aur yeh indicate karti hai ke market me buyers dominate kar rahe hain.

            Doosri candlestick ka closing price bhi important hota hai. Agar yeh candlestick high close hoti hai to yeh batata hai ke market me abhi bhi buying pressure hai. Closing price market ke sentiment ko zahir karti hai aur yeh batati hai ke market me abhi bhi positive sentiment hai. Doosri candlestick ka closing price market ke future trend ko indicate karta hai.

            Doosri candlestick ke baad agar market me buying pressure continue hota hai to yeh market ke trend me reversal ka indication hota hai. Pipe Bottom pattern me doosri candlestick market ke bullish trend ko confirm karti hai aur yeh signal deti hai ke market ab bullish trend me enter ho rahi hai. Doosri candlestick market ke sentiment ko reflect karti hai aur yeh batati hai ke market me ab buyers dominate kar rahe hain.
            7. Volume Analysis Ki Ahmiyat


            Pipe Bottom pattern ko dekhte waqt volume analysis bohot zaroori hai. Volume market ke buying aur selling pressure ko zahir karta hai aur yeh batata hai ke market me kitna interest hai. Volume analysis se traders ko market ke sentiment aur trend ko samajhne me madad milti hai. Jab Pipe Bottom pattern banta hai to volume analysis strong bullish reversal signal ko confirm karta hai.

            Volume ka increase doosri candlestick ke saath bohot significant hota hai. Agar doosri candlestick ke dauran volume pehli candlestick ke muqable me zyada ho, to yeh strong buying pressure ko zahir karta hai. Yeh batata hai ke market me buyers zyada active hain aur market me bullish sentiment hai. High volume doosri candlestick ke saath bullish reversal ko confirm karta hai.

            Volume analysis se aapko market ke strength aur trend ko samajhne me madad milti hai. Agar volume low hai to yeh batata hai ke market me interest kam hai aur yeh bullish reversal signal ko weak karta hai. High volume market ke strength ko indicate karta hai aur yeh batata hai ke market me strong buying pressure hai. Volume analysis market ke sentiment ko confirm karta hai.

            Volume analysis ke liye aapko different technical indicators ka istemal karna chahiye. Volume Moving Average, On-Balance Volume (OBV) aur Volume Oscillator jaise indicators market ke volume ko analyze karte hain. Yeh indicators market ke volume trend ko reflect karte hain aur yeh batate hain ke market me buying ya selling pressure zyada hai. Volume indicators se aapko market ke sentiment aur trend ko samajhne me madad milti hai.

            Volume analysis ke saath aapko price action ko bhi dekhna chahiye. Agar price action bullish hai aur volume bhi increase ho raha hai to yeh strong bullish reversal signal ko indicate karta hai. Volume analysis se aapko market ke trend aur sentiment ko confirm karne me madad milti hai. Volume analysis se aapko market me strong bullish reversal signal milta hai jo trading decisions lene me bohot madadgar hota hai.
            8. Confirmation Ki Zaroorat


            Pipe Bottom pattern tabhi confirm hota hai jab iske baad wali candles bhi bullish ho. Yeh confirmation zaroori hai taake false signals se bacha ja sake. Confirmation se aapko market ke trend aur sentiment ko confirm karne me madad milti hai. Confirmation ke bina aapko false signals mil sakte hain jo trading decisions me galtiyan karwa sakte hain.

            Confirmation ke liye aapko market ke price action aur volume ko dekhna chahiye. Agar Pipe Bottom pattern ke baad market me bullish candles banti hain aur volume increase hota hai to yeh strong bullish reversal signal ko confirm karta hai. Price action aur volume market ke trend aur sentiment ko zahir karte hain aur yeh confirmation signal dete hain.

            Confirmation ke liye aapko technical indicators ka bhi istemal karna chahiye. Moving Averages, RSI aur MACD jaise indicators market ke trend ko confirm karte hain. Jab price Moving Average se upar hoti hai aur RSI overbought zone me hota hai to yeh bullish trend ko confirm karta hai. MACD indicator bhi bullish crossover show karta hai jo bullish trend ko confirm karta hai.

            Confirmation ke liye aapko support aur resistance levels ko bhi dekhna chahiye. Agar market me support level break hota hai aur price upar jaati hai to yeh bullish trend ko confirm karta hai. Support aur resistance levels market ke trend aur sentiment ko reflect karte hain aur yeh confirmation signal dete hain. Confirmation ke bina trading decisions lena risky ho sakta hai.

            Confirmation ke baad aapko market me entry aur exit points decide karne chahiye. Confirmation se aapko market ke trend aur sentiment ko samajhne me madad milti hai. Confirmation ke baad aapko stop loss aur take profit levels set karne chahiye taake aapko maximum profit ho aur minimum loss ho. Confirmation se aapko trading decisions lene me madad milti hai.
            9. Stop Loss Aur Take Profit Levels


            Pipe Bottom pattern trade karte waqt stop loss aur take profit levels set karna zaroori hai. Stop loss aur take profit levels se aapko apne trades ko manage karne me madad milti hai. Yeh levels aapko market ke trend aur sentiment ko madde nazar rakhte huye set karne chahiye. Stop loss aur take profit levels se aapko maximum profit ho aur minimum loss ho.

            Stop loss usually pehli candlestick ke low par set kiya jata hai. Pehli candlestick ka low market ke lowest point ko zahir karta hai aur yeh stop loss level ko set karne ke liye best point hota hai. Stop loss level se aapko market me unexpected moves se bacha ja sakta hai. Stop loss level se aapko apne trades ko manage karne me madad milti hai.

            Take profit levels resistance levels ke kareeb hotay hain. Resistance levels market ke upper points ko zahir karte hain jahan se price reverse ho sakti hai. Take profit levels se aapko apne profits ko secure karne me madad milti hai. Take profit levels se aapko market ke trend aur sentiment ko samajhne me madad milti hai. Take profit levels se aapko maximum profit ho sakta hai.

            Stop loss aur take profit levels set karne ke liye aapko market ke trend aur sentiment ko samajhna zaroori hai. Yeh levels technical analysis aur market ke overall context ko dekh kar set karne chahiye. Stop loss aur take profit levels se aapko apne trades ko manage karne me madad milti hai. Yeh levels aapko market ke unexpected moves se bacha sakte hain.

            Stop loss aur take profit levels ko regularly review karna chahiye. Market me changes aur volatility ke sath yeh levels adjust karne chahiye. Stop loss aur take profit levels se aapko market ke trend aur sentiment ko samajhne me madad milti hai. Yeh levels aapko trading decisions lene me madadgar hote hain. Stop loss aur take profit levels se aapko apne trades ko effectively manage karne me madad milti hai.
            10. Pipe Bottom Pattern Ki Example


            Ek example mein agar kisi stock ka price $50 se $40 tak girta hai aur phir $40 se $42 tak bullish candlestick banata hai, yeh Pipe Bottom pattern ho sakta hai. Pehli candlestick $50 se $40 tak girti hai aur yeh market me strong selling pressure ko zahir karti hai. Doosri candlestick $40 se $42 tak upar jaati hai aur yeh market me strong buying pressure ko indicate karti hai.

            Yeh pattern market me trend reversal ko zahir karta hai. Pehli candlestick bearish hoti hai jo market me selling pressure ko zahir karti hai. Iski closing price low hoti hai jo batati hai ke sellers abhi bhi control me hain. Doosri candlestick bullish hoti hai jo market me buying interest ko reflect karti hai. Iski opening price pehli candlestick ki closing price ke kareeb hoti hai aur yeh significantly upar close hoti hai.

            Is example me agar volume analysis dekha jaye to doosri candlestick ke dauran volume pehli candlestick ke muqable me zyada hota hai. Yeh strong buying pressure ko zahir karta hai aur yeh batata hai ke market me buyers zyada active hain. High volume doosri candlestick ke saath bullish reversal ko confirm karta hai. Volume analysis market ke sentiment ko reflect karta hai.

            Is example me agar market ke technical indicators dekhe jaye to Moving Averages, RSI aur MACD bullish trend ko confirm karte hain. Jab price Moving Average se upar hoti hai aur RSI overbought zone me hota hai to yeh bullish trend ko confirm karta hai. MACD indicator bhi bullish crossover show karta hai jo bullish trend ko confirm karta hai. Technical indicators market ke trend ko reflect karte hain.

            Is example me agar support aur resistance levels dekhe jaye to price resistance level ko break karti hai aur upar jaati hai. Yeh bullish trend ko confirm karta hai. Support aur resistance levels market ke trend aur sentiment ko reflect karte hain aur yeh confirmation signal dete hain. Confirmation ke baad market me entry aur exit points decide karne chahiye. Stop loss aur take profit levels set karne chahiye.
            11. Trading Strategy


            Pipe Bottom pattern dekh kar traders usually long position enter karte hain. Lekin hamesha market conditions aur confirmation signals ko madde nazar rakhte huye trade karna chahiye. Trading strategy banate waqt aapko market ke trend aur sentiment ko samajhna zaroori hai. Trading strategy se aapko market me entry aur exit points decide karne me madad milti hai.

            Trading strategy ke liye aapko technical analysis aur market ke overall context ko dekhna chahiye. Moving Averages, RSI aur MACD jaise technical indicators market ke trend ko reflect karte hain. Support aur resistance levels market ke trend aur sentiment ko zahir karte hain. Technical analysis se aapko market ke trend aur sentiment ko samajhne me madad milti hai.

            Trading strategy banate waqt aapko risk management ko bhi consider karna chahiye. Stop loss aur take profit levels set karne chahiye taake aapko maximum profit ho aur minimum loss ho. Risk management se aapko market me unexpected moves se bacha ja sakta hai. Trading strategy se aapko apne trades ko effectively manage karne me madad milti hai.

            Trading strategy banate waqt aapko market ke volume ko bhi dekhna chahiye. Volume analysis market ke buying aur selling pressure ko zahir karta hai. High volume market ke strength ko indicate karta hai aur yeh strong buying pressure ko reflect karta hai. Volume analysis se aapko market ke trend aur sentiment ko samajhne me madad milti hai. Volume analysis market ke trend ko confirm karta hai.

            Trading strategy ko regularly review karna chahiye. Market me changes aur volatility ke sath trading strategy ko adjust karna chahiye. Trading strategy se aapko market ke trend aur sentiment ko samajhne me madad milti hai. Yeh strategy aapko trading decisions lene me madadgar hoti hai. Trading strategy se aapko apne trades ko effectively manage karne me madad milti hai.
            12. Risk Management


            Pipe Bottom pattern trade karte waqt risk management bohot zaroori hai. Risk management se aapko market ke unexpected moves se bacha ja sakta hai. Risk management se aapko apne trades ko effectively manage karne me madad milti hai. Risk management se aapko maximum profit ho aur minimum loss ho.

            Risk management ke liye aapko stop loss aur take profit levels set karne chahiye. Stop loss level usually pehli candlestick ke low par set kiya jata hai. Take profit levels resistance levels ke kareeb hotay hain. Stop loss aur take profit levels se aapko market ke trend aur sentiment ko samajhne me madad milti hai. Yeh levels aapko market me unexpected moves se bacha sakte hain.

            Risk management ke liye aapko position size ko bhi control karna chahiye. Position size market ke trend aur sentiment ko madde nazar rakh kar set karni chahiye. Position size ko control karne se aapko market me maximum profit ho sakta hai. Position size ko adjust karte waqt aapko market ke volume aur volatility ko bhi consider karna chahiye.

            Risk management ke liye aapko trading plan bhi banana chahiye. Trading plan se aapko market ke trend aur sentiment ko samajhne me madad milti hai. Trading plan me aapko apne entry aur exit points, stop loss aur take profit levels ko define karna chahiye. Trading plan se aapko market ke unexpected moves se bacha ja sakta hai.

            Risk management ko regularly review karna chahiye. Market me changes aur volatility ke sath risk management strategy ko adjust karna chahiye. Risk management se aapko market ke trend aur sentiment ko samajhne me madad milti hai. Yeh strategy aapko trading decisions lene me madadgar hoti hai. Risk management se aapko apne trades ko effectively manage karne me madad milti hai.
            13. Historical Performance


            Pipe Bottom pattern ki historical performance ko dekhna bhi zaroori hai. Yeh dekhna chahiye ke is pattern ne past me kis tarah se perform kiya aur kitne successful trades generate kiye. Historical performance se aapko market ke trend aur sentiment ko samajhne me madad milti hai. Historical performance se aapko market ke future trend ko predict karne me madad milti hai.

            Historical performance ko dekhne ke liye aapko market ke past price charts aur data ko analyze karna chahiye. Price charts market ke trend aur sentiment ko zahir karte hain. Historical data market ke trend aur sentiment ko reflect karta hai. Price charts aur historical data se aapko market ke trend aur sentiment ko samajhne me madad milti hai.

            Historical performance ko dekhne ke liye aapko different timeframes ko analyze karna chahiye. Daily, weekly aur monthly timeframes market ke trend aur sentiment ko zahir karte hain. Different timeframes se aapko market ke long-term aur short-term trend ko samajhne me madad milti hai. Historical performance se aapko market ke future trend ko predict karne me madad milti hai.

            Historical performance ko dekhne ke liye aapko technical indicators ka bhi istemal karna chahiye. Moving Averages, RSI aur MACD jaise indicators market ke trend ko reflect karte hain. Technical indicators market ke trend aur sentiment ko zahir karte hain. Technical indicators se aapko market ke trend aur sentiment ko samajhne me madad milti hai.

            Historical performance ko regularly review karna chahiye. Market me changes aur volatility ke sath historical performance ko analyze karna chahiye. Historical performance se aapko market ke trend aur sentiment ko samajhne me madad milti hai. Yeh analysis aapko trading decisions lene me madadgar hoti hai. Historical performance se aapko apne trades ko effectively manage karne me madad milti hai.
            14. Final Thoughts


            Pipe Bottom candlestick pattern ek valuable tool hai technical analysis ke liye. Yeh pattern market me bullish reversal signal karta hai aur traders ko profitable trades generate karne me madad kar sakta hai agar isko sahi tarah se samjha aur apply kiya jaye. Hamesha market ki overall condition ko dekh kar hi decision lena chahiye taake risks ko minimize kiya ja sake aur maximum profit earn kiya ja sake.

            Pipe Bottom pattern ko dekhne ke liye aapko pehle bearish trend ki shanakht zaroori hai. Pehli candlestick bearish hoti hai jo market me selling pressure ko zahir karti hai. Doosri candlestick bullish hoti hai jo market me buying interest ko reflect karti hai. Volume analysis market ke buying aur selling pressure ko zahir karta hai. Confirmation signals market ke trend aur sentiment ko confirm karte hain.

            Pipe Bottom pattern trade karte waqt risk management bohot zaroori hai. Stop loss aur take profit levels set karne chahiye taake aapko maximum profit ho aur minimum loss ho. Risk management se aapko market ke unexpected moves se bacha ja sakta hai. Trading strategy banate waqt market ke trend aur sentiment ko samajhna zaroori hai. Historical performance se aapko market ke trend aur sentiment ko samajhne me madad milti hai.

            Trading decisions lene se pehle hamesha market ke trend aur sentiment ko analyze karna chahiye. Technical analysis, volume analysis aur confirmation signals se aapko market ke trend aur sentiment ko samajhne me madad milti hai. Trading decisions lene me hamesha risk management ko consider karna chahiye. Pipe Bottom pattern ek valuable tool hai jo aapko profitable trades generate karne me madadgar ho sakta hai agar isko sahi tarah se samjha aur apply kiya jaye.
            • #7 Collapse

              Pipe Bottom Candlestick Pattern Ki Pehchan

              1. Mukaddimah
              Forex trading mein candlestick patterns ka istemal market ki dynamics ko samajhne aur trading decisions ko behtar banane ke liye kiya jata hai. Har candlestick pattern market ke behavior aur price movements ko ek unique perspective se represent karta hai. Pipe Bottom candlestick pattern bhi aisa hi ek pattern hai jo market ke reversal points ko identify karne mein madad karta hai. Yeh pattern tab develop hota hai jab market ek prolonged downtrend ke baad reversal ki taraf badh raha hota hai.

              Pipe Bottom pattern ka naam is pattern ki appearance se aaya hai jahan do candlesticks ek specific formation banati hain, jo ek pipe ke bottom jaisa dikhayi deta hai. Is pattern ko samajhne ke liye, traders ko iski structure aur formation pe dhyan dena zaroori hai. Yeh pattern bullish reversal signal provide karta hai, jo ki market ke bearish trend ke khatam hone ka indication hota hai.

              Forex traders is pattern ko apni trading strategies mein incorporate karte hain, jisse unhe market ke potential bottom points aur upcoming bullish moves ka indication milta hai. Is pattern ko samajhne aur correctly identify karne ke liye, traders ko candlestick analysis ke basic concepts aur pattern recognition techniques pe grip honi chahiye.

              Pipe Bottom pattern ka detailed analysis karna aur iske characteristics ko samajhna zaroori hai, taake traders effectively apni trading strategies ko plan kar sakein. Is pattern ki accurate identification se traders ko better trading opportunities mil sakti hain aur unka risk exposure bhi kam ho sakta hai.

              2. Pipe Bottom Pattern Kya Hai?
              Pipe Bottom pattern ek bullish reversal pattern hai jo market ke bottom pe banne wala signal hai. Jab market ek prolonged downtrend ke baad reach karta hai aur ek significant low banata hai, tab yeh pattern banta hai. Is pattern ki formation market ke strong bearish trend ke baad ek potential bullish reversal ko indicate karti hai.

              Is pattern ko do distinct candlesticks par base kiya jata hai. Pehli candlestick ek long bearish candlestick hoti hai jo market ke downtrend ko represent karti hai. Yeh candlestick apne opening aur closing prices ke beech ka gap wide hota hai, aur yeh candlestick market ke bearish sentiment ko show karti hai.

              Dosri candlestick, jo ki pipe bottom pattern ka dusra component hota hai, ek short bullish candlestick hoti hai. Is candlestick ki body pehli candlestick ke low ke aas paas close hoti hai aur yeh ek potential reversal point ko indicate karti hai. Is pattern ke formation ke baad, market mein bullish momentum ka potential hota hai.

              Pipe Bottom pattern ki pehchan ke liye traders ko iski exact formation aur characteristics pe focus karna padta hai. Is pattern ki accuracy ko verify karne ke liye, traders ko confirmation signals ki zarurat hoti hai jo market ke next moves ko indicate karte hain.

              Pattern ke interpretation aur application se pehle, traders ko market ke context aur price action ko samajhna zaroori hai. Yeh pattern bullish reversal signals provide karta hai, jo ki traders ko buying opportunities ke liye guide karta hai.

              3. Pehli Candlestick
              Pehli candlestick Pipe Bottom pattern ki formation ka crucial component hoti hai. Yeh candlestick ek long bearish candlestick hoti hai jo market ke strong downtrend ko represent karti hai. Is candlestick ki body typically lambi hoti hai aur yeh apne opening aur closing prices ke beech ka gap bhi significant hota hai.

              Pehli candlestick ka high aur low price bhi market ke downtrend ko reflect karta hai. Jab yeh candlestick banti hai, to market mein selling pressure dominant hota hai aur traders ki sentiment bearish hoti hai. Is candlestick ke formation se market ke current trend aur price action ka indication milta hai.

              Is candlestick ke characteristics ko analyze karna traders ke liye zaroori hota hai, jisse yeh samajh sakein ki market ke downtrend ke baad reversal ki potential hai. Yeh candlestick ka pattern ke formation ke liye initial stage hota hai aur iski pehchan se traders ko next candlestick ki prediction karne mein madad milti hai.

              Pehli candlestick ka closing price bhi important hota hai. Agar yeh candlestick apne previous closing price se kafi neeche close hoti hai, to yeh market ke bearish trend ko confirm karti hai. Yeh candlestick trading decisions ko influence karti hai aur traders ko market ke potential reversal points ko identify karne mein madad karti hai.

              Pehli candlestick ki analysis ke saath-saath, traders ko market ke volume aur price action ka bhi assessment karna chahiye. Yeh analysis pattern ki validity aur reliability ko confirm karne mein madad karta hai, aur trading decisions ko better banata hai.

              4. Dosri Candlestick
              Dosri candlestick Pipe Bottom pattern ka dusra crucial component hai. Yeh candlestick ek short bullish candlestick hoti hai jo pehli candlestick ke low ke aas paas close hoti hai. Is candlestick ka body chhoti hoti hai aur yeh ek higher closing price ko represent karti hai.

              Dosri candlestick ke formation se market ke sentiment me change ka indication milta hai. Pehli candlestick ke bearish trend ke baad, dosri candlestick bullish sentiment ko reflect karti hai. Is candlestick ki body aur closing price pattern ke potential reversal ko indicate karti hai.

              Dosri candlestick ka analysis karte waqt, traders ko iski position aur size pe focus karna chahiye. Agar yeh candlestick pehli candlestick ke low ke aas paas close hoti hai aur ek higher closing price ko show karti hai, to yeh market ke reversal ki confirmation hoti hai.

              Is candlestick ke volume bhi important hota hai. Agar dosri candlestick ka volume high hota hai, to yeh pattern ke bullish reversal signal ko strengthen karta hai. Volume analysis ke through traders ko pattern ki reliability aur potential reversal points ko samajhne mein madad milti hai.

              Dosri candlestick ki characteristics ko samajhna traders ke liye zaroori hota hai, taake wo market ke potential moves ko accurately predict kar sakein. Is candlestick ka placement aur size pattern ke overall analysis ko affect karte hain aur trading decisions ko impact karte hain.

              5. Pattern Ki Pehchan
              Pipe Bottom pattern ko accurately pehchanne ke liye traders ko pattern ki specific formation aur characteristics ko samajhna zaroori hota hai. Is pattern ko tab identify kiya jata hai jab dosri candlestick pehli candlestick ke low ke aas paas close hoti hai aur ek distinct 'L' shape formation banta hai.

              Is pattern ki pehchan ke liye, traders ko candlestick ki body aur wicks ke size pe focus karna hota hai. Dosri candlestick ki body chhoti hoti hai aur yeh pehli candlestick ke low ke aas paas close hoti hai. Yeh pattern market ke bottom pe ek reversal signal provide karta hai jo bullish momentum ka indication hota hai.

              Pattern ke accurate identification ke liye traders ko price action aur volume ka bhi analysis karna chahiye. Agar pattern ke formation ke baad market mein bullish confirmation candlestick banta hai, to yeh pattern ki reliability ko increase karta hai aur trading decisions ko guide karta hai.

              Pattern ki pehchan ke liye traders ko market ke context ko bhi samajhna zaroori hota hai. Agar market ke overall trend aur price action pattern ke formation ke sath match karti hai, to yeh pattern ko confirm karta hai aur traders ko better trading opportunities milti hain.

              Pattern ki pehchan se traders ko market ke potential reversal points aur bullish moves ka indication milta hai. Accurate pattern identification se traders apne trading strategies ko effectively plan kar sakte hain aur risk exposure ko manage kar sakte hain.

              6. Confirmation
              Pipe Bottom pattern ka confirmation market ke next trading session mein ek bullish candlestick ke formation se hota hai. Jab yeh bullish candlestick banti hai, to yeh pehli aur dosri candlestick ki combined body se upar close hoti hai aur pattern ko confirm karti hai.

              Confirmation candlestick ki size aur volume bhi important hota hai. Agar confirmation candlestick ka size significant hai aur volume high hai, to yeh pattern ke bullish reversal signal ko strengthen karta hai. Confirmation se traders ko pattern ki validity aur market ke potential moves ka indication milta hai.

              Confirmation ke baad, traders ko entry point aur stop loss levels set karna hota hai. Entry point ko pattern ke upper end ke thoda upar set kiya jata hai aur stop loss ko pattern ke low ke thoda neeche set kiya jata hai. Yeh risk management aur trading strategy ko optimize karta hai.

              Confirmation candlestick ke analysis se traders ko market ke potential bullish moves aur buying opportunities milti hain. Yeh confirmation pattern ke reliability ko increase karta hai aur trading decisions ko improve karta hai.

              Confirmation process ko samajhne aur accurately implement karne se traders market ke reversal signals ko effectively utilize kar sakte hain aur apni trading strategies ko optimize kar sakte hain.

              7. Volume Analysis
              Volume analysis Pipe Bottom pattern ki validity aur reliability ko confirm karne mein madad karta hai. Volume tab high hota hai jab pehli candlestick banti hai aur kam hota hai jab dosri candlestick banti hai. Volume ka ye pattern market ke bearish to bullish reversal ko indicate karta hai.

              Pehli candlestick ke high volume market ke strong bearish sentiment ko reflect karta hai. Is volume ke analysis se traders ko market ke downtrend aur price action ke behavior ka indication milta hai.

              Dosri candlestick ke volume kam hone se pattern ke potential reversal signal ko confirm kiya jata hai. Kam volume ka matlab hota hai ki market mein selling pressure kam ho raha hai aur bullish reversal ke chances increase ho rahe hain.

              Volume analysis ko pattern ke confirmation ke sath combine karke trading decisions ko better banaya ja sakta hai. High volume confirmation candlestick ke sath milne se pattern ki validity aur reliability increase hoti hai.

              Volume analysis ke through traders ko market ke potential moves aur buying opportunities ka indication milta hai. Yeh analysis risk management aur trading strategy ko enhance karta hai aur traders ko market ke behavior ko accurately assess karne mein madad karta hai.

              8. Entry Point
              Pipe Bottom pattern ke baad trade enter karne ke liye, traders ko bullish confirmation candle ka intezar karna chahiye. Entry point ko pattern ke upper end ke thoda upar set kiya jata hai, jisse potential bullish moves ko capture kiya ja sake.

              Entry point ko set karte waqt traders ko market ke price action aur pattern ke formation pe dhyan dena chahiye. Agar confirmation candlestick ke formation ke baad market ka price upper end ko break karta hai, to yeh bullish move ka indication hota hai.

              Entry point setting ke liye traders ko stop loss aur target levels bhi consider karne chahiye. Stop loss ko pattern ke low ke thoda neeche set kiya jata hai aur target levels ko pattern ke height ke basis pe estimate kiya jata hai.

              Entry point ke accurate setting se traders ko market ke potential moves ko effectively capture karne ka mauka milta hai. Yeh trading strategy ko optimize karta hai aur risk exposure ko manage karne mein madad karta hai.

              Entry point ke sath-sath traders ko market ke overall trend aur price action ko bhi consider karna chahiye. Yeh analysis trading decisions ko improve karta hai aur market ke potential moves ko accurately predict karne mein madad karta hai.

              9. Stop Loss
              Stop loss ko Pipe Bottom pattern ke low ke thoda neeche set kiya jata hai. Yeh stop loss risk ko manage karne aur unexpected market movements se bachne ke liye zaroori hota hai. Stop loss ke placement se traders ko apni trading position ko protect karne mein madad milti hai.

              Stop loss ke accurate placement se traders ko market ke potential loss ko limit karne ka mauka milta hai. Yeh placement pattern ke low ke thoda neeche hota hai, taake market ke false moves se bachna ja sake.

              Stop loss ko set karte waqt traders ko market ke volatility aur price action ko consider karna chahiye. High volatility market mein stop loss ke placement ko adjust kiya jata hai, taake sudden price movements se bachne ke liye effective ho.

              Stop loss ki importance trading strategy aur risk management ke aspect ko enhance karti hai. Yeh traders ko market ke unexpected moves se bachne aur trading decisions ko effectively plan karne mein madad karti hai.

              Stop loss ke accurate placement se traders ko market ke adverse movements se protection milti hai aur unki trading positions ko secure kiya jata hai.

              10. Target Setting
              Pipe Bottom pattern ke target setting ke liye, traders previous resistance levels aur pattern ki overall height ko analyze karte hain. Pattern ki height ko target level ke upar add karke estimate kiya jata hai, jisse potential profit targets ko identify kiya ja sake.

              Target setting ke liye traders ko market ke price action aur previous resistance levels pe focus karna chahiye. Pattern ki height ko calculate karke target levels ko accurately estimate kiya jata hai, jo ki potential profit opportunities ko guide karta hai.

              Target levels ko set karte waqt traders ko market ke current trend aur price movements ko bhi consider karna chahiye. Yeh analysis trading decisions ko improve karta hai aur profit targets ko accurately set karne mein madad karta hai.

              Target setting se traders ko market ke potential bullish moves aur profit opportunities ka indication milta hai. Yeh trading strategy ko optimize karta hai aur risk-reward ratio ko better banata hai.

              Target levels ke accurate setting se traders ko trading strategy ko effectively implement karne ka mauka milta hai aur market ke potential moves ko capture kiya ja sakta hai.

              11. Strengths
              Pipe Bottom pattern ka major strength yeh hai ki yeh market ke reversal points ko accurately identify kar sakta hai. Is pattern ke through, traders ko potential buying opportunities aur bullish moves ka indication milta hai, jo ki trading decisions ko guide karta hai.

              Is pattern ki accuracy aur reliability market ke reversal points aur bullish momentum ko accurately predict karne mein madad karti hai. Yeh pattern market ke downtrend ke baad bullish reversal ka indication provide karta hai, jo ki traders ke liye valuable hota hai.

              Pipe Bottom pattern ki strength uski simplicity aur effectiveness mein hoti hai. Yeh pattern do distinct candlesticks par based hota hai aur market ke potential moves ko accurately predict karne mein madad karta hai.

              Is pattern ke analysis aur implementation se traders ko market ke behavior aur price action ko better samajhne ka mauka milta hai. Yeh pattern trading strategies ko enhance karta hai aur risk exposure ko manage karne mein madad karta hai.

              Pipe Bottom pattern ka major strength yeh hai ki yeh market ke bottom pe reversal signals ko accurately identify karta hai aur traders ko better trading opportunities provide karta hai.

              12. Limitations
              Har pattern ki tarah, Pipe Bottom pattern bhi kuch limitations rakhta hai. Kabhi-kabhi pattern ke false signals market ko unexpected movements ke through confuse kar sakte hain. Isliye, pattern analysis ke sath-sath risk management ka approach zaroori hota hai.

              Pattern ke false signals traders ko misleading information provide kar sakte hain aur trading decisions ko impact kar sakte hain. Isliye, traders ko pattern ke confirmation signals aur market ke context ko consider karna chahiye.

              Pipe Bottom pattern ka limitation yeh hai ki yeh pattern market ke overall trend aur price action ko accurately reflect nahi karta. Yeh pattern bullish reversal ka indication provide karta hai, lekin market ke other factors bhi trading decisions ko influence karte hain.

              Is pattern ke limitations ko manage karne ke liye, traders ko additional technical indicators aur risk management strategies ka istemal karna chahiye. Yeh approach trading decisions ko improve karta hai aur market ke adverse movements se bachne mein madad karta hai.

              Pattern ke limitations ko samajhkar aur effectively manage karke traders apni trading strategies ko optimize kar sakte hain aur market ke potential moves ko accurately predict kar sakte hain.

              13. Conclusion
              Pipe Bottom candlestick pattern forex trading mein ek valuable tool hai jo market ke bottom pe bullish reversal signals ko identify karta hai. Is pattern ko accurately samajhne aur implement karne se traders ko market ke potential moves aur buying opportunities ka indication milta hai.

              Pattern ki pehchan aur confirmation se trading decisions ko optimize kiya ja sakta hai aur risk exposure ko manage kiya ja sakta hai. Is pattern ka analysis volume, entry points, stop loss, aur target setting ke sath combine karke traders apni trading strategies ko effectively plan kar sakte hain.

              Pipe Bottom pattern ka accurate identification aur implementation se traders ko market ke reversal points aur bullish moves ka indication milta hai. Yeh pattern trading strategies ko enhance karta hai aur market ke potential opportunities ko capture karne mein madad karta hai.

              Trading decisions ko improve karne ke liye, traders ko pattern ke limitations aur strengths ko samajhna zaroori hai. Is approach se traders apni trading strategies ko optimize kar sakte hain aur market ke behavior ko accurately assess karne mein madad milti hai.
              • #8 Collapse

                ### Pipe Bottom Candlestick Pattern Ki Pehchan
                #### 1. Ta’aruf
                Pipe Bottom Candlestick Pattern ek technical analysis tool hai jo traders ko market ke reversal points ko pehchanne mein madad karta hai. Ye pattern aksar downtrend ke baad nazar aata hai aur bullish reversal ki nishani hota hai.

                #### 2. Pipe Bottom Pattern Ka Takhleeq
                Ye pattern do candlesticks par mabni hota hai. Pehli candlestick downtrend ki hoti hai, jab ke doosri candlestick chhoti hoti hai jo pehli candlestick ke lower shadow ke andar hoti hai. Is pattern ki pehchan karna aasaan hai agar aap candlestick charts ka istamal karte hain.

                #### 3. Pehli Candlestick Ki Pehchan
                Pehli candlestick, jo ke ek bearish candlestick hoti hai, iski body lambi aur close lower price par hoti hai. Ye candlestick market ki bearish momentum ko darshata hai, jisse traders ko lagta hai ke market niche ja raha hai.

                #### 4. Doosri Candlestick Ki Pehchan
                Doosri candlestick, jo ke bullish candlestick hoti hai, iski body chhoti hoti hai aur iski opening price pehli candlestick ke close se kam hoti hai. Iska close pehli candlestick ke lower shadow se zyada hota hai, jo ke market ki bullish reversal ki taraf ishara karta hai.

                #### 5. Pipe Bottom Pattern Ki Confirmation
                Is pattern ki confirmation ke liye traders ko teesri candlestick ka intezaar karna chahiye. Teesri candlestick ka bullish hona is baat ka saboot hota hai ke market me reversal aaya hai. Iske baad, traders ko entry point ka pata chalta hai.

                #### 6. Trading Strategy
                Pipe Bottom pattern ki trading strategy mein sabse pehle pattern ko identify karna hai. Jab aapko ye pattern nazar aaye, toh aapko teesri candlestick ka intezaar karna chahiye jo ke bullish honi chahiye. Jab ye candlestick aati hai, tab aap trade kar sakte hain.

                #### 7. Risk Management
                Trading karte waqt risk management zaroori hai. Aapko apne risk ko manage karne ke liye stop-loss orders ka istemal karna chahiye. Ye stop-loss orders aapko potential losses se bacha sakte hain, agar market aapke against chali jaye.

                #### 8. Market Context
                Pipe Bottom pattern ko tab behtar samjha ja sakta hai jab aap market ki context ko samjhein. Agar aapko ye pattern kisi strong support level ke paas nazar aaye, toh ye zyada effective hota hai. Isse aapko market ki movement ki behtar samajh milti hai.

                #### 9. Fundamental Analysis
                Technical analysis ke sath-sath, fundamental analysis bhi zaroori hai. Jab aap Pipe Bottom pattern dekh rahe hote hain, tab aapko market ke underlying factors, jaise economic news aur reports, ka bhi khayal rakhna chahiye. Ye factors price movement ko kaafi asar daal sakte hain.

                #### 10. Market Sentiment
                Market sentiment ka bhi Pipe Bottom pattern par asar hota hai. Agar market ka sentiment bullish hai, toh ye pattern aur bhi zyada strong hota hai. Aapko sentiment analysis karne ke liye indicators, jaise RSI ya MACD, ka istemal karna chahiye.

                #### 11. Trading Volume
                Volume ka analysis bhi is pattern ki strength ko samjhne mein madadgar hota hai. Jab aapko Pipe Bottom pattern milta hai, toh dekhna chahiye ke kya trading volume bhi increase ho raha hai. Zyada volume bullish reversal ki confirmation deta hai.

                #### 12. Common Mistakes
                Traders aksar kuch galtiyan karte hain jab wo Pipe Bottom pattern ko identify karte hain. Sabse common mistake ye hoti hai ke wo sirf pehli aur doosri candlestick ko dekhte hain aur teesri candlestick ki confirmation nahi karte. Is wajah se wo false signals ka shikar ho sakte hain.

                #### 13. Conclusion
                Pipe Bottom Candlestick Pattern ek powerful tool hai jo traders ko market ke reversal points identify karne mein madad karta hai. Is pattern ko samajhne aur sahi tareeqe se istemal karne se aap apne trading results ko behtar bana sakte hain.

                #### 14. Aakhir Ka Lafz
                Trading mein success ka sirf ek tareeqa nahi hota. Pipe Bottom pattern ko istemal karne ke sath-sath, aapko risk management, fundamental analysis, aur market sentiment ko bhi dekhna hoga. Is tarah se aap ek successful trader ban sakte hain.
                • #9 Collapse

                  Pipe Bottom Candlestick Pattern Ki Pehchan

                  1. Mukadma


                  Candlestick patterns trading ke aik aham hisson mein se hain. Inka istemal market ki trends aur price movements ko samajhne ke liye kiya jata hai. In patterns mein se aik hai Pipe Bottom, jo bearish trend ke baad bullish reversal ka ishara deta hai.
                  2. Pipe Bottom Kya Hai?


                  Pipe Bottom candlestick pattern do ya zyada candlesticks par mabni hota hai jo ek bearish trend ke baad banta hai. Iska maqsad market mein bullish reversal ka ishara dena hota hai. Ye pattern khas tor par do candlesticks ka hissa hota hai: pehli candlestick neechay ki taraf move karti hai, jabke doosri candlestick pehli ki close ke qareeb khulti hai.
                  3. Pipe Bottom Ka Structure


                  Pipe Bottom pattern mein pehli candlestick ek lambi bearish candle hoti hai, jo market ke neechay jaane ki taraf ishara karti hai. Doosri candlestick ek short bullish candle hoti hai, jo pehli candle ke near ya close point par khulti hai. Iske baad aik choti bullish candle aati hai, jo bullish momentum ko darshati hai.
                  4. Pattern Ki Pehchan


                  Is pattern ko pehchanne ke liye, traders ko pehli candlestick ki length aur doosri candlestick ki position ko dekhna hota hai. Agar pehli candlestick ki length zyada hai aur doosri candlestick pehli ki close ke aas-paas hai, to ye Pipe Bottom ka signal hai.
                  5. Price Action Ka Asar


                  Pipe Bottom pattern ka asal maqsad price action ka hissa samajhna hai. Ye pattern aksar tab banta hai jab market neechay ki taraf move karti hai lekin wahan buyers ke entry hone ki wajah se price thoda stable hota hai. Is tarah, price action ko samajhna is pattern ki pehchan ke liye zaroori hai.
                  6. Volume Ka Ahmiyat


                  Volume bhi Pipe Bottom pattern ki pehchan mein ahmiyat rakhta hai. Jab doosri candlestick ban rahi ho, to volume ka zyada hona is baat ki taraf ishara karta hai ke market mein bullish interest hai. Yeh signal buyers ki entry ko darshata hai, jo future bullish trend ka indication hota hai.
                  7. Market Context


                  Har candlestick pattern ka ek context hota hai. Pipe Bottom pattern ko samajhne ke liye market ki overall trend ko dekhna zaroori hai. Agar ye pattern bearish trend ke baad banta hai, to iski significance barh jati hai. Isliye traders ko market context ko samajhna chahiye.
                  8. Trading Strategy


                  Pipe Bottom pattern ko trading strategy mein shaamil karne ke liye, pehli baat ye hai ke aapko is pattern ki pehchan karni hogi. Jab ye pattern banta hai, to aapko bullish position lene ka sochna chahiye. Entry point pehli candlestick ki close ke aas-paas ho sakta hai, jab aap bullish confirmation ka wait karte hain.
                  9. Stop Loss Aur Take Profit


                  Trading ke dauran stop loss aur take profit levels tay karna bohot zaroori hai. Pipe Bottom pattern ke liye, stop loss aap pehli candlestick ke low ke neeche rakh sakte hain. Take profit level ko aap market ki previous resistance levels par tay kar sakte hain.
                  10. Psychological Factors


                  Market ki psychology bhi Pipe Bottom pattern ko samajhne mein madadgar hoti hai. Jab bearish trend ke baad bullish reversal hota hai, to traders ka confidence barhta hai. Ye psychological factor bullish momentum ko support karta hai.
                  11. Common Mistakes


                  Traders aksar is pattern ko samajhne mein kuch ghalatiyan karte hain. Sab se common ghalti ye hoti hai ke woh volume ko ignore karte hain. Agar volume low ho, to pattern ki significance kum ho sakti hai. Dusri ghalti ye hai ke traders pattern ko sirf technical analysis par depend karte hain, jabke market context aur news bhi ahmiyat rakhte hain.
                  12. Real-Life Examples


                  Real-life examples se Pipe Bottom pattern ko samajhna asaan hota hai. Aksar market charts par aapko ye pattern bearish trend ke baad dekhne ko milega. Is pattern ko samajhne se aap better trading decisions le sakte hain.
                  13. Conclusion


                  Pipe Bottom candlestick pattern aik ahem tool hai jo traders ko market ki trend ko samajhne mein madad karta hai. Iski pehchan ke liye price action, volume, aur market context ko samajhna bohot zaroori hai. Is pattern ke zariye aap bullish reversals ko pehchan kar sakte hain aur profitable trades le sakte hain.
                  14. Final Thoughts


                  Trading ek challenging field hai lekin agar aap candlestick patterns jaise tools ka sahi istemal karein to aap apne trading skills ko behter bana sakte hain. Pipe Bottom pattern ko samajhna aapki trading strategy ko mazid mazboot kar sakta hai. Har trader ko chahiye ke wo is pattern ko samjhe aur is par amal kare, taake wo apne trades mein behtari la sake.
                  • #10 Collapse

                    Pipe Bottom Candlestick Pattern Ki Pehchan

                    1. Pipe Bottom Candlestick Pattern Kya Hai?


                    Pipe bottom candlestick pattern aik bullish reversal pattern hai jo aksar downtrend ke doran nazar aata hai. Is pattern ki pehchan iski do candlesticks se hoti hai jo ek dusre ke bilkul kareeb hoti hain. Pehli candlestick downtrend ki taraf hoti hai, jabke doosri candlestick iski high se high aur low se low tak hoti hai. Ye pattern traders ke liye aik positive signal hota hai, kyunke ye darshata hai ke market mein bullish momentum aane wala hai.
                    2. Pipe Bottom Pattern Ki Pehchan


                    Is pattern ki pehchan karne ke liye kuch khas baatein hain:
                    • Pehli Candlestick: Ye pehli candlestick bearish hoti hai, jo market ki downtrend ko darshati hai. Is candlestick ki body lambhi hoti hai aur iski closing price opening price se neeche hoti hai.
                    • Doosri Candlestick: Doosri candlestick bearish se bullish mein transition darshati hai. Iski body bhi lambhi hoti hai lekin iski closing price pehli candlestick ke high se upar hoti hai. Ye candlestick bearish ke baad bullish momentum ka darshata hai.
                    • Gaps: Pipe bottom pattern aksar gaps ke sath hota hai. Doosri candlestick pehli candlestick se upar khulti hai, jo is pattern ki khasiyat hai.
                    • Volume: Is pattern ke dauran trading volume bhi important hai. Agar doosri candlestick ke sath volume badhta hai, to ye bullish signal ko mazid mazboot banata hai.
                    3. Pipe Bottom Pattern Ka Analysis


                    Jab aap pipe bottom pattern ko analyze karte hain, to kuch chizein hain jo aap ko madadgar sabit hoti hain:
                    • Market Sentiment: Is pattern ko dekhtay hue market sentiment ko samajhna zaroori hai. Agar market mein log bearish the, to pipe bottom pattern ka aana bullish reversal ko darshata hai.
                    • Support Level: Is pattern ke aane par dekhiye ke kya market kisi strong support level par hai ya nahi. Agar ye pattern strong support level ke paas aata hai, to ye bullish reversal ke liye zyada reliable hota hai.
                    • Confirmation Candlestick: Doosri candlestick ke baad ek confirmation candlestick ka hona zaroori hai. Agar ye confirmation candlestick bullish hoti hai, to ye aapke entry signal ko mazboot banata hai.
                    4. Trading Strategy Pipe Bottom Pattern Ke Liye


                    Agar aap pipe bottom pattern par trading karna chahte hain, to aapko kuch strategies ko madde nazar rakhna hoga:
                    • Entry Point: Jab doosri candlestick close hoti hai aur confirmation candlestick aati hai, tab aap entry point ka tay kar sakte hain. Yahan par aap long position lene ka soch sakte hain.
                    • Stop Loss: Apne risk management ko madde nazar rakhte hue, aapko stop loss bhi tay karna hoga. Ye aapko loss se bachane mein madad karega agar market aapki soch ke khilaf chali jaye.
                    • Take Profit Level: Take profit level ka tay karna bhi zaroori hai. Ye level aap market ki previous highs ya kisi resistance level par rakh sakte hain.
                    • Risk-Reward Ratio: Risk-reward ratio ka tay karna bhi zaroori hai. Is pattern ke sath, aapko aise trades leni chahiye jahan aapka potential profit aapke risk se zyada ho.
                    5. Pipe Bottom Pattern Ke Faide Aur Nuqsanat

                    Faide:
                    • Acha Entry Point: Ye pattern traders ko bullish reversal ka acha entry point provide karta hai.
                    • Risk Management: Is pattern ke sath stop loss aur take profit level tay karna aasaan hota hai.
                    • Market Confirmation: Ye pattern market ke bullish sentiment ki confirmation bhi deta hai.
                    Nuqsanat:
                    • False Signals: Kabhi kabhi ye pattern false signals bhi de sakta hai, jis wajah se traders ko nuqsan ho sakta hai.
                    • Market Conditions: Agar market ki conditions unstable hain, to ye pattern reliable nahi hota.
                    • Emotional Trading: Aksar traders is pattern ko dekh kar emotional decisions le lete hain, jo unke liye nuqsan daik sabit hota hai.
                    6. Conclusion


                    Pipe bottom candlestick pattern trading ki duniya mein aik aham aur popular pattern hai. Iski pehchan karna aur trading strategy tay karna aapko market ki understanding mein behter bana sakta hai. Lekin, is pattern ka istemal karne se pehle, aapko risk management aur market conditions ka khayal rakhna hoga. Agar aap in points ko madde nazar rakhein, to aap is pattern se faida utha sakte hain aur apne trading career ko aage barha sakte hain. Is pattern ka achi tarah se istemal karke, aap market mein bullish momentum ko pehchaan sakte hain aur profitable trades kar sakte hain.
                    • #11 Collapse

                      Trading mein candlestick patterns kaafi zaroori hotay hain kyun ke yeh humein market ke price action ka asar samajhne aur future movements ka idea lene mein madad dete hain. Aaj hum ek specific aur advanced pattern, Pipe Bottom Candlestick Pattern, ke baare mein baat karenge. Is pattern ko samajhna aur effectively use karna trading mein kaafi faydemand ho sakta hai, khaas kar jab baat reversal points ki hoti hai. Pipe Bottom ek bullish reversal candlestick pattern hai jo aksar market ke niche (bottom) ya downtrend ke end par banta hai. Is pattern ka signal yeh hota hai ke:
                      1. Market ka downtrend khatam ho raha hai.
                      2. Buyers ne market mein apni strength dikhani shuru kar di hai.
                      3. Price upar ki taraf reversal karne wala hai.
                      Yeh pattern tab banta hai jab price do consecutivebearishcandles ke baad, do bullishcandles banata hai jo previous bearish candles ke body ko engulf karti hain. Yani ke, bullish candles ka size pehli bearish candles se zyada hota hai.


                      Pipe Bottom Pattern Ki Pehchan
                      Is pattern ko identify karne ke liye aapko kuch key characteristics ka dhyan rakhna hoga:

                      1. Trend ka Context Samajhna
                      • Yeh pattern sirf downtrend ya selling pressure wale market mein valid hota hai.
                      • Agar market pehle hi sideways ya range-bound hai, to yeh pattern kaam nahi karega.
                      2. Pattern Structure
                      • First Two Candles: Dono bearish hoti hain, jinki bodies lambay hoti hain (no small candles).
                      • Next Two Candles: Yeh bullish hoti hain, aur inka size pehli bearish candles se bara hota hai.
                      • Yeh candles aksar ek V-shape ya sharpreversal ka asar dikhati hain.
                      3. Support Level
                      • Yeh pattern aksar keysupportlevels ya demandzones par banta hai, jahan se market ka bounce karna expected hota hai.
                      4. Volume Confirmation
                      • Pattern ke bullish candles ke saath zyada volume hota hai, jo buyers ke interest ko dikhata hai.
                      Pipe Bottom Candlestick Pattern Ka Psychological Analysis
                      Candlestick patterns ka sabse bara faida yeh hai ke yeh humein market ke psychology ke baare mein insight dete hain. Pipe Bottom ke context mein:
                      1. Bearish Control: Pehli do bearish candles yeh dikhati hain ke sellers market ko control kar rahe hain.
                      2. Buyer Interest: Do bullish candles ke aane ka matlab hai ke buyers ne market mein enter karna shuru kar diya hai.
                      3. Trend Shift: Jab bullish candles ka size zyada hota hai, to yeh signal hota hai ke sellers weak ho rahe hain aur market bullish direction mein ja sakta hai.
                      Pipe Bottom Pattern show chart

                      Example Situation
                      • EUR/USD ka price ek downtrend mein hai aur $1.0500 ka support level touch karta hai.
                      • Wahan pehle do bearish candles banti hain jinki bodies kaafi bari hain.
                      • Uske baad do bullish candles banti hain jo pehli candles ke size ko engulf karti hain.
                      • Iska matlab hai ke market yahan se reverse karne wala hai.
                      Is Pattern Ko Use Karne Ki Strategy
                      Pipe Bottom pattern ko effectively use karne ke liye aapko ek systematic approach adopt karni hogi.

                      1. Multiple Timeframe Analysis
                      • Higher timeframes par trend ko samajhna zaruri hai (4-hour ya daily chart).
                      • Lower timeframes par entry aur exit points ko dhundhein (15-minute ya 1-hour chart).
                      2. Pattern Confirmation
                      • Sirf do bullish candles dekh kar trade mat karein; uske sath support level aur volume ka confirmation bhi chahiye.
                      • Yeh dekhein ke kya bullish candles ke sath zyada volume hai.
                      3. Entry Point
                      • Jab pattern complete ho jaye aur bullish candles ka high tod diya jaye, tab buy karein.
                      4. Stop Loss
                      • Stop loss pattern ke lowest point (support level) ke neeche lagayen.
                      5. Take Profit
                      • Pehle resistance level ya predefined risk-reward ratio ka target set karein.
                      Real-World Example of Pipe Bottom Pattern
                      • GBP/USD ka price $1.2000 ka support level touch karta hai.
                      • Aksar yeh level ek strong demand zone hota hai.
                      • Price pehli do bearish candles banata hai jo $1.2000 ke neeche jaati hain.
                      • Uske baad do strong bullish candles banti hain jo pehli candles ko engulf kar leti hain.
                      • Volume indicator yeh dikhata hai ke buyers enter kar rahe hain.
                      • Yeh ek ideal setup hota hai buy trade ke liye.
                      Pipe Bottom Pattern Ki Strengths Aur Weaknesses

                      Strengths
                      1. High Probability: Support levels par banta hai, is liye iska success rate zyada hota hai.
                      2. Clear Entry/Exit: Is pattern mein entry aur stop loss asaan hota hai.
                      3. Strong Reversals: Yeh pattern aksar major reversals ka signal deta hai.
                      Weaknesses
                      1. False Signals: Agar pattern key support level par nahi hai, to yeh fail ho sakta hai.
                      2. Consolidation Risks: Sideways market mein yeh kaam nahi karta.
                      3. Volume Confirmation Ki Zarurat: Agar volume low hai, to pattern reliable nahi hoga.
                      Pipe Bottom Pattern Ka Advanced Use

                      1. Fibonacci Retracement ke Sath
                      • Pipe Bottom pattern ko Fibonacciretracementlevels ke sath use karein.
                      • Agar pattern 61.8% ya 78.6% retracement level par banta hai, to iska success rate aur barhta hai.
                      2. Divergence Analysis
                      • Agar bullish divergence (price neeche ja raha hai magar RSI upar ja raha hai) ho, to Pipe Bottom pattern zyada reliable hota hai.
                      3. Confluence
                      • Pattern ke sath aur tools ka confluence dhundhein, jaise moving averages ya pivot points.
                      Mistakes Jo Avoid Karni Chahiye
                      1. Indicators Pe Zyada Rely Karna:
                        • Yeh pattern price action based hai, is liye indicators kaam nahi karte.
                      2. Low Volume Pe Trade Karna:
                        • Agar bullish candles ka volume low hai, to pattern ko ignore karein.
                      3. Improper Risk Management:
                        • Stop loss aur position sizing ko neglect mat karein.


                      Pipe Bottom Candlestick Pattern ek advanced aur powerful trading pattern hai jo market ke bottoms par reversal ka signal deta hai. Is pattern ko samajhne ke liye aapko candlestick analysis, support/resistance levels, aur volume ke concepts mein mahir hona padega. Agar aap is pattern ko properly identify kar lein aur apne trading plan ke mutabiq execute karein, to yeh aapke trading results mein dramatic improvement la sakta hai.

                      Yeh pattern sirf ek indicator nahi, balki market psychology ka ek reflection hai jo humein dikhata hai ke buyers aur sellers ke darmiyan kaun dominate kar raha hai. Iska sahi istemal aapki trading ko next level par le ja sakta hai.
                      Believe in yourself and your abilities. When you fight for your dreams, you can achieve anything.
                      • <a href="https://www.instaforex.org/ru/?x=ruforum">InstaForex</a>
                      • #12 Collapse

                        **Pipe Bottom Candlestick Pattern Ki Pehchan**
                        Forex trading aur stock markets mein, candlestick patterns ka analysis ek important tool hai jo traders ko market ki potential movements samajhne mein madad deta hai. Aise kaafi patterns hain jo market ke trend reversal ya continuation ka signal dete hain, aur unmein se ek hai **Pipe Bottom Candlestick Pattern**. Yeh pattern aksar market mein bearish trend ke baad bullish reversal ko indicate karta hai. Aaj hum is pattern ko samjhenge aur iski pehchan kaise ki ja sakti hai, yeh bhi discuss karenge.

                        ### Pipe Bottom Candlestick Pattern Kya Hai?

                        **Pipe Bottom** ek reversal candlestick pattern hai jo aksar market ke downtrend ke baad banta hai. Is pattern ka formation tab hota hai jab price apne low point par jakar ek strong bullish reversal dikhata hai. Yeh pattern do candlesticks ka combination hota hai — ek bearish candlestick (jo market ke downward movement ko show karta hai) aur uske baad ek strong bullish candlestick (jo market mein reversal aur upward movement ka signal deti hai). Pipe Bottom pattern ko **Bullish Pipe Bottom** bhi kaha jata hai.

                        ### Pipe Bottom Pattern Ki Characteristics

                        1. **Downtrend Se Reversal:**
                        Pipe Bottom pattern aksar market ke downtrend ke baad hota hai. Jab price ek significant low banata hai aur phir strong upward movement dikhata hai, to yeh reversal ka signal hota hai. Is pattern ko identify karne ka pehla step yeh hota hai ke market ko clearly downtrend mein hona chahiye.

                        2. **Two Candlestick Formation:**
                        Is pattern mein do candlesticks ka formation hota hai:
                        - Pehla candlestick ek bearish candlestick hota hai jo market ki downward movement ko indicate karta hai.
                        - Dusra candlestick ek strong bullish candlestick hota hai jo price ko wapas upward le jata hai. Yeh bullish candlestick pehle ke bearish candlestick ke low ke neeche close hota hai, lekin phir uske baad market ko upar le aata hai.

                        3. **Price Reversal:**
                        Pipe Bottom pattern market ke bottom par banta hai, aur iska main characteristic feature yeh hai ke price pehle niche jata hai, phir unexpectedly wapas upar aa jata hai. Is se traders ko yeh signal milta hai ke buyers ne market mein entry ki hai aur bearish pressure ko reject kar diya hai.

                        4. **Strong Bullish Candlestick:**
                        Pipe Bottom pattern mein jo doosra candlestick hota hai, wo usually ek strong bullish candlestick hota hai. Yeh candlestick market mein buyers ke dominance ko show karta hai, aur iski closing price pehle ke bearish candlestick ke high se kaafi upar hoti hai.

                        ### Pipe Bottom Pattern Ki Pehchan Kaise Karein?

                        1. **Trend Analysis:**
                        Sab se pehle, aapko market mein clear downtrend identify karna hoga. Agar price consistently neeche ki taraf move kar raha hai aur ek significant low banata hai, to yeh potential Pipe Bottom pattern ka formation ka indication ho sakta hai.

                        2. **Candlestick Analysis:**
                        Pipe Bottom pattern mein pehla candlestick bearish hota hai, aur doosra candlestick bullish hota hai. Aapko yeh dekhna hoga ke doosra candlestick pehle ke candlestick ke low ke neeche close ho, lekin uske baad price significantly upar move kar jaye. Yeh pattern price action ke reversal ka strong signal hota hai.

                        3. **Volume Analysis:**
                        Volume bhi Pipe Bottom pattern ko identify karne mein madad karta hai. Jab bullish candlestick banta hai, to ideally volume ka increase hona chahiye. Yeh indicate karta hai ke buyers market mein active hain aur strong buying pressure create ho raha hai.

                        4. **Confirmation:**
                        Pipe Bottom pattern ka confirmation uss waqt hota hai jab price ne apne previous bearish candlestick ke high ko cross kar liya ho. Agar price us high ko cross kar le aur uske baad upar move kare, to yeh confirm karta hai ke reversal ho gaya hai aur market bullish ho sakta hai.

                        ### Pipe Bottom Pattern Ka Importance

                        Pipe Bottom pattern ek reliable reversal signal hai, lekin isko sirf apne aap par rely karna risk ho sakta hai. Aapko is pattern ko additional technical tools ke sath confirm karna chahiye, jaise support and resistance levels, trendlines, aur moving averages. Is pattern ko effectively use karte hue aap market mein reversal points ko identify kar sakte hain aur profitable trades execute kar sakte hain.

                        ### Trading Strategy for Pipe Bottom Pattern

                        1. **Entry Point:**
                        Jab aap Pipe Bottom pattern ko identify kar lete hain, to entry point tab hota hai jab second bullish candlestick apne pehle bearish candlestick ke high ko break karta hai. Yeh entry point signal karta hai ke market mein upward movement ka start ho chuka hai.

                        2. **Stop-Loss Placement:**
                        Aap apne stop-loss ko pehle ke bearish candlestick ke low ke thoda neeche rakh sakte hain, taake agar market against jaye, to aapka loss limited ho.

                        3. **Target Levels:**
                        Target levels ko aap previous resistance levels ya trendlines ke around set kar sakte hain, jo aapko price ke potential reversal points dikhayenge.

                        ### Conclusion

                        Pipe Bottom candlestick pattern ek powerful reversal pattern hai jo market ke downtrend ke baad bullish reversal ko indicate karta hai. Is pattern ko pehchan kar aap apni trading strategy mein isse effectively use kar sakte hain. Is pattern ki accurate pehchan aur proper risk management se aap profitable trades kar sakte hain, lekin hamesha confirmatory signals ko dhyan mein rakhna zaroori hai.

                        اب آن لائن

                        Working...
                        X