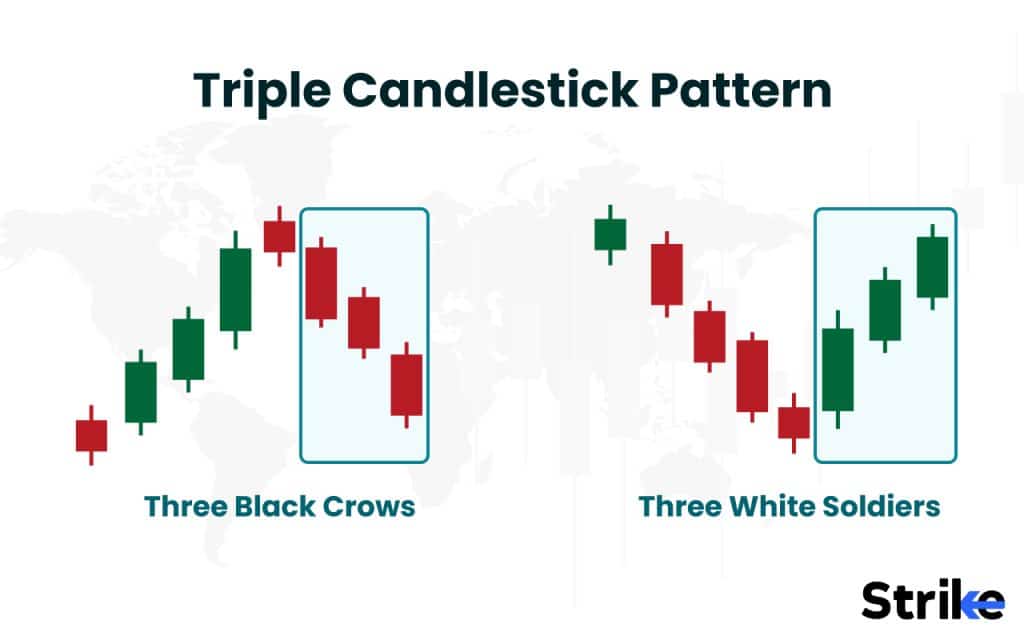
Three black crows Candlestick pattern:
Dear forex members Three black crows candlestick pattern mein cag body wali bearish candlesticks hote hein jo period ke low price par close hote hein ya uske paas. Dusre lafzon mein candle ke body lambe hote hein aur unke chhote ya bilkul na hone wale shadows hote hein. Agar shadows bahar ki taraf fail rahe hein, toh ye bas aik chhote momentum shift ko indicate kar sakta hy bulls aur bears ke beech, jab tak uptrend fir se zor nahi pakadta. Is pattern ko samajhne ke liye aur trading decisions lene se pehle dusre technical indicators aur market context ka bhi dhyan rakhna zaroori hy. Aur hameshamand pital ko surakshit rakhne ke liye sahi risk management strategies ka istemal karna chahiye. Market meinyeh ho sakta hy ki aik bade volume wale bearish trades ke saath aik chote number ke bullish traders bhi maujood ho. Yahan par asal maamla market participants ke actual number se zyada unki laikar aane wala volume matter karta hy. Har aik trader ki volume, market mein kitna impact kar rahi hy, yeh zyada important hota hy. Two Crows pattern, jo ke technical analysis mein istemal hota hy, trading mein aik ahem aur faida-Upside GapThree Black Crows aik visual pattern hy jise confirm karne ke liye dusre technical indicators ki madad leni chahiye. Is pattern ki confidence aur us par trader ke yaqeen par kaafi asar hota hy ki pattern kitna sahi tarah se ban raha hy. Three Black Crows ideally lonsignal deta hy. Jab ham kisi stock ya financial instrument ki trading karte hein, to market ke patterns ko samajhna aur unhe analyze karna hamare liye mufeed hota hy. Upside Gap Two Crows pattern bhi aise hi aik pattern hy, jiska istemal traders apni decision-making mein karte hein.

Identification about Three black crows candlestick pattern:
Dear forex traders Three black crows mein market ki bullish momentum hoti hy, laikin agar agla din market lower close kare, to yeh pao Crows ka matlab hota hy ke do kabootar. Jab Upside Gap ke baad do consecutive days mein market lower close karti hy, to yeh Two Crows pattern ban jata hy. Is pattern ki pehchan karnay se traders ko aik indication milti hy ke market ka trend chanpattern ka faida trading mein is tarah se hy ke jab yeh formation hoti hy, to yeh indicate karta hy ke buyers ka dominance kamzor ho sakta hy aur sellers control mein aa sakte hein. Iska mtlab hy ke marketth Index) ya MACD (Moving Average Convergence Divergence) ka istemal kiya ja saside Gap Two Crows pattern ka istemal kar ke traders risk management ko bhi improve kar sakte hein, kyun ke is pattern ke appearance ke baad, mIsmein bearish sentiment badh saraders is pattern ko istemal kar ke apni trading strategy ko enhance kar sakte hein. Agar kisi stock mein Upside Gap Two Crows pattern dikhe, to trader apne positions ko review karke, ya to apni existing positions ko secure kar sakta hy ya fir new short positions le sakta hy, expecting a potential dowYeh pattern kisi bhi time frame par ho sakta hy, laikin iski effectiveness ko increase karne ke liye, traders ise confirm karne ke liye dusre technical indicators ka bhi istemal karte hein. Misal ke tor par, RSI (Relative Strengpattern ki pehchan karnay se pehle, hamein yeh samajhna zaroori hy ke "Upside Gap" kya hota hy. Jab market aik din higher open ke saath shuru hoti hy, aur phir agle din lower close ke saath band hoti hy, to isko Upside Gap kehte hein. Is Garket mein volatility barh sakti hy. Isliye, stop-loss orders ka istemal karna aur position sizes ko manage karna traders ke liye ahem hy.In conclusion, Upside Gap Two Crows pattern ka istemal kar ke traders market trends ko samajh sakte hein aur apni trading decisions ko refine kar sakte hein. Yeh pattern aik powerful tool hy, laikin hamesha yaad rakhein ke kisi bhi trading strategy mein risk management ka hona bhi utna hi zaroori hy.
Dear forex members Three black crows candlestick pattern mein cag body wali bearish candlesticks hote hein jo period ke low price par close hote hein ya uske paas. Dusre lafzon mein candle ke body lambe hote hein aur unke chhote ya bilkul na hone wale shadows hote hein. Agar shadows bahar ki taraf fail rahe hein, toh ye bas aik chhote momentum shift ko indicate kar sakta hy bulls aur bears ke beech, jab tak uptrend fir se zor nahi pakadta. Is pattern ko samajhne ke liye aur trading decisions lene se pehle dusre technical indicators aur market context ka bhi dhyan rakhna zaroori hy. Aur hameshamand pital ko surakshit rakhne ke liye sahi risk management strategies ka istemal karna chahiye. Market meinyeh ho sakta hy ki aik bade volume wale bearish trades ke saath aik chote number ke bullish traders bhi maujood ho. Yahan par asal maamla market participants ke actual number se zyada unki laikar aane wala volume matter karta hy. Har aik trader ki volume, market mein kitna impact kar rahi hy, yeh zyada important hota hy. Two Crows pattern, jo ke technical analysis mein istemal hota hy, trading mein aik ahem aur faida-Upside GapThree Black Crows aik visual pattern hy jise confirm karne ke liye dusre technical indicators ki madad leni chahiye. Is pattern ki confidence aur us par trader ke yaqeen par kaafi asar hota hy ki pattern kitna sahi tarah se ban raha hy. Three Black Crows ideally lonsignal deta hy. Jab ham kisi stock ya financial instrument ki trading karte hein, to market ke patterns ko samajhna aur unhe analyze karna hamare liye mufeed hota hy. Upside Gap Two Crows pattern bhi aise hi aik pattern hy, jiska istemal traders apni decision-making mein karte hein.
Identification about Three black crows candlestick pattern:
Dear forex traders Three black crows mein market ki bullish momentum hoti hy, laikin agar agla din market lower close kare, to yeh pao Crows ka matlab hota hy ke do kabootar. Jab Upside Gap ke baad do consecutive days mein market lower close karti hy, to yeh Two Crows pattern ban jata hy. Is pattern ki pehchan karnay se traders ko aik indication milti hy ke market ka trend chanpattern ka faida trading mein is tarah se hy ke jab yeh formation hoti hy, to yeh indicate karta hy ke buyers ka dominance kamzor ho sakta hy aur sellers control mein aa sakte hein. Iska mtlab hy ke marketth Index) ya MACD (Moving Average Convergence Divergence) ka istemal kiya ja saside Gap Two Crows pattern ka istemal kar ke traders risk management ko bhi improve kar sakte hein, kyun ke is pattern ke appearance ke baad, mIsmein bearish sentiment badh saraders is pattern ko istemal kar ke apni trading strategy ko enhance kar sakte hein. Agar kisi stock mein Upside Gap Two Crows pattern dikhe, to trader apne positions ko review karke, ya to apni existing positions ko secure kar sakta hy ya fir new short positions le sakta hy, expecting a potential dowYeh pattern kisi bhi time frame par ho sakta hy, laikin iski effectiveness ko increase karne ke liye, traders ise confirm karne ke liye dusre technical indicators ka bhi istemal karte hein. Misal ke tor par, RSI (Relative Strengpattern ki pehchan karnay se pehle, hamein yeh samajhna zaroori hy ke "Upside Gap" kya hota hy. Jab market aik din higher open ke saath shuru hoti hy, aur phir agle din lower close ke saath band hoti hy, to isko Upside Gap kehte hein. Is Garket mein volatility barh sakti hy. Isliye, stop-loss orders ka istemal karna aur position sizes ko manage karna traders ke liye ahem hy.In conclusion, Upside Gap Two Crows pattern ka istemal kar ke traders market trends ko samajh sakte hein aur apni trading decisions ko refine kar sakte hein. Yeh pattern aik powerful tool hy, laikin hamesha yaad rakhein ke kisi bhi trading strategy mein risk management ka hona bhi utna hi zaroori hy.


تبصرہ
Расширенный режим Обычный режим