Support and Resistance Line Location
X
  • وقت
  • دکھائیں
Clear All
new posts
  • #1 Collapse

    Support and Resistance Line Location
    Topic : Support and Resistance Line Location
    Click image for larger version

Name:	how_to_use_support_and_resistance_in_trading.png
Views:	27
Size:	26.0 کلوبائٹ
ID:	13070288
    Support Aur Resistance Kya Hai?

    Support aur resistance trading ke important concepts hain jo market ki price movements ko samajhne mein madad karte hain. Support wo price level hai jahan demand strong hoti hai aur price ko niche girne se rokta hai. Resistance wo price level hai jahan supply strong hoti hai aur price ko oopar jane se rokta hai.

    Support Line Location Kaise Karein?
    1. Historical Price Data:
      • Support line locate karne ke liye historical price data ko analyze karein. Wo points identify karein jahan price ne pehle bounce back kiya ho. Yeh points future mein bhi support level ban sakte hain.
    2. Round Numbers:
      • Traders often psychological levels par trade karte hain, jaise round numbers (e.g., $50, $100). Yeh levels frequently support ki tarah kaam karte hain kyunke in par buying interest zyada hota hai.
    3. Volume Analysis:
      • High volume areas ko dekh kar bhi support levels identify kiya ja sakta hai. Jab price kisi level par high volume ke sath trade hui ho, to wo level strong support ban sakta hai.
    Click image for larger version

Name:	images.png
Views:	24
Size:	8.7 کلوبائٹ
ID:	13070289
    Resistance Line Location Kaise Karein?
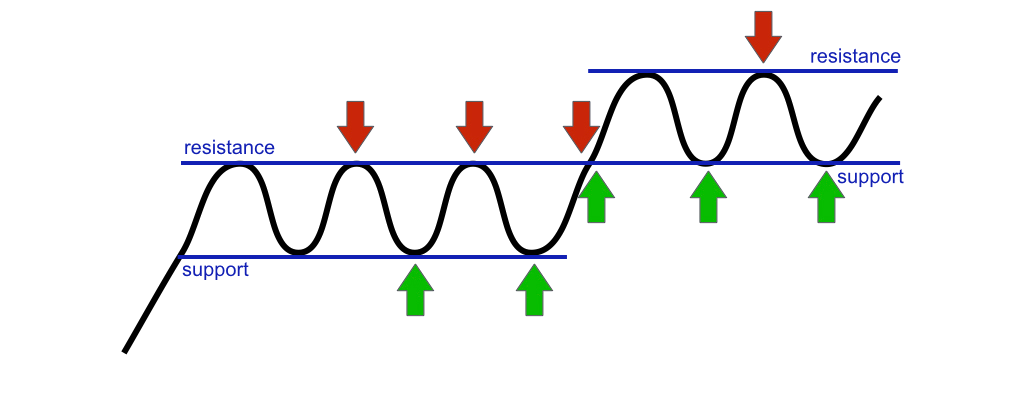
    1. Previous Highs:
      • Resistance line locate karne ke liye previous highs ko dekhain. Wo points identify karein jahan price ne pehle resistance face kiya ho aur neeche gir gaya ho. Yeh points future mein bhi resistance level ban sakte hain.
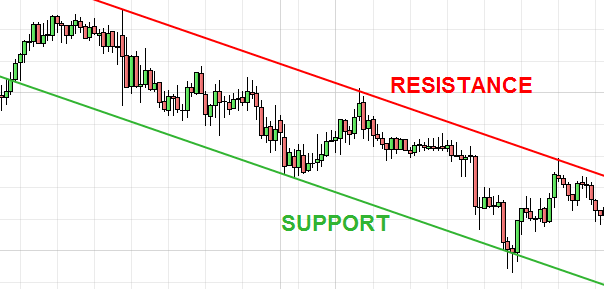
    2. Trendlines:
      • Resistance lines ko trendlines draw karke bhi locate kiya ja sakta hai. Jab price continuously lower highs bana rahi ho to downward trendline resistance ki tarah act karegi.
    3. Technical Indicators:
      • Technical indicators jaise Moving Averages aur Fibonacci Retracement bhi resistance levels ko identify karne mein madadgar hote hain. Jab price in indicators ke kareeb hoti hai, to resistance face kar sakti hai.

    Support Aur Resistance Ko Kaise Use Karein?
    1. Entry and Exit Points:
      • Support aur resistance levels ko entry aur exit points ke liye use karein. Support ke kareeb buy positions aur resistance ke kareeb sell positions consider kar sakte hain.
    2. Stop-Loss Placement:
      • Stop-loss orders ko support aur resistance levels ke thoda neeche ya oopar place karein taake market noise se bach sakein aur position secure rahe.
    3. Trend Confirmation:
      • Support aur resistance levels ko trend confirmation ke liye bhi use kiya ja sakta hai. Agar price support ko break kar de to downtrend aur resistance ko break kar de to uptrend ki confirmation milti hai.
    Click image for larger version

Name:	resistance_on_a_chart.png
Views:	23
Size:	4.5 کلوبائٹ
ID:	13070290
    Conclusion

    Support aur resistance lines locate karna trading ka essential part hai. Historical price data, round numbers, volume analysis, previous highs, trendlines, aur technical indicators ko use karke in levels ko identify kar sakte hain. Yeh levels trading decisions ko guide karte hain aur risk management mein madadgar hote hain. Effective support aur resistance analysis se trading success ko enhance kiya ja sakta hai.
  • <a href="https://www.instaforex.org/ru/?x=ruforum">InstaForex</a>
  • #2 Collapse

    Support aur Resistance Line ka Ta'ayun

    Support Line kya hoti hai?

    Support line woh level hai jahan par ek asset ka price girte girte ruk jaata hai aur phir wahan se wapas upar jaane lagta hai. Yeh is baat ki nishani hoti hai ke buyers us price level par interested hain aur demand wahan zyada hai.

    Resistance Line kya hoti hai?

    Resistance line woh level hai jahan par ek asset ka price barhte barhte ruk jaata hai aur phir wahan se neeche girne lagta hai. Yeh is baat ki nishani hoti hai ke sellers us price level par interested hain aur supply wahan zyada hai.

    Support aur Resistance Lines ka kaise Ta'ayun kiya jaata hai?

    Support aur resistance lines ka ta'ayun chart par price movements dekh kar kiya jaata hai. Kuch specific methods hain jo traders use karte hain:

    1. Historical Price Levels.

    Purane price levels dekh kar support aur resistance points ka ta'ayun hota hai. Agar kisi level par pehle price rok gaya tha, toh yeh possibility hoti hai ke wahan phir se price rok jaaye.

    2. Moving Averages.

    Moving averages, jaise ke 50-day aur 200-day moving averages, support aur resistance levels identify karne mein madadgar hote hain. Agar price moving average se upar ho toh woh support hota hai aur agar neeche ho toh resistance.

    3. Trend Lines.

    Trend lines, jo ke higher highs aur higher lows ko connect karti hain, support aur resistance points ka ta'ayun karne mein madad karti hain. Agar trend line upar ja rahi ho toh woh support hoti hai aur agar neeche ja rahi ho toh woh resistance.

    4. Fibonacci Retracement Levels.

    Fibonacci retracement levels bhi support aur resistance points ka ta'ayun karne ke liye use hote hain. Yeh specific percentages (jaise ke 38.2%, 50%, aur 61.8%) pe based hote hain jo market movements ko predict karte hain.

    Kaise Identify Karein?

    Support aur resistance lines ko identify karne ke liye, kuch basic steps follow kiye jaate hain:

    1. Chart ko Analyze Karein

    Price chart ko open karein aur time frame select karein (daily, weekly, monthly).

    2. Historical Highs aur Lows Dekhein

    Historical price data ko dekh kar identify karein ke kaha par prices ne highs aur lows banaye hain.

    3. Trend Lines Draw Karein

    Trend lines draw karein jo important highs aur lows ko connect kar rahi hain.

    4. Moving Averages Apply Karein

    Chart par moving averages apply karein aur dekhein ke price kis level par support ya resistance find kar raha hai.

    Misaal ke taur par, agar ek stock ka price $100 se neeche nahin gir raha aur wahan se wapas upar jaa raha hai, toh $100 us stock ka support level hoga. Isi tarah agar ek stock ka price $150 se upar nahin jaa raha aur wahan se wapas neeche aa raha hai, toh $150 us stock ka resistance level hoga.
    • #3 Collapse

      **Support Aur Resistance Line Location: Forex Trading Mein Importance**
      Support aur resistance lines technical analysis ke fundamental tools hain jo price charts pe market ke potential turning points ko identify karne mein madad karti hain. Yeh lines market ke key levels ko represent karti hain jahan price usually reverse ya pause hoti hai. Support aur resistance lines ki sahi location ko samajhna trading decisions ko enhance kar sakta hai. Is post mein, hum support aur resistance lines ki location aur unke importance ko explore karenge.

      **Support Line Ka Concept:**

      Support line wo level hoti hai jahan price ne pehle ke levels ke comparison mein decline ko rok diya hota hai aur wahan se reverse hoti hai. Yeh level buyers ke liye strong buying interest ko indicate karta hai. Jab price support level tak pohanchti hai, to demand increase hoti hai aur price wapas upar ki taraf move karti hai.

      **Resistance Line Ka Concept:**

      Resistance line wo level hoti hai jahan price ne pehle ke levels ke comparison mein increase ko rok diya hota hai aur wahan se reverse hoti hai. Yeh level sellers ke liye strong selling interest ko indicate karta hai. Jab price resistance level tak pohanchti hai, to supply increase hoti hai aur price neeche ki taraf move karti hai.

      **Support Aur Resistance Lines Ki Location Kaise Identify Karein:**

      1. **Historical Price Levels:** Price charts pe historical highs aur lows ko analyze karen. Previous price levels jahan price ne reverse kiya ho, woh support aur resistance levels ban sakte hain. Historical data ko use kar ke future price movements ko predict kiya ja sakta hai.

      2. **Trend Lines:** Trend lines ko draw karna bhi support aur resistance levels identify karne mein madadgar hota hai. Uptrend mein, trend line support level ki tarah act karti hai, jabke downtrend mein, trend line resistance level ki tarah act karti hai.

      3. **Psychological Levels:** Round numbers jaise 1.2000 ya 1.5000 psychological levels ke roop mein act karte hain aur market ke major support aur resistance levels ban sakte hain. Traders in levels pe trading decisions ko consider karte hain.

      4. **Volume Analysis:** High trading volume ke saath price movements support aur resistance levels ko validate karte hain. High volume ke sath price level pe reaction strong hoti hai, jo support ya resistance ko confirm karta hai.

      **Trading Strategy:**

      Support aur resistance lines ko use kar ke trading strategy develop karna zaroori hai. Jab price support level pe ho, to buying opportunities ko consider karen. Jab price resistance level pe ho, to selling opportunities ko consider karen. Stop-loss aur take-profit levels ko bhi support aur resistance levels ke around set karna chahiye.

      **Conclusion:**

      Support aur resistance lines ki location Forex trading mein key role play karti hai. Historical price levels, trend lines, psychological levels, aur volume analysis ko use kar ke accurate support aur resistance levels ko identify kiya ja sakta hai. In levels ko samajh kar aur trading strategies ko implement kar ke, traders market trends ko better analyze kar sakte hain aur profitable trading decisions le sakte hain.
       
      • #4 Collapse

        Support Aur Resistance Line Location

        1. Taaruf: Support Aur Resistance Lines

        Support aur resistance lines financial markets ka aik buniyadi hissa hain, jo traders aur analysts ko market trends aur price movements ko samajhne mein madad karti hain. Ye lines price charts par draw ki jati hain aur market ke behavior ko analyze karne mein madad deti hain. Support aur resistance lines ka concept technical analysis ke principles par base karta hai, jo market ke past price movements ko analyze karke future trends ko predict karta hai.

        Support line wo level hoti hai jahan price girne par ruk jati hai ya phir bounce hoti hai. Ye level ek tarah se buyers ka strong zone hota hai, jahan pe unka buying interest zyada hota hai. Resistance line wo level hoti hai jahan price barhne par rok jati hai. Ye level sellers ka strong zone hota hai, jahan pe unka selling interest zyada hota hai. Support aur resistance lines ko samajhna market trends ko predict karne ke liye zaroori hai, aur isse aapko trading decisions lene mein madad milti hai.

        Support aur resistance lines ko sahi tarah se draw karna aur samajhna trading strategies ko optimize karne mein madadgar hota hai. In lines ki identification se aap market ke key levels ko pinpoint kar sakte hain, jo future price movements ko predict karne mein madad deti hain. Ye lines price charts par prominent levels ko mark karti hain, jahan pe price historically bounce hui hai ya ruk gayi hai.

        Support aur resistance lines market ke fluctuations ko track karte hain aur traders ko market ke overall direction ko samajhne mein help karti hain. Ye lines short-term aur long-term trends ko bhi define karti hain, jo ki trading strategies aur investment decisions ko guide karti hain. Aaj ke zamanay mein, ye concept trading aur investing mein ek fundamental role play karta hai.

        Support aur resistance lines ka concept samajhna market analysis ke basic principles ko seekhne mein madad karta hai. Ye lines na sirf price levels ko mark karti hain, balki market ke sentiment ko bhi reflect karti hain. Jab aap in lines ko effectively use karte hain, to aap apne trading decisions ko better tarike se execute kar sakte hain aur market trends ko accurately predict kar sakte hain.

        2. Support Line Kya Hai?

        Support line ek aisa price level hota hai jahan price girne par ruk jati hai aur wahan se bounce karti hai. Ye line ek strong buying zone ko indicate karti hai, jahan buyers market mein enter karte hain aur price ko support dete hain. Jab bhi price is level tak girti hai, to buyers ka interest barh jata hai aur price phir se upward movement dikhati hai.

        Support line ko identify karne ke liye historical price data ka analysis kiya jata hai. Traders dekhte hain ke past me price kis level par girti hai aur wahan se phir se upar chali jati hai. Ye level market mein ek psychological barrier bhi hota hai, jahan se price ki movement ko predict kiya ja sakta hai. Support line ke analysis se traders ko ye idea milta hai ke price kis level tak gir sakti hai aur wahan se bounce karne ki possibility kitni hai.

        Support lines ko draw karne ke liye, traders chart par past price lows ko connect karte hain. Jab price ek certain level tak girti hai aur wahan se bounce hoti hai, to ye level support line ke taur par establish hota hai. Support lines ki strength ko measure karne ke liye, traders volume analysis bhi karte hain, kyunke high volume ke sath support line ko test karna uski strength ko confirm karta hai.

        Support line ke behavior ko samajhna trading decisions ko optimize karne mein madad karta hai. Agar price consistently ek support line ke upar rehti hai, to ye bullish signal hota hai. Agar price support line ko break karti hai, to ye bearish signal ho sakta hai, aur traders ko market ke trend ke according apne positions adjust karne ki zaroorat hoti hai.

        Support line market ke fluctuations ko track karne aur future price movements ko predict karne mein help karti hai. Jab price support line se bounce hoti hai, to traders ko ye signal milta hai ke market me buying interest barh raha hai. Ye information trading strategies ko better execute karne mein madad karti hai aur market trends ko accurately predict karti hai.

        3. Resistance Line Kya Hai?

        Resistance line ek aisa price level hota hai jahan price barhne par ruk jati hai aur wahan se phir se girti hai. Ye line ek strong selling zone ko indicate karti hai, jahan sellers market mein enter karte hain aur price ko resistance dete hain. Jab price is level tak barhti hai, to sellers ka interest barh jata hai aur price phir se downward movement dikhati hai.

        Resistance line ko identify karne ke liye historical price data ka analysis kiya jata hai. Traders dekhte hain ke past me price kis level tak barhti hai aur wahan se phir se girti hai. Ye level market mein ek psychological barrier bhi hota hai, jahan se price ki movement ko predict kiya ja sakta hai. Resistance line ke analysis se traders ko ye idea milta hai ke price kis level tak barh sakti hai aur wahan se girne ki possibility kitni hai.

        Resistance lines ko draw karne ke liye, traders chart par past price highs ko connect karte hain. Jab price ek certain level tak barhti hai aur wahan se girti hai, to ye level resistance line ke taur par establish hota hai. Resistance lines ki strength ko measure karne ke liye, traders volume analysis bhi karte hain, kyunke high volume ke sath resistance line ko test karna uski strength ko confirm karta hai.

        Resistance line ke behavior ko samajhna trading decisions ko optimize karne mein madad karta hai. Agar price consistently ek resistance line ke neeche rehti hai, to ye bearish signal hota hai. Agar price resistance line ko break karti hai, to ye bullish signal ho sakta hai, aur traders ko market ke trend ke according apne positions adjust karne ki zaroorat hoti hai.

        Resistance line market ke fluctuations ko track karne aur future price movements ko predict karne mein help karti hai. Jab price resistance line se girti hai, to traders ko ye signal milta hai ke market me selling interest barh raha hai. Ye information trading strategies ko better execute karne mein madad karti hai aur market trends ko accurately predict karti hai.

        4. Support Aur Resistance Lines Kaise Banate Hain?

        Support aur resistance lines ko banane ke liye, aapko historical price data ka analysis karna hota hai. Traders chart par past price highs aur lows ko identify karte hain aur unhe connect karte hain. Ye process market ke key levels ko determine karne mein madad karta hai, jo future price movements ko predict karne mein help karta hai.

        Support aur resistance lines ko draw karte waqt, traders price action ko observe karte hain aur dekhte hain ke price kis level par girti hai ya barhti hai. Ye levels past price data ke basis par establish kiye jate hain aur market ke behavioral patterns ko reflect karte hain. Support aur resistance lines ko identify karne ke liye technical indicators aur chart patterns ka bhi use kiya jata hai.

        Support aur resistance lines banane ke liye, traders trend lines aur horizontal lines ka use karte hain. Trend lines ko price highs aur lows ko connect karke draw kiya jata hai, jabke horizontal lines price ke specific levels ko mark karti hain. In lines ko draw karte waqt, traders ko market ke fluctuations aur price movements ko dhyan mein rakhna padta hai.

        Support aur resistance lines ki accuracy ko check karne ke liye, traders multiple time frames ka analysis karte hain. Ye approach short-term aur long-term trends ko samajhne mein madad karti hai aur market ke overall behavior ko better predict karne mein help karti hai. Support aur resistance lines ke accuracy ko increase karne ke liye, traders volume analysis aur other technical indicators ka bhi use karte hain.

        Support aur resistance lines ko banate waqt, traders market ke historical data ko analyse karke potential reversal points aur key levels ko identify karte hain. Ye lines market trends ko predict karne aur trading strategies ko optimize karne mein madad karti hain. Effective support aur resistance lines ke establishment se aap apne trading decisions ko behtar bana sakte hain.

        5. Historical Data Ki Importance

        Historical data technical analysis ka core component hota hai. Ye data past price movements aur trading volumes ko represent karta hai, jo market ke behavior aur trends ko samajhne mein madad karta hai. Historical data ki analysis se traders ko market ke past performance aur future trends ko predict karne ka idea milta hai.

        Historical data ko analyze karte waqt, traders price charts aur patterns ko dekhte hain. Ye data past price highs, lows, aur closing prices ko include karta hai, jo support aur resistance lines ko identify karne mein madad karta hai. Historical data ki analysis se traders ko ye pata chal sakta hai ke market ne kisi particular level par kaise react kiya aur us level ko future mein kis tarah se test kar sakti hai.

        Historical data ki importance ko samajhne ke liye, traders past market trends aur patterns ko analyze karte hain. Ye data market ke behavioral patterns ko reflect karta hai aur future price movements ko predict karne mein help karta hai. Historical data ki analysis se traders ko market ke key levels aur potential reversal points ka idea milta hai.

        Historical data ka use trading strategies aur decision-making mein bhi hota hai. Traders past price movements ko dekh kar apne trading strategies ko optimize karte hain aur market ke fluctuations ko predict karne ki koshish karte hain. Ye data market ke overall trends aur price patterns ko samajhne mein madad karta hai, jo trading decisions ko better execute karne mein help karta hai.

        Historical data ki analysis se traders ko market ke long-term aur short-term trends ka idea milta hai. Ye data market ke fluctuations aur price movements ko track karne mein madad karta hai aur trading decisions ko guide karta hai. Historical data ko effectively use karna market trends ko predict karne aur trading strategies ko optimize karne mein madad karta hai.

        6. Trend Lines Aur Support-Resistance Lines

        Trend lines aur support-resistance lines technical analysis ke fundamental components hain. Trend lines price movements ko visualize karte hain aur market ke overall direction ko define karte hain. Support aur resistance lines market ke key levels ko indicate karti hain, jahan price bounce hoti hai ya rukti hai.

        Trend lines ko draw karne ke liye, traders price highs aur lows ko connect karte hain. Ye lines market ke trends ko represent karti hain aur price movements ke direction ko samajhne mein madad karti hain. Trend lines ke analysis se traders ko market ke overall trend ka idea milta hai aur future price movements ko predict karne mein madad milti hai.

        Support aur resistance lines trend lines ke sath combined analysis mein use ki jati hain. Ye lines market ke key levels ko mark karti hain aur traders ko price movements ke behavior ko samajhne mein madad karti hain. Support aur resistance lines ke sath trend lines ka analysis market ke overall direction aur key levels ko pinpoint karne mein madad karta hai.

        Trend lines aur support-resistance lines ke combination se traders market ke fluctuations aur price movements ko accurately predict kar sakte hain. Ye combination market trends ko define karne aur trading strategies ko optimize karne mein help karta hai. Trend lines aur support-resistance lines ka combined use market analysis ko comprehensive aur accurate banata hai.

        Trend lines aur support-resistance lines ke effective use se traders market ke behavior ko samajh sakte hain aur trading decisions ko better execute kar sakte hain. Ye lines market ke key levels aur overall direction ko define karte hain, jo future price movements ko predict karne mein madad karta hai. Combined analysis se market trends aur trading strategies ko optimize kiya ja sakta hai.

        7. Dynamic Support Aur Resistance Lines

        Dynamic support aur resistance lines wo lines hain jo time ke sath change hoti hain. Ye lines market ke moving averages ke zariye draw ki jati hain aur price movements ke changes ko reflect karti hain. Dynamic support aur resistance lines market ke evolving trends ko samajhne aur predict karne mein madad karti hain.

        Dynamic support aur resistance lines ko calculate karne ke liye moving averages ka use kiya jata hai. Moving averages price data ka average nikalti hain aur market ke short-term aur long-term trends ko represent karti hain. Ye lines market ke changing trends ko reflect karti hain aur price movements ke changes ko visualize karne mein madad karti hain.

        Dynamic support aur resistance lines ke analysis se traders ko market ke evolving trends ka idea milta hai. Ye lines market ke fluctuations aur price movements ke changes ko reflect karti hain, jo trading decisions ko better execute karne mein madad karta hai. Dynamic support aur resistance lines ko use karke traders market ke trends ko accurately predict kar sakte hain.

        Dynamic support aur resistance lines market ke short-term aur long-term trends ko define karte hain. Ye lines market ke changing behavior ko samajhne aur trading strategies ko optimize karne mein madad karti hain. Moving averages ke analysis se traders ko market ke evolving trends ka idea milta hai aur future price movements ko predict karne mein madad milti hai.

        Dynamic support aur resistance lines ke effective use se traders market ke trends ko accurately track kar sakte hain aur trading decisions ko optimize kar sakte hain. Ye lines market ke changing trends aur price movements ko reflect karti hain, jo future price movements ko predict karne mein madad karta hai. Moving averages ke analysis se market trends ko samajhne aur trading strategies ko improve karne mein madad milti hai.

        8. Static Support Aur Resistance Lines

        Static support aur resistance lines wo lines hain jo historical price data ke basis par fixed hoti hain. Ye lines market ke key levels ko represent karti hain aur price movements ko define karti hain. Static support aur resistance lines market ke historical behavior ko reflect karti hain aur future price movements ko predict karne mein madad karti hain.

        Static support aur resistance lines ko draw karne ke liye past price highs aur lows ko analyze kiya jata hai. Ye lines market ke key levels ko mark karti hain, jahan price historically bounce hui hai ya ruk gayi hai. Static support aur resistance lines market ke key levels ko define karti hain aur price movements ke behavior ko samajhne mein madad karti hain.

        Static support aur resistance lines ke analysis se traders ko market ke historical behavior ka idea milta hai. Ye lines market ke key levels aur potential reversal points ko identify karti hain, jo future price movements ko predict karne mein madad karti hain. Static support aur resistance lines ko use karke traders market ke key levels ko accurately pinpoint kar sakte hain.

        Static support aur resistance lines market ke overall trends aur price movements ko define karti hain. Ye lines market ke historical data ke basis par establish hoti hain aur price movements ke behavior ko reflect karti hain. Static support aur resistance lines ke analysis se traders ko market ke trends aur key levels ka idea milta hai.

        Static support aur resistance lines ko effectively use karke traders market ke historical behavior ko samajh sakte hain aur trading decisions ko better execute kar sakte hain. Ye lines market ke key levels aur price movements ko define karti hain, jo future price movements ko predict karne mein madad karti hain. Static support aur resistance lines ka accurate analysis market trends ko samajhne aur trading strategies ko optimize karne mein madad karta hai.

        9. Support Aur Resistance Levels Ka Testing

        Support aur resistance levels ko test karna market analysis ka important part hota hai. Jab price support ya resistance level ko test karti hai, to ye level market ke behavior aur price movements ko reflect karta hai. Testing se traders ko ye idea milta hai ke price kis level tak bounce kar sakti hai ya break kar sakti hai.

        Support aur resistance levels ko test karne ke liye, traders price charts aur technical indicators ka use karte hain. Jab price ek support ya resistance level ko test karti hai, to traders dekhte hain ke price ka reaction kya hota hai. Agar price repeatedly ek level ko test karti hai aur wahan se bounce hoti hai, to wo level strong support ya resistance level hota hai.

        Support aur resistance levels ke testing se traders ko market ke behavior aur price movements ka idea milta hai. Ye testing market ke key levels aur potential reversal points ko identify karne mein madad karti hai. Testing ke zariye traders market ke fluctuations aur price movements ko accurately predict kar sakte hain.

        Support aur resistance levels ke testing ka process traders ko market ke overall direction aur trends ko samajhne mein madad karta hai. Testing se traders ko ye idea milta hai ke price kis level tak bounce kar sakti hai aur kis level tak gir sakti hai. Ye information trading strategies ko optimize karne aur market trends ko predict karne mein madad karti hai.

        Support aur resistance levels ke effective testing se traders market ke key levels aur price movements ko accurately analyze kar sakte hain. Ye testing market ke fluctuations aur trends ko samajhne mein madad karti hai aur trading decisions ko better execute karne mein help karti hai. Testing ke zariye traders ko market ke behavior aur price movements ka comprehensive understanding milta hai.

        10. Support Aur Resistance Ka Role Market Trends Mein

        Support aur resistance lines market trends ko define karte hain aur price movements ko track karne mein madad karte hain. Jab price support level se bounce hoti hai ya resistance level se girti hai, to ye market ke overall direction aur trends ko indicate karta hai. Support aur resistance lines market ke key levels ko mark karti hain aur trading decisions ko guide karti hain.

        Support aur resistance lines ke analysis se traders ko market ke trends aur fluctuations ka idea milta hai. Agar price support level se bounce hoti hai, to ye bullish signal hota hai aur uptrend ka indication hota hai. Agar price resistance level se girti hai, to ye bearish signal hota hai aur downtrend ka indication hota hai.

        Support aur resistance lines market ke behavioral patterns ko reflect karti hain aur future price movements ko predict karne mein madad karti hain. Ye lines market ke key levels aur potential reversal points ko identify karti hain, jo trading strategies ko optimize karne mein madad karti hain. Market trends ke analysis se traders ko trading decisions ko better execute karne aur market trends ko accurately predict karne mein madad milti hai.

        Support aur resistance lines market ke overall direction aur trends ko define karti hain. Ye lines market ke fluctuations aur price movements ko track karne mein madad karti hain aur trading strategies ko guide karti hain. Support aur resistance lines ke effective use se traders market ke trends ko accurately samajh sakte hain aur trading decisions ko optimize kar sakte hain.

        Support aur resistance lines market ke key levels aur price movements ko define karti hain. Ye lines market ke behavior ko reflect karti hain aur trading decisions ko better execute karne mein madad karti hain. Market trends ke analysis se traders ko future price movements ko accurately predict karne mein madad milti hai.

        11. Psychological Levels

        Psychological levels trading aur investing mein important role play karte hain. Ye levels wo round numbers hote hain jo traders aur investors ke liye significant hote hain, jaise 100, 1000, 5000, etc. Psychological levels market mein key support aur resistance levels ban sakte hain aur price movements ko influence karte hain.

        Psychological levels traders aur investors ke behavior ko reflect karte hain. Ye levels market mein ek psychological barrier ban jati hain, jahan pe traders aur investors apne positions ko adjust karte hain. Psychological levels ka analysis market ke key levels aur price movements ko samajhne mein madad karta hai.

        Psychological levels ko identify karne ke liye, traders market ke round numbers aur price points ko dekhte hain. Ye levels market mein strong support aur resistance ban sakte hain aur price movements ko track karne mein madad karte hain. Psychological levels ke analysis se traders ko market ke key levels aur potential reversal points ka idea milta hai.

        Psychological levels market ke behavioral patterns aur trading decisions ko influence karte hain. Ye levels market ke overall direction aur trends ko define karte hain aur trading strategies ko guide karte hain. Psychological levels ka effective use market ke fluctuations aur price movements ko accurately predict karne mein madad karta hai.

        Psychological levels market ke key support aur resistance levels ko establish karte hain. Ye levels traders aur investors ke behavior ko reflect karte hain aur price movements ko influence karte hain. Psychological levels ke analysis se traders market ke key levels aur trading decisions ko better samajh sakte hain.

        12. Volume Aur Support-Resistance Lines

        Volume trading aur market analysis mein ek important factor hota hai. Volume ka support aur resistance lines ke sath strong relation hota hai. Jab price high volume ke sath support ya resistance level ko test karti hai, to ye level ki strength ko confirm karta hai.

        Volume ka analysis market ke behavior aur price movements ko samajhne mein madad karta hai. High volume ke sath price support ya resistance level ko test karna us level ki strength ko indicate karta hai. Volume ke analysis se traders ko market ke key levels aur potential reversal points ka idea milta hai.

        Volume ka support aur resistance lines ke sath relationship market ke trends aur fluctuations ko define karta hai. Agar volume high hai aur price support level ko test kar rahi hai, to wo level strong support hota hai. Agar volume high hai aur price resistance level ko test kar rahi hai, to wo level strong resistance hota hai.

        Volume analysis market ke key levels aur price movements ko track karne mein madad karta hai. Ye analysis trading decisions ko guide karta hai aur market ke fluctuations ko accurately predict karne mein madad karti hai. Volume ke sath support aur resistance lines ka combined analysis market trends ko better samajhne mein help karta hai.

        Volume aur support-resistance lines ke effective use se traders market ke key levels aur trends ko accurately track kar sakte hain. Ye analysis market ke behavior aur price movements ko reflect karti hai aur trading strategies ko optimize karne mein madad karti hai. Volume ke analysis se market trends aur trading decisions ko better execute karna possible hota hai.

        13. Fakeouts Aur False Breakouts

        Fakeouts aur false breakouts market ke price movements aur trends ko samajhne mein important hoti hain. Fakeouts tab hoti hain jab price support ya resistance level ko break karti hai lekin wapas us level ke neeche ya upar aa jati hai. False breakouts market ke behavioral patterns ko reflect karti hain aur trading decisions ko impact karti hain.

        Fakeouts aur false breakouts ko identify karne ke liye traders price action aur volume analysis ka use karte hain. Jab price support ya resistance level ko break karti hai aur volume high nahi hota, to ye false breakout ho sakta hai. Fakeouts aur false breakouts market ke trends aur price movements ko accurately predict karne mein madad karte hain.

        Fakeouts aur false breakouts ke analysis se traders market ke behavioral patterns aur price movements ko samajh sakte hain. Ye analysis trading decisions ko optimize karne aur market ke fluctuations ko track karne mein madad karti hain. Fakeouts aur false breakouts ko identify karne se traders ko market ke key levels aur potential reversal points ka idea milta hai.

        Fakeouts aur false breakouts market ke overall direction aur trends ko define karne mein madad karti hain. Ye patterns market ke fluctuations aur price movements ko reflect karti hain aur trading strategies ko guide karti hain. Effective analysis se traders market ke behavior aur price movements ko accurately predict kar sakte hain.

        Fakeouts aur false breakouts ko handle karne ke liye traders ko market ke trends aur key levels ko accurately analyze karna padta hai. Ye patterns market ke behavioral patterns ko reflect karti hain aur trading decisions ko better execute karne mein madad karti hain. Fakeouts aur false breakouts ke effective analysis se trading strategies ko optimize karna possible hota hai.

        14. Conclusion

        Support aur resistance lines market analysis ke core components hain jo trading aur investing mein fundamental role play karti hain. Ye lines market ke key levels ko define karti hain aur price movements ko track karne mein madad karti hain. Support aur resistance lines ko effectively use karke traders market trends ko predict karne aur trading decisions ko better execute karne mein madad le sakte hain.

        Support aur resistance lines ki identification aur analysis market ke overall direction aur trends ko samajhne mein help karti hai. Ye lines price fluctuations aur trading volumes ko reflect karti hain aur future price movements ko predict karne mein madad karti hain. Effective support aur resistance lines ke analysis se market trends ko accurately track karna aur trading strategies ko optimize karna possible hota hai.

        Historical data, volume analysis, aur psychological levels ka use support aur resistance lines ke analysis ko comprehensive aur accurate banata hai. Market ke behavioral patterns aur key levels ko identify karne se trading decisions ko better execute kiya ja sakta hai aur market trends ko accurately predict kiya ja sakta hai.

        Support aur resistance lines ka concept technical analysis ka aik buniyadi hissa hai, jo trading aur investing mein fundamental role play karta hai. In lines ke effective use se traders market ke key levels aur trends ko accurately samajh sakte hain aur trading strategies ko optimize kar sakte hain. Market analysis aur trading decisions ko better execute karne ke liye support aur resistance lines ka comprehensive understanding zaroori hai.
        • #5 Collapse

          Support aur Resistance Line Location
          Ta'aruf

          Support aur resistance lines technical analysis ka buniyadi hissa hain jo financial markets, khaaskar stock aur forex trading, mein use kiye jate hain. Ye lines market ke potential reversal points ko identify karne aur trading decisions ko behtar banane mein madad karti hain.

          Support Line

          Support line wo level hai jahan price ek time par girti hai, lekin wahan se bounce back hoti hai. Iska matlab hai ke market ke participants ko is price level par buying interest hota hai, jo price ko niche girne se rokta hai.

          Support Line Ki Pehchaan:

          1. Historical Data:

          Support line ko pehchanne ke liye aapko past price movements ko dekhna padta hai. Agar kisi price level par price pehle bhi ruk gayi ho, to wo level support ban sakta hai.

          2. Volume Analysis:

          Jab price support level par aati hai aur volume bhi badh jaata hai, to ye confirm karta hai ke support level mazboot hai.

          3. Price Action:

          Agar price support level par repeatedly rukti hai aur wahan se upar jati hai, to ye support line ki mazbooti ko darshata hai.

          Reistance Line

          Resistance line wo level hai jahan price ek time par barhti hai, lekin wahan se girti hai. Iska matlab hai ke market ke participants ko is price level par selling interest hota hai, jo price ko upar jane se rokta hai.

          Resistance Line Ki Pehchaan:

          1. Historical Data:

          Resistance line ko pehchanne ke liye aapko historical price movements ka analysis karna padta hai. Agar kisi price level par price pehle bhi ruk gayi ho aur phir gir gayi ho, to wo level resistance ban sakta hai.

          2. Volume Analysis:

          Jab price resistance level par aati hai aur volume bhi badh jaata hai, to ye resistance level ki strength ko confirm karta hai.

          3. Price Action:

          Agar price resistance level par repeatedly rukti hai aur wahan se neeche girti hai, to ye resistance line ki mazbooti ko darshata hai.

          Support aur Resistance Lines Ka Use

          1. Entry aur Exit Points:

          Traders support aur resistance lines ko entry aur exit points identify karne ke liye use karte hain. Agar price support level ke aas-paas hai, to ye buy signal ho sakta hai, aur agar resistance level ke aas-paas hai, to ye sell signal ho sakta hai.

          2. Stop-Loss aur Take-Profit Levels:

          Support aur resistance lines ko stop-loss aur take-profit levels set karne ke liye bhi use kiya ja sakta hai. Support level ke neeche stop-loss place karke aur resistance level ke upar take-profit place karke traders apne risk ko manage kar sakte hain.

          3. Trend Analysis:

          Support aur resistance lines trend reversal points ko identify karne mein madad karti hain. Agar price support level ko break kar deti hai, to trend reversal ka signal ho sakta hai, aur agar price resistance level ko break kar deti hai, to upward trend ka signal mil sakta hai.

          Nateejah

          Support aur resistance lines financial markets ke technical analysis mein aham role ada karti hain. In lines ko sahi tarah se identify aur use karke traders apni trading strategies ko behtar bana sakte hain. Historical data, volume analysis, aur price action ko madde nazar rakhtay hue, traders accurate support aur resistance levels ko identify kar sakte hain aur apne trading decisions ko enhance kar sakte hain.
          • #6 Collapse

            **Support Aur Resistance Line Location: Forex Trading Mein Kaise Identify Karein**
            Forex trading mein support aur resistance lines market ke critical levels hain jo price movements aur trading decisions ko impact karte hain. Ye levels traders ko market trends ko samajhne aur potential entry aur exit points identify karne mein madad karte hain. Is post mein hum support aur resistance lines ki location aur unko identify karne ke tareeqon ko discuss karenge.

            **Support Aur Resistance Lines Ki Definition:**

            1. **Support Line:**
            - Support line woh level hota hai jahan price decline karne ke bawajood ruk jaati hai. Ye ek aisa level hota hai jahan buyers demand barhate hain aur price ko niche girne se rokte hain.
            - Example: Agar EUR/USD price 1.1500 pe decline hoti hai lekin repeatedly wahi level pe rukti hai, to 1.1500 support level ban jata hai.

            2. **Resistance Line:**
            - Resistance line woh level hota hai jahan price rise karne ke bawajood ruk jaati hai. Ye ek aisa level hota hai jahan sellers supply barhate hain aur price ko upar jane se rok dete hain.
            - Example: Agar GBP/USD price 1.3000 pe rise hoti hai lekin repeatedly wahi level pe rukti hai, to 1.3000 resistance level ban jata hai.

            **Support Aur Resistance Lines Ki Location Kaise Identify Karein:**

            1. **Historical Price Levels:**
            - Historical price data ko analyze karna support aur resistance levels identify karne ka pehla step hai. Pichle price movements ko dekh kar, aap wo levels identify kar sakte hain jahan price ne past mein bounce ya reverse kiya ho.
            - Example: Agar price pichle kuch mahino se 1.1500 pe bounce kar rahi hai, to ye level aapke current analysis mein support line ke roop mein consider kiya ja sakta hai.

            2. **Trendlines:**
            - Trendlines ko draw karke support aur resistance levels ko identify kiya ja sakta hai. Uptrend ke dauran, trendline lower highs ko connect karti hai jo support level banate hain. Downtrend ke dauran, trendline higher lows ko connect karti hai jo resistance level banate hain.
            - Example: Agar aapne uptrend ki trendline draw ki hai jo consistently price ko support kar rahi hai, to ye trendline support level ka indication hoti hai.

            3. **Moving Averages:**
            - Moving averages jaise 50-day aur 200-day moving averages bhi support aur resistance levels ko identify karne mein madadgar hoti hain. Moving averages price action ke sath adjust hoti hain aur dynamic support aur resistance levels provide karti hain.
            - Example: Agar 50-day moving average price ke neeche hai aur price repeatedly is level pe bounce kar rahi hai, to ye moving average support level ka indication hai.

            4. **Pivot Points:**
            - Pivot points technical analysis ka ek popular tool hai jo potential support aur resistance levels ko calculate karta hai. Pivot points, support aur resistance levels ko predefined mathematical formulas ke through determine karta hai.
            - Example: Agar daily pivot point 1.2500 hai, to iske around support aur resistance levels calculate kiye ja sakte hain jo trading decisions ko guide karte hain.

            5. **Price Action:**
            - Price action analysis bhi support aur resistance levels ko identify karne mein helpful hota hai. Price patterns jaise double tops, double bottoms, aur head and shoulders patterns price reversal aur continuation signals provide karte hain.
            - Example: Agar price ek level pe repeatedly top banati hai, to ye level resistance aur agar price ek level pe bottom banati hai, to ye level support ban sakta hai.

            **Support Aur Resistance Levels Ko Use Karne Ke Fayde:**

            1. **Trade Entry Aur Exit Points:**
            - Support aur resistance levels ko use karke traders potential entry aur exit points ko identify kar sakte hain. Support levels pe buying opportunities aur resistance levels pe selling opportunities milti hain.

            2. **Risk Management:**
            - Support aur resistance levels se stop-loss aur take-profit orders ko set karna effective risk management ke liye zaroori hai. Stop-loss ko support level ke neeche aur take-profit ko resistance level ke upar set kiya ja sakta hai.

            3. **Market Sentiment Analysis:**
            - Support aur resistance levels market sentiment ko bhi reflect karte hain. Agar price consistently ek support level pe bounce kar rahi hai, to market bullish sentiment ko indicate karta hai aur agar resistance level pe repeatedly rukh raha hai, to bearish sentiment ko indicate karta hai.

            **Conclusion:**

            Support aur resistance lines forex trading mein essential tools hain jo traders ko price movements ko samajhne aur trading decisions ko guide karne mein madad karte hain. Historical price levels, trendlines, moving averages, pivot points, aur price action ko analyze karke aap effective support aur resistance levels identify kar sakte hain. In levels ko accurately use karke aap apne trading strategies ko enhance kar sakte hain aur market mein successful trading decisions le sakte hain.
             
            • #7 Collapse

              Support and Resistance Line Location in Forex Trading

              1. Introduction Forex trading mein support aur resistance lines ka concept trading strategy ke liye bohot zyada important hai. Ye lines market ke key price levels ko identify karne mein madad deti hain, jahan par price ka direction reverse ho sakta hai ya continue ho sakta hai. Support aur resistance lines ko samajhna traders ko market trends ko accurately predict karne mein madad karta hai. Jab ek trader in levels ko samajh le, to woh apni trading strategy ko behtar bana sakta hai, aur market ke fluctuations ko handle karne mein zyada confident feel karta hai.

              Support aur resistance lines ko identify karne ke liye, historical price data ka analysis kiya jata hai. Ye lines market ke psychological levels ko represent karti hain jo traders ke trading decisions ko influence karte hain. In levels ko identify karne ke liye traders technical analysis tools ka istemal karte hain jaise ke trendlines, moving averages, aur other indicators. Support aur resistance lines ke concept ko samajhkar, traders market ke behavior ko behtar predict kar sakte hain aur apni trading strategy ko optimize kar sakte hain.

              Is article mein, hum detailed analysis karenge ke support aur resistance lines ko kaise identify kiya jata hai aur unka practical application trading decisions mein kaisa hota hai. Hum ye bhi dekhenge ke support aur resistance lines market trends ko kaise define karti hain aur kaise traders in lines ko use karke apni trading strategy ko enhance kar sakte hain.

              2. Support Line Kya Hai? Support line ek aisa price level hota hai jahan market ki demand itni zyada hoti hai ke price ko girne se roka jata hai. Jab price is level tak aati hai, to buyers market mein enter karte hain aur price ko support dete hain. Is wajah se price is level par rukti hai aur niche girne se bachti hai. Support line market ke liye ek psychological barrier ka kaam karti hai, jo buyers ko attract karti hai aur unhe market mein rehte hue dekhne ko milta hai.

              Support line ko identify karne ke liye traders historical price data ko analyze karte hain. Agar price kuch baar ek specific level par girti hai aur wahan se bounce karti hai, to wo level support line ban jata hai. Support line market ke price movement ke patterns ko samajhne mein madad karti hai aur traders ko entry points identify karne mein help karti hai. Jab price is level ko test karti hai aur bounce karti hai, to traders ko ye signal milta hai ke market is level par support find kar rahi hai.

              Support line ko identify karne ke liye, traders ko price ke historical data ko dhyan se dekhna padta hai. Unhein dekhnna padta hai ke price kis level par zyada baar rukti hai ya bounce karti hai. Ye levels traders ko market ke key points identify karne mein madad karte hain, jahan par price reversals ya continuations ho sakti hain.

              3. Resistance Line Kya Hai? Resistance line ek aisa price level hota hai jahan market ki supply itni zyada hoti hai ke price ko aage barhne se roka jata hai. Jab price is level tak aati hai, to sellers market mein enter karte hain aur price ko resistance dete hain. Is wajah se price is level par rukti hai aur upar barhne se bachti hai. Resistance line market ke liye ek psychological barrier ka kaam karti hai, jo sellers ko attract karti hai aur unhe market mein rehte hue dekhne ko milta hai.

              Resistance line ko identify karne ke liye traders historical price data ka analysis karte hain. Agar price kuch baar ek specific level par barhti hai aur wahan se girti hai, to wo level resistance line ban jata hai. Resistance line market ke price movement ke patterns ko samajhne mein madad karti hai aur traders ko entry points identify karne mein help karti hai. Jab price is level ko test karti hai aur girti hai, to traders ko ye signal milta hai ke market is level par resistance find kar rahi hai.

              Resistance line ko identify karne ke liye, traders ko price ke historical data ko dhyan se dekhna padta hai. Unhein dekhnna padta hai ke price kis level par zyada baar rukti hai ya girti hai. Ye levels traders ko market ke key points identify karne mein madad karte hain, jahan par price reversals ya continuations ho sakti hain.

              4. Support Aur Resistance Line Ka Concept Support aur resistance lines market ke psychological levels ko represent karti hain jo traders ke trading decisions ko influence karte hain. Ye levels market ke behavior ko define karte hain aur traders ko price ke movement ko samajhne mein madad karte hain. Jab price support line ko test karti hai, to traders ko ye signal milta hai ke market is level par support find kar rahi hai. Similarly, jab price resistance line ko test karti hai, to traders ko ye signal milta hai ke market is level par resistance find kar rahi hai.

              Support aur resistance lines ko samajhna traders ko market trends ko accurately predict karne mein madad karta hai. Ye lines market ke key price levels ko identify karti hain jahan par price reversals ya continuations ho sakti hain. Traders in levels ko analyze karke apni trading strategy ko optimize kar sakte hain aur market ke fluctuations ko handle karne mein zyada confident feel kar sakte hain.

              Support aur resistance lines ka concept market ke psychological behavior ko samajhne mein bhi madad karta hai. Ye lines market ke participants ke behavior ko reflect karti hain aur unke trading decisions ko influence karti hain. Traders in levels ko identify karke apni trading strategy ko better bana sakte hain aur market ke trends ko accurately predict kar sakte hain.

              5. Support Line Ko Kaise Identify Karein? Support line ko identify karne ke liye traders ko historical price data ka analysis karna padta hai. Jab price ek specific level par girti hai aur wahan se bounce karti hai, to wo level support line ban jata hai. Traders ko price ke historical data ko dhyan se dekhna padta hai aur identify karna padta hai ke price kis level par zyada baar girti hai aur wahan se bounce karti hai. Ye levels market ke key price points ko define karte hain jahan par price reversals ya continuations ho sakti hain.

              Support line ko identify karne ke liye, traders ko price ke historical data ka detailed analysis karna padta hai. Unhein price ke movement ke patterns ko samajhna padta hai aur identify karna padta hai ke price kis level par zyada baar girti hai aur wahan se bounce karti hai. Ye levels traders ko market ke key price points identify karne mein madad karte hain aur unke trading decisions ko optimize karne mein help karti hain.

              Support line ko identify karne ke liye, traders ko technical analysis tools ka istemal bhi karna padta hai. Trendlines aur moving averages ka use karke traders support levels ko accurately identify kar sakte hain. Ye tools market ke key price levels ko identify karne mein madad karte hain aur traders ko market ke behavior ko samajhne mein help karte hain.

              6. Resistance Line Ko Kaise Identify Karein? Resistance line ko identify karne ke liye, traders ko historical price data ka analysis karna padta hai. Jab price ek specific level par barhti hai aur wahan se girti hai, to wo level resistance line ban jata hai. Traders ko price ke historical data ko dhyan se dekhna padta hai aur identify karna padta hai ke price kis level par zyada baar barhti hai aur wahan se girti hai. Ye levels market ke key price points ko define karte hain jahan par price reversals ya continuations ho sakti hain.

              Resistance line ko identify karne ke liye, traders ko price ke historical data ka detailed analysis karna padta hai. Unhein price ke movement ke patterns ko samajhna padta hai aur identify karna padta hai ke price kis level par zyada baar barhti hai aur wahan se girti hai. Ye levels traders ko market ke key price points identify karne mein madad karte hain aur unke trading decisions ko optimize karne mein help karti hain.

              Resistance line ko identify karne ke liye, traders ko technical analysis tools ka istemal bhi karna padta hai. Trendlines aur moving averages ka use karke traders resistance levels ko accurately identify kar sakte hain. Ye tools market ke key price levels ko identify karne mein madad karte hain aur traders ko market ke behavior ko samajhne mein help karte hain.

              7. Support Aur Resistance Lines Ka Role Support aur resistance lines market ke trend ko define karte hain aur trading decisions ko influence karte hain. Jab price support line ko break karti hai, to market downtrend ki taraf move karti hai. Similarly, jab price resistance line ko break karti hai, to market uptrend ki taraf move karti hai. Ye lines market ke key price levels ko identify karti hain jahan par price reversals ya continuations ho sakti hain.

              Support aur resistance lines ka role market ke trend ko accurately predict karne mein bhi hota hai. Jab price support line ko test karti hai aur bounce karti hai, to ye signal hota hai ke market is level par support find kar rahi hai aur uptrend continue ho sakta hai. Similarly, jab price resistance line ko test karti hai aur girti hai, to ye signal hota hai ke market is level par resistance find kar rahi hai aur downtrend continue ho sakta hai.

              Support aur resistance lines ka role trading strategy ko enhance karne mein bhi hota hai. Traders in levels ko identify karke apni trading strategy ko optimize kar sakte hain aur market ke fluctuations ko handle karne mein zyada confident feel kar sakte hain. Ye lines market ke key price points ko identify karti hain jahan par price reversals ya continuations ho sakti hain, aur traders ko entry aur exit points determine karne mein madad karti hain.

              8. Dynamic Aur Static Lines Support aur resistance lines ko dynamic aur static lines mein divide kiya jata hai. Static lines woh hain jo specific price levels par banti hain aur wohi level barqarar rehta hai. Dynamic lines market ke trend ke sath change hoti hain aur trendlines ke zariye banti hain. Static lines historical price data ke analysis ke zariye identify ki jati hain, jabke dynamic lines trend ke sath adjust hoti hain.

              Static lines market ke historical price levels ko represent karti hain aur ye levels market ke psychological barriers ko define karte hain. Dynamic lines market ke current trend ke sath adjust hoti hain aur trendlines ke zariye identify ki jati hain. Ye lines market ke changing trends ko reflect karti hain aur traders ko market ke behavior ko accurately predict karne mein madad karti hain.

              Dynamic lines market ke trend ke sath change hoti hain aur trendlines ke zariye banti hain. Traders in lines ko use karke market ke current trend ko identify kar sakte hain aur apni trading strategy ko optimize kar sakte hain. Static aur dynamic lines dono market ke key price levels ko identify karne mein madad karti hain aur trading decisions ko influence karti hain.

              9. Trendlines Aur Channels Trendlines aur channels support aur resistance lines ki tarah hi hoti hain lekin yeh slanted hoti hain. Trendlines market ke trend ko represent karti hain aur price ke movement ke patterns ko define karti hain. Channels banate waqt, ek trendline ko support aur doosri ko resistance line ke tor par use kiya jata hai. Ye channels market ke price movement ko define karte hain aur traders ko entry aur exit points identify karne mein madad karte hain.

              Trendlines ko identify karne ke liye, traders market ke price movement ke patterns ko analyze karte hain aur trendlines ko draw karte hain. Channels banate waqt, ek trendline ko support aur doosri ko resistance line ke tor par use kiya jata hai. Ye channels market ke key price levels ko define karte hain aur traders ko market ke behavior ko accurately predict karne mein madad karte hain.

              Trendlines aur channels market ke trend ko accurately identify karne mein madad karti hain. Traders in lines ko use karke market ke price movement ko define kar sakte hain aur apni trading strategy ko optimize kar sakte hain. Ye lines market ke key price levels ko identify karti hain aur trading decisions ko influence karti hain.

              10. Multiple Support Aur Resistance Levels Market mein kai support aur resistance levels ho sakte hain. Jab ek level break hota hai, market agle level ki taraf move karti hai. Traders multiple levels ko analyze karte hain taake price ke movement ko predict kar sakein. Multiple support aur resistance levels market ke key price points ko define karte hain aur traders ko entry aur exit points identify karne mein madad karte hain.

              Multiple levels ko identify karne ke liye, traders historical price data ka analysis karte hain aur market ke key price levels ko identify karte hain. Jab ek level break hota hai, market agle level ki taraf move karti hai aur traders ko price ke movement ko accurately predict karne mein madad milti hai. Multiple support aur resistance levels market ke key price points ko define karte hain aur traders ko apni trading strategy ko optimize karne mein help karti hain.

              Traders multiple levels ko analyze karke price ke movement ko accurately predict kar sakte hain aur apni trading strategy ko optimize kar sakte hain. Ye levels market ke key price points ko define karte hain aur trading decisions ko influence karti hain. Multiple support aur resistance levels market ke fluctuations ko handle karne mein madad karte hain aur traders ko zyada confident feel karne mein help karte hain.

              11. Price Action Analysis Support aur resistance lines ka analysis price action ke zariye bhi kiya jata hai. Price action se pata chalta hai ki price ka behavior kaisa hai aur market kis direction mein move kar sakti hai. Price action analysis traders ko market ke behavior ko samajhne mein madad karti hai aur unhe accurate trading decisions lene mein help karti hai.

              Price action analysis ke zariye traders market ke price movement ke patterns ko analyze karte hain aur support aur resistance lines ko identify karte hain. Ye analysis market ke key price levels ko identify karne mein madad karti hai aur trading decisions ko influence karti hai. Price action analysis market ke behavior ko samajhne mein madad karti hai aur traders ko apni trading strategy ko optimize karne mein help karti hai.

              Price action analysis ka use karke traders market ke key price levels ko accurately identify kar sakte hain aur trading decisions ko optimize kar sakte hain. Ye analysis market ke behavior ko samajhne mein madad karti hai aur traders ko price ke movement ko accurately predict karne mein help karti hai.

              12. Practical Application Support aur resistance lines ka practical application trading decisions mein hota hai. Traders in levels ko entry aur exit points determine karne ke liye use karte hain. Stop loss aur take profit orders bhi in levels ke aas paas set kiye ja sakte hain. Practical application se traders market ke key price levels ko identify kar sakte hain aur apni trading strategy ko optimize kar sakte hain.

              Support aur resistance lines ka practical application trading strategy ko enhance karne mein bhi hota hai. Traders in lines ko use karke entry aur exit points determine karte hain aur apni trading strategy ko optimize karte hain. Stop loss aur take profit orders bhi in levels ke aas paas set kiye ja sakte hain, jo traders ko market ke fluctuations ko handle karne mein madad karte hain.

              Practical application se traders market ke key price levels ko accurately identify kar sakte hain aur trading decisions ko optimize kar sakte hain. Ye lines market ke behavior ko samajhne mein madad karti hain aur traders ko zyada confident feel karne mein help karti hain.

              13. Conclusion Support aur resistance lines forex trading mein important tools hain jo market trends ko samajhne aur trading decisions lene mein madad karte hain. In lines ko accurately identify karna aur unka analysis karna ek successful trading strategy ka hissa hai. Support aur resistance lines market ke key price levels ko define karti hain aur trading decisions ko influence karti hain.

              Support aur resistance lines ko samajhna traders ko market trends ko accurately predict karne mein madad karta hai aur apni trading strategy ko optimize karne mein help karta hai. In levels ko identify karne ke liye traders ko historical price data ka detailed analysis karna padta hai aur technical analysis tools ka istemal karna padta hai. Ye lines market ke key price points ko identify karne mein madad karti hain aur trading decisions ko enhance karti hain.

              Support aur resistance lines ka accurate identification aur analysis traders ko market ke fluctuations ko handle karne mein madad karta hai aur unhe zyada confident feel karne mein help karta hai. Trading strategy ko optimize karne ke liye, traders ko in lines ka use karna chahiye aur market ke behavior ko accurately predict karna chahiye.
              • #8 Collapse

                **Support and Resistance Line Location**

                Trading ki duniya mein, support aur resistance lines ek buhat ahem role play karti hain. Yeh lines traders ko market ke trends samajhne mein madad deti hain aur potential entry ya exit points ko identify karne mein help karti hain. Is post mein, hum support aur resistance lines ko locate karne ke kuch tareeqon par baat karenge.

                ### Support Line

                Support line wo level hota hai jahan par price girte hue ruk jaati hai aur wahan se bounce karne lagti hai. Yeh wo point hota hai jahan par buyers zyada active ho jaate hain aur price ko niche girne se rokte hain. Support line ko locate karne ke liye, aapko chart mein un points ko dekhna hoga jahan price pehle gir ke wapas upar gayi ho.

                Support line draw karte waqt, aapko zaroori hai ke kam az kam do points ko connect karein jahan price ne bounce kiya ho. Agar price is level par baar baar support paati hai, toh yeh level mazid mazboot ho jata hai.

                ### Resistance Line

                Resistance line wo level hota hai jahan par price upar chadte hue ruk jaati hai aur wahan se neeche girne lagti hai. Yeh wo point hota hai jahan par sellers zyada active ho jaate hain aur price ko upar jaane se rokte hain. Resistance line ko locate karne ke liye, aapko chart mein un points ko dekhna hoga jahan price pehle upar chad ke wapas neeche gayi ho.

                Resistance line draw karte waqt bhi, aapko kam az kam do points ko connect karna hota hai jahan price ne resistance ka samna kiya ho. Agar price is level par baar baar rukti hai, toh yeh level mazid mazboot ho jata hai.

                ### Support aur Resistance Lines ko Draw Karne ke Tips

                1. **Multiple Timeframes Check Karein:** Higher timeframe charts, jaise ke daily ya weekly, par support aur resistance lines ko draw karke dekhna ahem hai kyunke yeh zyada reliable hote hain.

                2. **Round Numbers:** Round numbers, jaise 1.2000 ya 1.5000, aksar support ya resistance ke taur par act karte hain, kyunke traders inhe psychological levels samajhte hain.

                3. **Trendlines:** Trendlines ko use karte hue support aur resistance levels ko samajhne ki koshish karein. Yeh lines price action ko ek specific direction mein samajhne mein madadgar hote hain.

                4. **Technical Indicators:** Moving averages, Bollinger bands, aur Fibonacci retracement jaise technical indicators bhi support aur resistance lines ko identify karne mein madadgar ho sakte hain.

                ### Conclusion

                Support aur resistance lines ka sahi taur par location karna trading mein buhat zaroori hai. Yeh aapko price ke movements ko samajhne aur trading decisions lene mein madad deti hain. Inhe locate karte waqt accuracy aur practice zaroori hai taake aap market ki dynamics ko behtar samajh sakein. Trading ka yeh skill aapke profits ko improve karne mein ek buhat bara factor ban sakta hai.
                • #9 Collapse

                  Support aur resistance lines trading mein do bohot ahm concepts hain, jo market ki price movement ka taluq samajhne ke liye istemal hote hain. Ye lines traders aur investors ko market trends aur price reversal points ka pata lagane mein madad deti hain, jo unhein behtar trading decisions lene mein madadgar hoti hain.


                  1. Support Line
                  Support line ek aisi level hai jahaan par price market mein neeche ki taraf girne ke baad ruk jaata hai ya wapas upar chalay jaata hai. Yeh wo level hoti hai jahaan buyers zyada strong hote hain aur sellers ki supply se zyada demand hoti hai. Jab price kisi support level tak pohanchti hai, toh traders expect karte hain ke price wahan se bounce karegi ya neeche se upar chalegi, kyunke buyers ne us price point par entry shuru kar di hoti hai.

                  2. Resistance Line
                  Resistance line us level ko kehte hain jahaan par price market mein upar ki taraf barhne ke baad ruk jaata hai ya wapas neeche chala jaata hai. Yahan par sellers zyada strong hote hain aur buyers ki demand se zyada supply hoti hai. Jab price kisi resistance level tak pohanchti hai, toh traders expect karte hain ke price wahan se giray gi, kyunke sellers ne is price point par selling pressure banana shuru kar diya hota hai.

                  Support aur Resistance Lines kaise Locate ki jati hain?
                  Support aur resistance lines ko locate karna asan kaam nahi hai, magar kuch specific techniques aur tools hain jo traders ko ye kaam asani se karne mein madad dete hain. Yahaan kuch ahm tareeqay diye gaye hain jinki madad se aap support aur resistance levels locate kar sakte hain.

                  1. Price Action Analysis
                  Yeh aik traditional method hai jisme sirf price ki movement ko dekh kar support aur resistance lines ko locate kiya jata hai. Aap historical price movement ko analyze karte hain aur wo points identify karte hain jahaan par price bar-bar rukti hai, bounce karti hai ya reverse hoti hai. Aksar yeh wo areas hote hain jahaan par pehle bhi buyers ya sellers ne aggressive action liya hota hai.

                  2. Swing Highs aur Swing Lows
                  Swing highs aur swing lows bhi support aur resistance lines locate karne ka aik popular method hai. Swing high wo point hota hai jahaan par price temporarily apne upar ke level se wapas neeche aati hai, aur swing low wo point hota hai jahaan par price temporarily apne neeche ke level se wapas upar jati hai. In points ko dekh kar aap asani se potential support aur resistance levels draw kar sakte hain.

                  3. Moving Averages (MAs)
                  Moving averages bhi ek popular tool hai support aur resistance lines locate karne ke liye. Simple moving average (SMA) aur exponential moving average (EMA) dono ka istemal hota hai. Jab price kisi moving average se neeche girti hai toh yeh aksar support ka kaam karti hai, aur jab price moving average ke upar hoti hai, toh yeh resistance ka kaam karti hai.

                  4. Fibonacci Retracement Levels
                  Fibonacci retracement ek mathematical tool hai jo support aur resistance lines locate karne mein madadgar hota hai. Is tool ko istemal kar ke traders potential reversal points identify karte hain, jin par price apne trend ke against move karti hai. Yeh tool price ke high aur low points ke darmiyan kuch fixed percentage lines draw karta hai, jaise ke 38.2%, 50%, aur 61.8%. In levels par aksar price retrace hoti hai aur wapas apne trend ki taraf chali jati hai.

                  5. Trendlines
                  Trendlines bhi ek efficient method hai support aur resistance lines draw karne ka. Uptrend mein, trendline ke neeche jo line draw ki jati hai wo support ka kaam karti hai, aur downtrend mein trendline ke upar jo line hoti hai wo resistance ka kaam karti hai. Jab price in trendlines ke pass aati hai toh yeh possible bounce ya breakout ke signals hote hain.

                  6. Previous Highs aur Lows
                  Jahan par price pehle highest ya lowest levels tak gayi hoti hai, wahan aksar support aur resistance lines banti hain. Previous highs resistance ke kaam aate hain aur previous lows support ke taur par dekhe jate hain. Aksar traders in points ko dekh kar apne trading decisions lete hain.

                  Support aur Resistance Levels ki Ahmiyat
                  Support aur resistance levels trading mein is liye bohot zyada ahmiyat rakhte hain kyunke yeh traders ko price ke movement ke possible points batate hain. Market psychology kaafi important role play karti hai in levels ke identify karne mein. Jab traders yeh dekhtay hain ke price ne pehle ek specific level par support ya resistance dekha tha, toh wo agay bhi us level par similar behavior expect karte hain.

                  Yeh kuch reasons hain jinki wajah se support aur resistance levels ko itna important samjha jata hai:

                  1. Trend Reversal Points
                  Support aur resistance levels aksar trend reversal points ban jaate hain. Jab price ek support level ko break kar leti hai, toh aksar downtrend shuru ho sakta hai, aur jab price resistance ko cross kar leti hai, toh uptrend ka aaghaaz ho sakta hai. Is wajah se yeh levels ek nayi direction ka indication dete hain aur traders ko signal milta hai ke kis taraf ka trade lena chahiye.

                  2. Risk Management
                  Support aur resistance levels ko use kar ke traders apni risk management strategy bana sakte hain. Agar aapko pata hai ke support level wahan par hai jahaan price rukti hai, toh aap apna stop-loss order us se thoda neeche rakh sakte hain. Isi tarah, resistance ke paas aap profit book karne ke liye sell kar sakte hain, agar aap long position mein hain.

                  3. Entry aur Exit Points
                  Yeh levels traders ko precise entry aur exit points batate hain. Support par buy karna aur resistance par sell karna ek bohot commonly used strategy hai. Jab price support se neeche girne lage, toh yeh sell signal ban jata hai, aur jab price resistance ko tod de, toh yeh buy signal ban sakta hai.

                  4. Market Sentiment ka Indicator
                  Support aur resistance levels market ke overall sentiment ko bhi reflect karte hain. Agar ek strong support level bar-bar hold kar raha hai, toh iska matlab yeh hai ke buyers market mein dominant hain. Agar ek resistance level bar-bar price ko neeche kar raha hai, toh yeh indicate karta hai ke sellers zyada strong hain.

                  Support aur Resistance Lines ka False Breakouts
                  False breakouts tab hote hain jab price temporarily support ya resistance level ko cross kar leti hai, magar jaldi se wapas usi level ke andar chali jati hai. Yeh situation aksar traders ko confuse karti hai, aur unhein galat signals milte hain. False breakouts ka samna karte waqt kuch strategies follow ki jati hain:

                  1. Volume Analysis
                  Jab price support ya resistance level ko break karti hai, toh volume ko check karna bohot zaroori hota hai. Agar price high volume ke saath break kare, toh yeh break strong hai, magar agar volume low hai toh yeh ek false breakout ho sakta hai.

                  2. Waiting for Confirmation
                  Aik aur strategy yeh hoti hai ke jab price support ya resistance ko break kare, toh aap thoda wait karein aur dekhein ke price us level ke upar ya neeche sustain karti hai ya nahi. Isko confirmation kehte hain. Agar price apni nayi position ko hold karti hai, toh aap trade enter kar sakte hain.

                  3. Multiple Timeframes
                  Aksar false breakouts ko avoid karne ke liye multiple timeframes par analysis kiya jata hai. Choti timeframes par breakouts aksar false hote hain, lekin agar aap higher timeframe par dekhen toh aapko asal trend ka pata chalega.


                  Support aur Resistance Lines ka Breakout Trading
                  Breakout trading ek strategy hai jisme aap price ke support ya resistance level ko break karne ka intezar karte hain, aur phir uske mutabiq apni position open karte hain. Yeh strategy aksar volatile markets mein kaam aati hai, jahan price tezi se move karti hai.

                  1. Uptrend Breakouts
                  Agar price ek resistance level ko break kar deti hai aur upar move karti hai, toh yeh uptrend ka signal hota hai. Traders is waqt buy positions lete hain, kyunke breakout ke baad aksar price tezi se upar jati hai.

                  2. Downtrend Breakouts
                  Isi tarah, agar price ek support level ko break kar ke neeche jati hai, toh yeh downtrend ka signal hota hai. Is waqt traders sell positions lete hain.

                  3. Retest Strategy
                  Ek popular strategy yeh hoti hai ke jab price support ya resistance ko break karti hai, toh aap intezaar karte hain ke price wapas us level ko retest kare. Agar price us level ko retest karne ke baad apne trend mein rahti hai, toh yeh confirm signal hota hai ke breakout real hai aur trade le sakte hain.

                  Support aur resistance lines trading ke liye bohot ahm tools hain jo market ke behavior ka samajh dene mein madadgar hote hain. In lines ko locate karna technical analysis ka ek bohot ahm hissa hai, aur inka sahi istemal trading mein profitable decisions lene mein madad deta hai. Aapko in concepts ka istamal karte waqt patience aur practice ki zaroorat hoti hai, magar jab aap inhe sahi tareeqay se samajh lete hain, toh aap market ke movements ko asani se samajh sakte hain aur apne trading outcomes ko improve kar sakte hain.
                  Believe in yourself and your abilities. When you fight for your dreams, you can achieve anything.
                  • #10 Collapse

                    **Support aur Resistance Line Location**
                    Forex trading mein support aur resistance lines ka samajhna bohot zaroori hai kyunke yeh market ke price movements ko samajhne aur trading decisions lene mein madad deti hain. Yeh lines aise points hote hain jahan price ke girne ya barhne ki ummed hoti hai.

                    **Support Line:**

                    Support line wo level hoti hai jahan price niche girne se rokti hai. Yeh ek aisa point hota hai jahan buyers ka interest barh jata hai aur sellers ka interest kam ho jata hai. Is level par price ne pehle bhi support liya hota hai aur yeh zone buying opportunities ke liye faydemand hota hai. Jab price support level tak pohanchti hai, to traders ko is baat ka intazar hota hai ke price wapas upar chalay gi.

                    **Resistance Line:**

                    Resistance line wo level hoti hai jahan price upar ki taraf barhne se rokti hai. Yeh ek aisa point hota hai jahan sellers ka interest badh jata hai aur buyers ka interest kam ho jata hai. Is level par price ne pehle bhi resistance face kiya hota hai aur yeh zone selling opportunities ke liye beneficial hota hai. Jab price resistance level tak pohanchti hai, to traders ko is baat ka intazar hota hai ke price wapas niche aayegi.

                    **Location kaise Determine Karein:**

                    Support aur resistance lines ko determine karne ke liye traders technical analysis tools aur price charts ka use karte hain. Pehle, historical data aur charts ko dekha jata hai jahan price ne pehle support aur resistance levels ko test kiya hota hai. Trendlines aur horizontal lines ko draw karke yeh levels identify kiye jate hain. Yeh lines price action ko monitor karke aur previous highs aur lows ko analyze karke bhi set kiye ja sakte hain.

                    **Support aur Resistance Lines ka Importance:**

                    Yeh lines trading decisions banate waqt bohot important hoti hain. Support aur resistance levels ke around price movements ko dekh kar traders buy aur sell signals generate karte hain. Jab price support line ko break karti hai, to yeh potential bearish signal hota hai, aur jab resistance line ko break karti hai, to yeh potential bullish signal hota hai. Yeh levels market trends aur price reversals ko predict karne mein bhi madad karte hain.

                    In short, support aur resistance lines ki location ko accurately identify karna traders ke liye crucial hai, kyunki yeh trading decisions ko guide karti hain aur market trends ko samajhne mein madad deti hain.
                    • <a href="https://www.instaforex.org/ru/?x=ruforum">InstaForex</a>
                    • #11 Collapse

                      Support Aur Resistance Lines Ki Pehchaan


                      Introduction
                      Support aur resistance lines technical analysis ke ahem tools hain jo traders ko market ki movement samajhne mein madad dete hain. Ye lines price levels hain jahan market ki movement rukne ya palatne ki umeed hoti hai. Is article mein hum support aur resistance lines ke concepts, unki pehchaan, aur inhe trade karne ke tareeqe par tafseel se baat karenge.

                      Support Line Kya Hai?
                      Support line woh price level hai jahan se market ko upward momentum milta hai. Jab price is line tak aati hai, to investors is price par zyada kharidari karte hain, jisse price mein izafa hota hai. Ye line market ke bearish trend ke dauran ek protective barrier ka kaam karti hai. Agar price support line ke neeche gir jaati hai, to ye line apni ahmiyat kho deti hai.

                      Resistance Line Kya Hai?
                      Resistance line us price level ko darshati hai jahan market mein selling pressure hota hai. Jab price is line tak pahunchti hai, to traders profit lene ke liye bechne lagte hain, jisse price mein kami aati hai. Agar price resistance line ko todti hai, to ye bullish signal hota hai, aur naye highs ki taraf ja sakti hai.

                      Support Aur Resistance Lines Ki Pehchaan
                      Support aur resistance lines ko pehchanne ke liye traders chart patterns, price action, aur historical data ka istemal karte hain. Ye lines aksar trend lines ya horizontal lines ki form mein hoti hain. Chart par pehle ke swing highs aur lows ko dekh kar in lines ki location ka andaza lagaya ja sakta hai.

                      Trend Lines Aur Support/Resistance
                      Trend lines ko support aur resistance lines ki tarah istemal kiya ja sakta hai. Uptrend mein, lower trend line support ka kaam karti hai jabke downtrend mein, upper trend line resistance ka. Ye trend lines market ki overall direction ko darshati hain aur un par price movements ka asar dekhne ko milta hai.

                      Horizontal Support Aur Resistance
                      Horizontal support aur resistance lines un price levels par hoti hain jahan market ne pehle price ke movement ke dauran significant reversal dekha ho. Ye lines aksar price chart par clear aur identifiable hoti hain, jahan market ne baar baar kisi price level par girawat ya upar uthne ka reaction diya ho.

                      Dynamic Support Aur Resistance
                      Dynamic support aur resistance woh levels hote hain jo price ke saath move karte hain. Moving averages, jaise 50-day aur 200-day moving averages, iski achi misaal hain. Inka istemal karte waqt, agar price in averages ke aas paas hai, to ye support ya resistance ka kaam kar sakti hain.

                      Market Psychology Aur Support/Resistance
                      Market psychology support aur resistance levels par ek ahm role ada karti hai. Jab traders kisi specific price level par reaction dekhte hain, to wo is par emotional decisions lete hain. Is wajah se ye levels zyada powerful ban jate hain, kyunki un par market ka collective sentiment saaf hota hai.

                      Breakouts Aur Fakeouts
                      Support aur resistance lines ki parkh karte waqt traders ko breakouts aur fakeouts ka khayal rakhna chahiye. Jab price support ya resistance level ko todti hai, to ye breakout kehlata hai. Lekin, agar price in levels ko tod kar wapas aati hai, to isay fakeout kaha jata hai. Traders ko in situations ka samna karne ke liye strong confirmation signals dekhne chahiye.

                      Volume Ka Role
                      Volume ka role bhi support aur resistance lines ki pehchaan mein ahmiyat rakhta hai. Agar price breakout ke waqt high volume ke saath aati hai, to ye breakout ki validity ko mazid majboot banata hai. Kam volume par breakout hone par ye signal zyada strong nahi hota aur isay fakeout hone ka khatara hota hai.

                      Timeframes Aur Support/Resistance
                      Support aur resistance lines alag alag timeframes par vary karte hain. Ek short-term trader 1-hour ya 15-minute charts par support aur resistance ki talash karta hai, jabke long-term traders daily ya weekly charts par focus karte hain. Isliye, trading strategy ke liye appropriate timeframe ka istemal karna zaroori hai.

                      Trading Strategies
                      Traders support aur resistance lines ka istemal karke different trading strategies bana sakte hain. Ek common strategy ye hai ke support level par buy order lagana aur resistance level par sell order lagana. Is strategy se traders market ke trends ko samajhkar in lines ka faida utha sakte hain.

                      Risk Management
                      Support aur resistance lines ki madad se risk management mein bhi madad milti hai. Traders in levels ko stop-loss orders ke liye istemal karte hain. Agar price support level ko todti hai, to stop-loss trigger ho jata hai, jisse trader apne losses ko minimize kar sakta hai.

                      Conclusion
                      Support aur resistance lines technical analysis ka ek ahem hissa hain. Inhe samajhna aur sahi tarah se istemal karna traders ke liye profitable trading ka raaz hai. Ye lines market ki psychology, volume, aur price action ke sath mil kar ek complete picture provide karte hain. Isliye, agar aap trading karte hain, to support aur resistance lines ki importance ko nazarandaz mat karein. Trading mein success ka raaz in lines ko samajhne aur inka sahi istemal karne mein hai.

                      اب آن لائن

                      Working...
                      X