Inverse Head and Shoulders Pattern: Forex Trading Mein Istemaal Aur Ahmiyat
Forex trading mein technical analysis ka aik ahem hissa hai jo traders ko price movements ko samajhne aur market trends ka andaza lagane mein madad deta hai. Is analysis ke liye kai patterns ka istemal hota hai, jismein se aik mehsoor pattern "Inverse Head and Shoulders" hai. Is maqale mein is pattern ke components, iska istemal, aur iski ahmiyat ko samjha jaega, sath hi is ke fayde aur nuqsan ka bhi jaiza liya jaega.
Inverse Head and Shoulders Pattern Kya Hai?
Inverse Head and Shoulders pattern aksar bearish trend ke baad banta hai aur ye bull trend ka chinh hota hai. Is pattern ko samajhne ke liye humein iske naam ki taraf dhyan dena hoga:
Is pattern ka maqsad price reversal ko darust karna hota hai, jismai bottom ke do shoulders aur beech mein head hota hai.
Components of the Inverse Head and Shoulders Pattern
Entry Point Ka Tain
Inverse Head and Shoulders pattern ko samajhne ke baad, traders entry points tay kar sakte hain. Is pattern ke completion ka intezar karna ahem hai. Jab price neckline ko cross karti hai, to ye entry point hota hai. Traders yahan buy position lene ki soch sakte hain.
Stop Loss Ka Istemaal
Stop loss ka istemal karna bhi zaroori hai. Is pattern mein stop loss ko right shoulder ke neeche rakha ja sakta hai taake potential losses se bacha ja sake.
Target Price Ka Andaza
Target price ka andaza neck line ke digital measurement se milta hai. Agar pattern ka maximum height measure kiya jaye aur usay neckline ke breakout level se jud diya jaye, to ye potential target price banega.
Inverse Head and Shoulders Pattern Ki Ahmiyat
Price Reversal Ka Indicator
Ye pattern price reversal ka aik mazboot indicator hai, jo traders ko show karta hai ke market bullish ho raha hai. Ye signal un traders ke liye beneficial hota hai jo long positions lena chahte hain.
Market Sentiment Ka Andaza
Is pattern ki madad se market sentiment ka andaza lagaya ja sakta hai. Jab ye pattern banta hai, to ye darust karta hai ke market mein bullish momentum aa raha hai, jo long-term mein positive reh sakta hai.
Inverse Head and Shoulders Pattern Ke Fayde
Easy Identification
Is pattern ko pehchanana asan hota hai, jo naye traders ke liye aik achi baat hai. Ismein sirf teen points hote hain jo easy identification ka kaam karte hain.
Profit Potential
Agar traders is pattern ke according sahi time par entry karte hain, to unhein profit kama ne ka acha mauka milta hai. Pattern ki ahmiyat se traders ko reliable price moves ka hissa banne ka mauka milta hai.
Inverse Head and Shoulders Pattern Ke Nuqsan
False Signals
Kabhi kabhi is pattern ke false signals bhi milte hain, jo traders ko nuqsan la sakte hain. Agar traders bina achhi analysis ke is pattern par rely karte hain, to ye unke liye problematic ho sakta hai.
Market Volatility
Market ki volatility ke wajah se ye pattern kabhi kabhi accurately nahi kaam karte. Traders ko is volatility ko mind mein rakhte hue apni trading strategies banani chahiye.
Patience Ki Zaroorat
Is pattern ko banta dekhne mein waqt lag sakta hai. Traders ko patience rakhni hogi kyunke ye pattern tawajjo se banta hai.
Conclusion
Inverse Head and Shoulders pattern forex trading mein bohat ahem hai, jo price reversal ke signals provide karta hai. Is pattern ki asani aur profit potential isse popular banati hai, lekin traders ko false signals aur market volatility se bhi aware rehna chahiye. Is pattern ke fayde aur nuqsan ko samajhne se traders apni trading strategies ko enhance kar sakte hain aur market mein behtar faislay le sakte hain. Proper analysis aur patience ke sath, traders is pattern ka istemal haqdari se kar sakte hain aur profitable trades hasil kar sakte hain.
Forex trading mein technical analysis ka aik ahem hissa hai jo traders ko price movements ko samajhne aur market trends ka andaza lagane mein madad deta hai. Is analysis ke liye kai patterns ka istemal hota hai, jismein se aik mehsoor pattern "Inverse Head and Shoulders" hai. Is maqale mein is pattern ke components, iska istemal, aur iski ahmiyat ko samjha jaega, sath hi is ke fayde aur nuqsan ka bhi jaiza liya jaega.
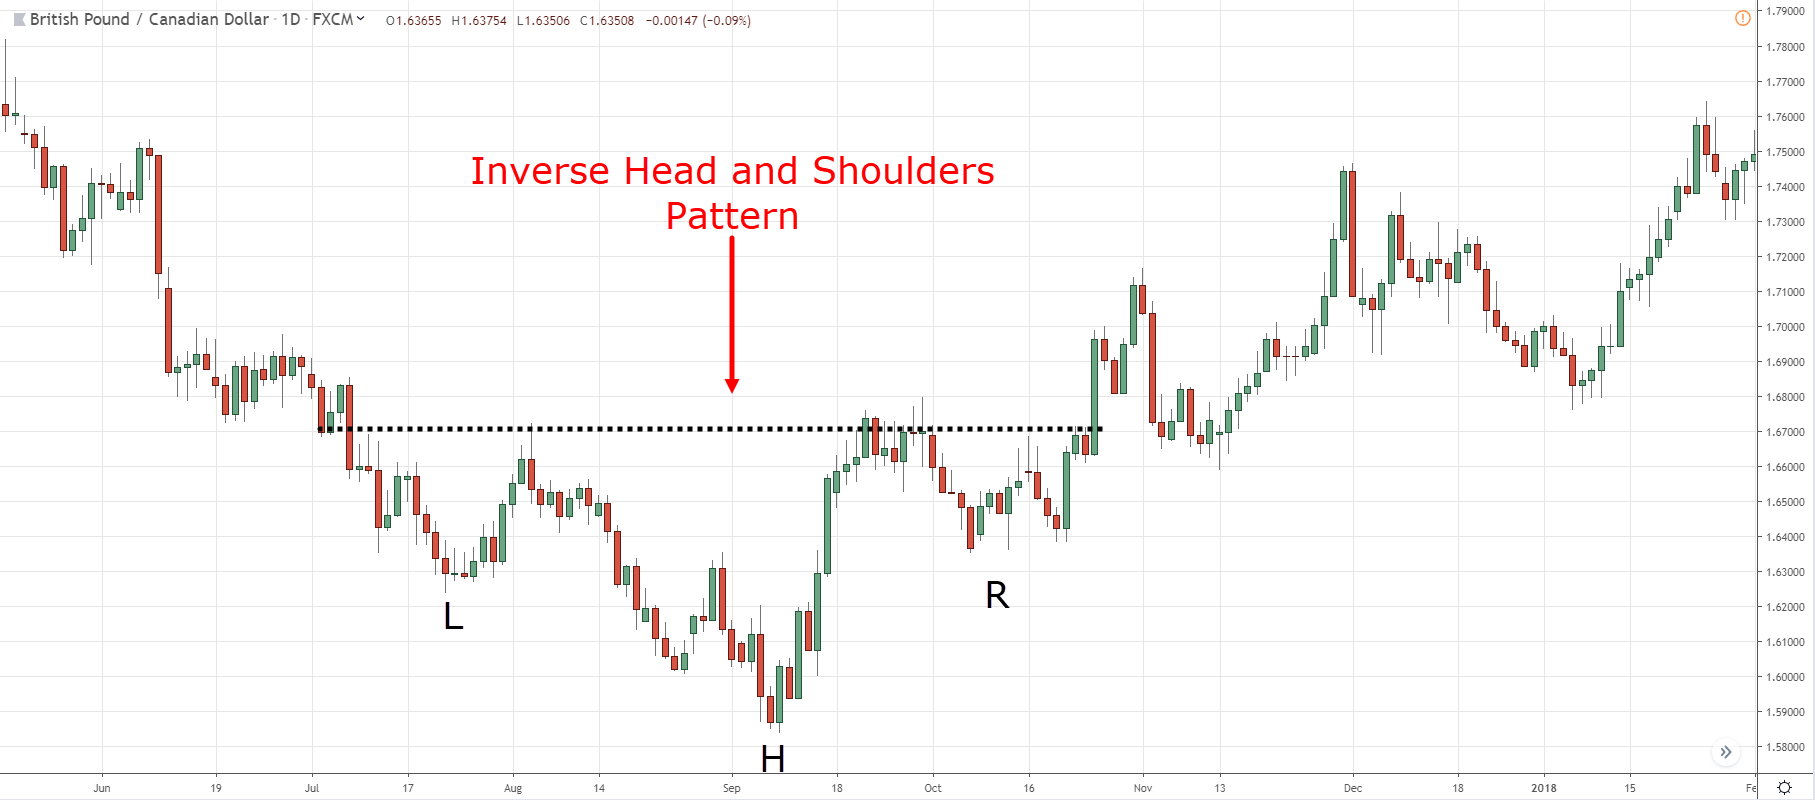
Inverse Head and Shoulders Pattern Kya Hai?
Inverse Head and Shoulders pattern aksar bearish trend ke baad banta hai aur ye bull trend ka chinh hota hai. Is pattern ko samajhne ke liye humein iske naam ki taraf dhyan dena hoga:
- Head: Ye pattern ka sabse neecha point hota hai.
- Shoulders: Ye pattern ke do outside points hote hain jo head ke aas paas bante hain.
Is pattern ka maqsad price reversal ko darust karna hota hai, jismai bottom ke do shoulders aur beech mein head hota hai.
Components of the Inverse Head and Shoulders Pattern
- Left Shoulder: Ye pattern ka pehla shoulder hai jo bearish trend ke beech banta hai. Iske baad price thodi der ke liye recover hoti hai, lekin phir wapas girti hai.
- Head: Ye pattern ka sabse neecha point hai. Jab price left shoulder ke baad giregi, to ye head banayega.
- Right Shoulder: Ye head ke baad banta hai. Is shoulder ke bante waqt, traders ko optimism ka ehsaas hota hai ki market recover ho raha hai.
- Neckline: Ye line left aur right shoulder ke highest points ko connect karti hai. Jab price is line ko cross karti hai, to ye bullish trend ka signal hota hai.
Entry Point Ka Tain
Inverse Head and Shoulders pattern ko samajhne ke baad, traders entry points tay kar sakte hain. Is pattern ke completion ka intezar karna ahem hai. Jab price neckline ko cross karti hai, to ye entry point hota hai. Traders yahan buy position lene ki soch sakte hain.
Stop Loss Ka Istemaal
Stop loss ka istemal karna bhi zaroori hai. Is pattern mein stop loss ko right shoulder ke neeche rakha ja sakta hai taake potential losses se bacha ja sake.
Target Price Ka Andaza
Target price ka andaza neck line ke digital measurement se milta hai. Agar pattern ka maximum height measure kiya jaye aur usay neckline ke breakout level se jud diya jaye, to ye potential target price banega.
Inverse Head and Shoulders Pattern Ki Ahmiyat
Price Reversal Ka Indicator
Ye pattern price reversal ka aik mazboot indicator hai, jo traders ko show karta hai ke market bullish ho raha hai. Ye signal un traders ke liye beneficial hota hai jo long positions lena chahte hain.
Market Sentiment Ka Andaza
Is pattern ki madad se market sentiment ka andaza lagaya ja sakta hai. Jab ye pattern banta hai, to ye darust karta hai ke market mein bullish momentum aa raha hai, jo long-term mein positive reh sakta hai.
Inverse Head and Shoulders Pattern Ke Fayde
Easy Identification
Is pattern ko pehchanana asan hota hai, jo naye traders ke liye aik achi baat hai. Ismein sirf teen points hote hain jo easy identification ka kaam karte hain.
Profit Potential
Agar traders is pattern ke according sahi time par entry karte hain, to unhein profit kama ne ka acha mauka milta hai. Pattern ki ahmiyat se traders ko reliable price moves ka hissa banne ka mauka milta hai.
Inverse Head and Shoulders Pattern Ke Nuqsan
False Signals
Kabhi kabhi is pattern ke false signals bhi milte hain, jo traders ko nuqsan la sakte hain. Agar traders bina achhi analysis ke is pattern par rely karte hain, to ye unke liye problematic ho sakta hai.
Market Volatility
Market ki volatility ke wajah se ye pattern kabhi kabhi accurately nahi kaam karte. Traders ko is volatility ko mind mein rakhte hue apni trading strategies banani chahiye.
Patience Ki Zaroorat
Is pattern ko banta dekhne mein waqt lag sakta hai. Traders ko patience rakhni hogi kyunke ye pattern tawajjo se banta hai.
Conclusion
Inverse Head and Shoulders pattern forex trading mein bohat ahem hai, jo price reversal ke signals provide karta hai. Is pattern ki asani aur profit potential isse popular banati hai, lekin traders ko false signals aur market volatility se bhi aware rehna chahiye. Is pattern ke fayde aur nuqsan ko samajhne se traders apni trading strategies ko enhance kar sakte hain aur market mein behtar faislay le sakte hain. Proper analysis aur patience ke sath, traders is pattern ka istemal haqdari se kar sakte hain aur profitable trades hasil kar sakte hain.
تبصرہ
Расширенный режим Обычный режим