Trading Mein Pivot Points Calculate Karna
Introduction
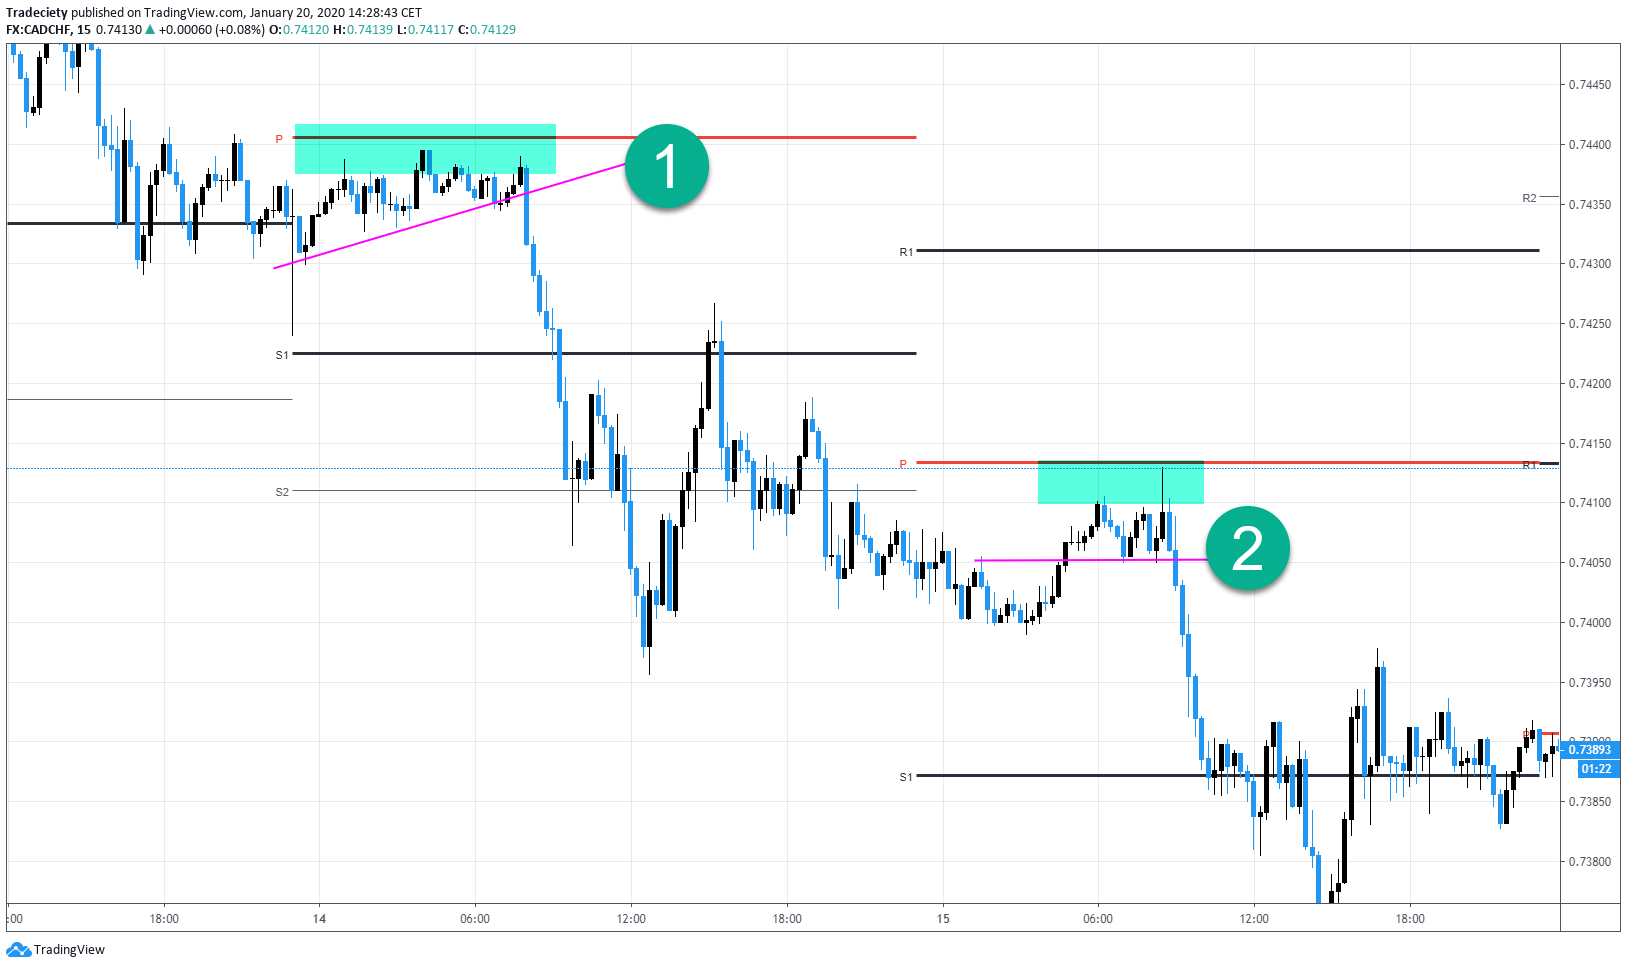
Trading mein pivot points ka istemal support aur resistance levels ko identify karne ke liye hota hai. Yeh points traders ko yeh samajhne mein madad dete hain ke market ke kis level par price reversal ya continuation ho sakta hai. Pivot points ko calculate karne ke bohot tareeqe hain, lekin sab se mashhoor aur aam tareeqa classic pivot point formula hai.
Pivot Point Formula
Classic pivot point formula ko use karne ke liye, humein pichle trading day ka high, low, aur close price ki zaroorat hoti hai. Yeh formula kuch is tarah hota hai:
Pivot Point (P)=(High+Low+Close)3\text{Pivot Point (P)} = \frac{(High + Low + Close)}{3}Pivot Point (P)=3(High+Low+Close)
Yeh central pivot point hota hai, aur isko use karke hum support aur resistance levels calculate karte hain.

Support Aur Resistance Levels
Central pivot point calculate karne ke baad, hum support aur resistance levels calculate kar sakte hain. Inhe hum S1, S2, R1, aur R2 kehte hain:
First Support (S1):
S1=(2×P)−HighS1 = (2 \times \text{P}) - \text{High}S1=(2×P)−High
First Resistance (R1):
R1=(2×P)−LowR1 = (2 \times \text{P}) - \text{Low}R1=(2×P)−Low
Second Support (S2):
S2=P−(High−Low)S2 = \text{P} - (\text{High} - \text{Low})S2=P−(High−Low)
Second Resistance (R2):
R2=P+(High−Low)R2 = \text{P} + (\text{High} - \text{Low})R2=P+(High−Low).
Example Calculation
Chalo ek example dekhte hain:
Step-by-Step Calculation:
P=(110+100+105)3=3153=105P = \frac{(110 + 100 + 105)}{3} = \frac{315}{3} = 105P=3(110+100+105)=3315=105
S1=(2×10⁵)−110=210−110=100S1 = (2 \times 105) - 110 = 210 - 110 = 100S1=(2×10⁵)−110=210−110=100
R1=(2×10⁵)−100=210−100=110R1 = (2 \times 105) - 100 = 210 - 100 = 110R1=(2×10⁵)−100=210−100=110
S2=105−(110−100)=105−10=95S2 = 105 - (110 - 100) = 105 - 10 = 95S2=105−(110−100)=105−10=95
R2=105+(110−100)=105+10=115R2 = 105 + (110 - 100) = 105 + 10 = 115R2=105+(110−100)=105+10=115
To, yeh hain calculated pivot points aur support/resistance levels:

Practical Usage
Trading mein pivot points ka istemal bohot aasaan hai. Jab price pivot point ke upar ho, toh yeh bullish signal hota hai, aur jab price pivot point ke neeche ho, toh yeh bearish signal hota hai. Support aur resistance levels ko use karte hue, traders price movements ko predict kar sakte hain aur apni trading strategies bana sakte hain.
Pivot points calculate karna trading mein bohot zaroori hai kyun ke yeh ek powerful tool hai jo market trends aur price reversals ko predict karne mein madadgar hota hai. Isse trading mein accuracy aur profitability barh jati hai. Basic formula aur calculation samajhne ke baad, aap asani se pivot points ko apne trading plan mein shamil kar sakte hain.
Introduction
Trading mein pivot points ka istemal support aur resistance levels ko identify karne ke liye hota hai. Yeh points traders ko yeh samajhne mein madad dete hain ke market ke kis level par price reversal ya continuation ho sakta hai. Pivot points ko calculate karne ke bohot tareeqe hain, lekin sab se mashhoor aur aam tareeqa classic pivot point formula hai.
Pivot Point Formula
Classic pivot point formula ko use karne ke liye, humein pichle trading day ka high, low, aur close price ki zaroorat hoti hai. Yeh formula kuch is tarah hota hai:
Pivot Point (P)=(High+Low+Close)3\text{Pivot Point (P)} = \frac{(High + Low + Close)}{3}Pivot Point (P)=3(High+Low+Close)
Yeh central pivot point hota hai, aur isko use karke hum support aur resistance levels calculate karte hain.
Support Aur Resistance Levels
Central pivot point calculate karne ke baad, hum support aur resistance levels calculate kar sakte hain. Inhe hum S1, S2, R1, aur R2 kehte hain:
First Support (S1):
S1=(2×P)−HighS1 = (2 \times \text{P}) - \text{High}S1=(2×P)−High
First Resistance (R1):
R1=(2×P)−LowR1 = (2 \times \text{P}) - \text{Low}R1=(2×P)−Low
Second Support (S2):
S2=P−(High−Low)S2 = \text{P} - (\text{High} - \text{Low})S2=P−(High−Low)
Second Resistance (R2):
R2=P+(High−Low)R2 = \text{P} + (\text{High} - \text{Low})R2=P+(High−Low).
Example Calculation
Chalo ek example dekhte hain:
- High Price: $110
- Low Price: $100
- Close Price: $105
Step-by-Step Calculation:
- Pivot Point (P):
P=(110+100+105)3=3153=105P = \frac{(110 + 100 + 105)}{3} = \frac{315}{3} = 105P=3(110+100+105)=3315=105
- First Support (S1):
S1=(2×10⁵)−110=210−110=100S1 = (2 \times 105) - 110 = 210 - 110 = 100S1=(2×10⁵)−110=210−110=100
- First Resistance (R1):
R1=(2×10⁵)−100=210−100=110R1 = (2 \times 105) - 100 = 210 - 100 = 110R1=(2×10⁵)−100=210−100=110
- Second Support (S2):
S2=105−(110−100)=105−10=95S2 = 105 - (110 - 100) = 105 - 10 = 95S2=105−(110−100)=105−10=95
- Second Resistance (R2):
R2=105+(110−100)=105+10=115R2 = 105 + (110 - 100) = 105 + 10 = 115R2=105+(110−100)=105+10=115
To, yeh hain calculated pivot points aur support/resistance levels:
- Pivot Point (P): 105
- First Support (S1): 100
- First Resistance (R1): 110
- Second Support (S2): 95
- Second Resistance (R2): 115
Practical Usage
Trading mein pivot points ka istemal bohot aasaan hai. Jab price pivot point ke upar ho, toh yeh bullish signal hota hai, aur jab price pivot point ke neeche ho, toh yeh bearish signal hota hai. Support aur resistance levels ko use karte hue, traders price movements ko predict kar sakte hain aur apni trading strategies bana sakte hain.
Pivot points calculate karna trading mein bohot zaroori hai kyun ke yeh ek powerful tool hai jo market trends aur price reversals ko predict karne mein madadgar hota hai. Isse trading mein accuracy aur profitability barh jati hai. Basic formula aur calculation samajhne ke baad, aap asani se pivot points ko apne trading plan mein shamil kar sakte hain.


تبصرہ
Расширенный режим Обычный режим