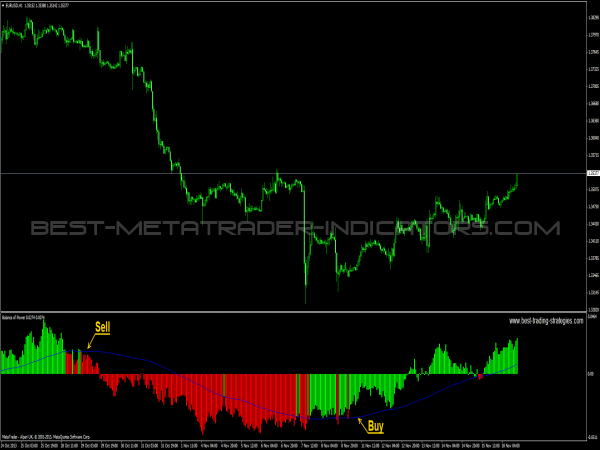
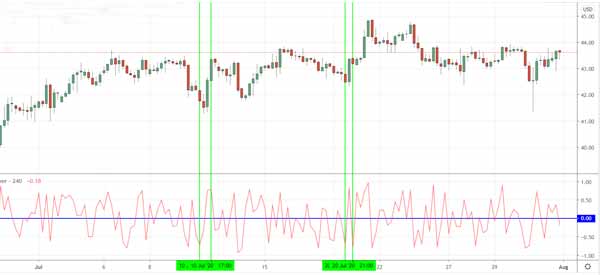
Balance of Power Indicator
No announcement yet.
X
  • وقت
  • دکھائیں
Clear All
new posts
  • #1 Collapse

    Balance of Power Indicator
    Balance of Power Indicator

    Balance of Power (BoP) Indicator aik financial tool hai jo stock market traders aur investors use karte hain taake market trends ko samajh saken. Ye indicator market mein bulls (buyers) aur bears (sellers) ke darmiyan power balance ko measure karta hai. BoP indicator ke zariye, traders ye dekh sakte hain ke market mein kis taraf zyada pressure hai, buying ya selling. Ye indicator price movements ka analysis karke, future price direction ko predict karne mein madadgar hota hai.

    BoP Indicator Ka Matlab

    BoP Indicator ki buniyad yeh hai ke agar ek stock ki closing price uski opening price se zyada hai, to market bulls ke control mein hai. Aur agar closing price opening price se kam hai, to market bears ke control mein hai. Ye indicator stock ka daily price action calculate karta hai aur market ki internal strength ko samajhne mein madad deta hai.

    Calculation of BoP Indicator

    BoP Indicator calculate karne ka tareeqa simple hai. Is mein following formula use hota hai:

    BoP=(Close−Open)−(High−Low)High−Low\text{BoP} = \frac{(\text{Close} - \text{******) - (\text{High} - \text{Low})}{\text{High} - \text{Low}}BoP=High−Low(Close−Open)−(High−Low)​

    Yahaan par:
    • Close: Din ka closing price
    • Open: Din ka opening price
    • High: Din ka highest price
    • Low: Din ka lowest price

    Is formula ka maqsad ye hai ke market participants ke darmiyan buying aur selling pressure ka difference nikalna. Positive BoP value indicate karti hai ke market mein bulls dominate kar rahe hain, jab ke negative value indicate karti hai ke bears dominate kar rahe hain.
    Click image for larger version

Name:	images (10).jpeg
Views:	34
Size:	28.0 کلوبائٹ
ID:	13040441

    BoP Indicator ka Chart Par Istemaal

    BoP Indicator ko chart par plot karke dekhna asaan hota hai. Generally, BoP indicator ko zero line ke around plot kiya jata hai:
    • Positive Values (Above Zero): Bullish signal. Ye indicate karta hai ke market mein buying pressure zyada hai.
    • Negative Values (Below Zero): Bearish signal. Ye indicate karta hai ke market mein selling pressure zyada hai.

    BoP Indicator aur Trading Strategies

    BoP Indicator ko use karke different trading strategies banayi ja sakti hain. Ye indicator standalone use ho sakta hai ya phir doosre indicators ke saath combine karke zyada accurate signals hasil kiye ja sakte hain. Kuch common strategies yeh hain:
    1. Trend Confirmation: Agar BoP indicator positive ho aur price bhi upar ja rahi ho, to ye trend continuation ka signal ho sakta hai. Iska matlab hai ke market mein bulls dominate kar rahe hain aur price aur bhi upar ja sakti hai.
    2. Reversals: BoP indicator ko reversals identify karne ke liye bhi use kiya ja sakta hai. Agar BoP indicator negative ho aur suddenly positive ho jaye, to ye market reversal ka signal ho sakta hai. Iska matlab hai ke market trend shift ho raha hai aur price upar ja sakti hai.
    3. Divergence: BoP indicator aur price ke darmiyan divergence bhi ek strong signal hota hai. Agar price upar ja rahi ho magar BoP indicator neeche ja raha ho, to ye bearish divergence hota hai aur price gir sakti hai. Aur agar price neeche ja rahi ho magar BoP indicator upar ja raha ho, to ye bullish divergence hota hai aur price barh sakti hai.
    Click image for larger version

Name:	images (3).png
Views:	37
Size:	5.6 کلوبائٹ
ID:	13040440

    Advantages aur Limitations of BoP Indicator

    Advantages:
    1. Simple to Calculate: BoP indicator ko calculate karna asaan hai aur ismein complex calculations involve nahi hoti.
    2. Versatile: Ye indicator different time frames aur market conditions mein use ho sakta hai.
    3. Effective in Trend Analysis: BoP indicator trend confirmation aur reversals identify karne mein madadgar hota hai.

    Limitations:
    1. False Signals: Kabhi kabar BoP indicator false signals bhi de sakta hai, especially in volatile markets.
    2. Standalone Reliability: BoP indicator ko standalone use karna risky ho sakta hai, isliye ise doosre indicators ke saath combine karna better hai.

    BoP Indicator ek useful tool hai jo market mein bulls aur bears ke darmiyan power balance ko measure karta hai. Iske zariye traders aur investors market trends ko samajh kar informed decisions le sakte hain. Magar BoP indicator ko doosre technical indicators ke saath combine karke use karna zyada faydemand hai taake zyada accurate signals hasil kiye ja saken.
  • <a href="https://www.instaforex.org/ru/?x=ruforum">InstaForex</a>
  • #2 Collapse


    Balance of Power Indicator (BOP)


    Balance of Power Indicator (BOP) ek technical indicator hai jo buyers aur sellers ke darmiyan power ka balance measure karta hai. Yeh ek trading tool hai jo kisi asset ki price ke direction aur possible reversal points ki nishandahi ke liye use hota hai.

    BOP ki Formation:
    • Agar BOP positive hota hai, toh iska matlab hai ke buyers ki power zyada hai.
    • Agar BOP negative hota hai, toh iska matlab hai ke sellers ki power zyada hai.
    • BOP zero ke qareeb hone ka matlab hota hai ke buyers aur sellers ki power barabar hai.

    Istemaal:
    • BOP ko use karte waqt, traders ko isse doosre technical indicators aur analysis ke saath mila kar istemaal karna chahiye taa ke durust faislay kiye jaa saken.
    • BOP ko mukhtalif time frames par apply kiya ja sakta hai taa ke qaleel muddat aur taweel muddat trends ki nishandahi ki ja sake.

    BOP traders ko market ke sentiments aur possible reversal points ke baare mein insight faraham kar sakta hai, jo ke munafa baksh trading ke liye ahem ho sakti hai.

    Mazeed tafseel


    Balance of Power Indicator (BOP) ek technical indicator hai jo stock market mein buyers aur sellers ke darmiyan power ka balance measure karta hai. Yeh indicator Tushar Chande ne develop kiya tha aur isko use karke traders market ke trend aur momentum ko samajhne ki koshish karte hain.
    BOP ki Calculation:


    BOP ko calculate karne ka formula yeh hai:

    BOP=Close−OpenHigh−LowBOP=High−LowClose−Open​
    • Close: Us period ka closing price.
    • Open: Us period ka opening price.
    • High: Us period ka highest price.
    • Low: Us period ka lowest price.
    BOP ke Components:
    1. Positive BOP: Jab closing price opening price se zyada hota hai, tab BOP positive hota hai. Yeh indicate karta hai ke buyers market mein dominate kar rahe hain.
    2. Negative BOP: Jab closing price opening price se kam hota hai, tab BOP negative hota hai. Yeh indicate karta hai ke sellers market mein dominate kar rahe hain.
    3. Zero BOP: Jab closing price aur opening price equal hoti hain, tab BOP zero hota hai. Yeh indicate karta hai ke buyers aur sellers ka power balance hai.
    BOP ka Interpretation:
    • Positive Values: Agar BOP ki values positive aur increasing hain, toh yeh bullish market ko indicate karta hai jahan buyers ka power zyada hai.
    • Negative Values: Agar BOP ki values negative aur decreasing hain, toh yeh bearish market ko indicate karta hai jahan sellers ka power zyada hai.
    • Crossing Zero Line: Jab BOP zero line cross karta hai, toh yeh potential trend reversal ka indication hota hai.
    BOP ko Use Karne ka Tareeqa:
    1. Trend Identification: BOP ki values ko dekh kar market ka trend identify kiya ja sakta hai. Agar BOP consistently positive hai, toh yeh upward trend ko indicate karta hai. Agar BOP consistently negative hai, toh yeh downward trend ko indicate karta hai.
    2. Reversal Points: BOP ko zero line cross karte hue dekh kar potential reversal points identify kiye ja sakte hain. Agar BOP negative se positive ho jata hai, toh yeh bullish reversal ko indicate karta hai. Agar BOP positive se negative ho jata hai, toh yeh bearish reversal ko indicate karta hai.
    3. Divergence: Agar price aur BOP ki direction alag-alag ho, toh yeh divergence kehlata hai aur yeh bhi potential reversal ka indication hota hai.
    Example:


    Suppose ek stock ka opening price 100, closing price 110, high 115, aur low 95 hai, toh BOP calculate karne ka tareeqa yeh hoga:

    BOP=110−100115−95=1020=0.5BOP=115−95110−100​=2010​ =0.5

    Iska matlab yeh hai ke buyers ka power dominate kar raha hai aur market bullish trend mein hai.
    Conclusion:


    Balance of Power Indicator (BOP) ek valuable tool hai jo traders ko market ke dynamics aur potential reversal points ko samajhne mein madad deta hai. Isko doosre technical indicators ke saath mila kar use karne se traders informed decisions le sakte hain aur trading strategies ko optimize kar sakte hain.


    • #3 Collapse

      Balance of Power (BOP) Indicator kya hai?

      Balance of Power (BOP) ek price-based indicator hai jiska istemal technical analysts market mein buyers aur sellers ki relative strength ko assess karne ke liye karte hain. Ise Igor Livshin ne develop kiya tha aur ise 2001 mein Stocks and Commodities Magazine mein pesh kiya gaya tha.
      Click image for larger version

Name:	images.jpeg
Views:	36
Size:	39.2 کلوبائٹ
ID:	13040471
      BOP indicator ki calculation karne ke liye, pehle close price aur open price ke bich difference ko calculate kiya jata hai. Fir, yeh difference trading volume se divide kiya jata hai. Resultant value zero line ke aas paas oscillate karti hai, positive values bullish sentiment ka aur negative values bearish sentiment ka indication deti hain.


      BOP indicator ka kaise istemal kiya jata hai?

      BOP indicator ka istemal trend shifts aur reversals ki identification karne ke liye kiya ja sakta hai. Jab BOP indicator positive hota hai, to yeh is baat ka indication deta hai ke buyers market mein control kar rahe hain aur price uptrend mein chal raha hai. Jab BOP indicator negative hota hai, to yeh is baat ka indication deta hai ke sellers market mein control kar rahe hain aur price downtrend mein chal raha hai.

      BOP indicator ka istemal support aur resistance levels ki identification karne ke liye bhi kiya ja sakta hai. Jab BOP indicator zero line ko cross karta hai, to yeh ek potential support ya resistance level ka indication ho sakta hai.


      BOP indicator ki kuch limitations hain:
      • BOP indicator choppy markets mein zyada reliable nahi hota hai.
      • BOP indicator late signals generate kar sakta hai.


      BOP indicator ka istemal karne ke kuch tips:
      • BOP indicator ko trend confirmation ke liye use karein, trend reversal ke liye nahi.
      • BOP indicator ko support aur resistance levels ki identification ke liye use karein.
      • BOP indicator ko dusre technical indicators ke saath combine karei.

      Mujhe ummed ha ka ya malomat app ke liey helpfull Rahi Hogi.
       
      • #4 Collapse

        Balance of Power Indicator in Forex Trading

        1. Taaruf

        Forex trading mein, indicators ka istimaal trader ko market trends aur price movements ko samajhne mein madad deta hai. Ek ahem indicator Balance of Power (BOP) hai. Yeh indicator traders ko is baat ka andaza lagane mein madad karta hai ke market mein buying aur selling pressure kis had tak hai. BOP indicator ka istemaal karke, traders apne trading decisions ko aur mazboot aur waazeh bana sakte hain.

        Indicator trading ke har level par istimaal hota hai, chaahe wo beginner trader ho ya ek professional trader. Har kisam ke trader ke liye BOP indicator valuable insights provide kar sakta hai. Is article mein, hum BOP indicator ke mukhtalif pehluon ko discuss karenge aur dekhenge ke yeh kaise forex trading mein madadgar sabit ho sakta hai.

        BOP indicator ke zariye, traders market ki overall health ko evaluate kar sakte hain aur apni trading strategy ko accordingly adjust kar sakte hain. Yeh indicator buying aur selling pressure ke beech ka balance dikhata hai jo ke market ke future movements ke bare mein valuable information provide karta hai.

        2. Balance of Power Indicator Kya Hai?

        Balance of Power Indicator ek technical analysis tool hai jo market ke buying aur selling pressure ko measure karta hai. Yeh indicator price action ko samajhne ke liye istimaal hota hai aur market ke trend direction ka andaza lagane mein madad karta hai. BOP indicator ka basic idea yeh hai ke yeh market ke overall sentiment ko capture karta hai aur traders ko yeh batata hai ke market mein buying ya selling pressure zyada hai.

        BOP indicator trading platforms par asaani se available hai aur iska interface bhi user-friendly hota hai. Iska calculation simple hai, lekin iska impact trading decisions par kaafi significant ho sakta hai. Yeh indicator specially short-term trading ke liye beneficial hai lekin long-term traders bhi isse apni analysis mein shaamil kar sakte hain.

        Indicator ki ek khaas baat yeh hai ke yeh market ke turning points ko identify karne mein madad karta hai. Jab market mein buying pressure zyada hota hai, toh BOP indicator positive value show karta hai, aur jab selling pressure zyada hota hai, toh negative value show karta hai. Yeh simple interpretation traders ko market mein better decision making mein madad deti hai.

        3. BOP Indicator Ka Objective

        BOP indicator ka maqsad market ke bullish aur bearish strength ka pata lagana hai. Yeh indicator price changes aur volume ko analyze karta hai aur is analysis ke zariye market ke sentiment ko measure karta hai. Traders is indicator ka istemaal karke market ke trend direction aur strength ka andaza lagate hain aur apne trades accordingly place karte hain.

        Indicator ka objective yeh bhi hai ke yeh traders ko false signals se bachane mein madad kare. Market mein kai aise moments hote hain jab prices random move karte hain aur yeh moves misleading signals de sakte hain. BOP indicator market ke overall pressure ko accurately measure karke aise false signals ko identify karne mein madad karta hai.

        BOP indicator ka aur ek maqsad yeh hai ke yeh trading ke liye ek additional confirmation tool provide kare. Traders apne core indicators ke saath BOP indicator ko combine karke apne trading decisions ko aur mazboot bana sakte hain. Yeh indicator market ke hidden trends aur patterns ko reveal karne mein bhi madad karta hai jo ke sirf price analysis se identify karna mushkil hota hai.

        4. Indicator Ki Calculation

        BOP indicator ki calculation simple hoti hai. Yeh close price aur open price ke beech ka difference leta hai aur usay volume se divide karta hai. Is tarah se yeh buying aur selling pressure ka accurate measure provide karta hai. Calculation ka formula bhi straightforward hai aur trading platforms is calculation ko automatically perform karte hain.

        Indicator ki calculation ke liye trading platforms par settings ko customize karna bhi possible hai. Traders apni strategy ke mutabiq periods ko adjust kar sakte hain taake woh apne trading style ke mutabiq accurate results hasil kar sakein. Yeh customization options traders ko apni specific needs ke mutabiq indicator ka best use karne mein madad deti hain.

        BOP indicator ki calculation ki simplicity uski strength bhi hai aur weakness bhi. Simplicity ki wajah se beginners bhi isse asaani se samajh sakte hain lekin advanced traders ke liye yeh zaroori hai ke woh isse doosre complex indicators ke saath combine karke use karein taake unko comprehensive analysis hasil ho sake.

        5. BOP Indicator Ka Formula

        Formula: BOP = (Close Price - Open Price) / (High Price - Low Price). Yeh formula asaan hai aur iska istemaal karna bhi simple hai. Trading platforms yeh calculation automatically kar dete hain lekin traders ko is formula ka pata hona chahiye taake woh samajh sakein ke yeh indicator kaise kaam karta hai.

        Formula ke istemaal se traders ko yeh andaza lagta hai ke market mein actual buying aur selling pressure kitna hai. Yeh information unko market ke trend ko samajhne mein madad deti hai. Formula simple hone ke bawajood accurate results provide karta hai jo ke trading decisions ko enhance karta hai.

        Formula ko samajhne ke baad traders apne charts par isko implement kar sakte hain aur uske mutabiq apni trading strategy ko adjust kar sakte hain. Yeh simple calculation technique market ke complex movements ko asaani se analyze karne mein madad deti hai aur traders ko better insights provide karti hai.

        6. Indicator Ki Interpretation

        BOP indicator ko interpret karna aasan hai. Jab BOP value positive hoti hai, yeh bullish trend ko indicate karta hai aur jab negative hoti hai, yeh bearish trend ko indicate karta hai. Positive value ka matlab hai ke market mein buying pressure zyada hai aur negative value selling pressure ko show karti hai.

        Indicator ki interpretation trading decisions ke liye critical hoti hai. Positive aur negative values ke alawa, BOP indicator ki magnitude bhi important hai. Higher positive values ka matlab strong buying pressure hota hai aur higher negative values ka matlab strong selling pressure. Yeh information traders ko market ke sentiment ka accurate andaza lagane mein madad deti hai.

        BOP indicator ke interpretation ko samajhne ke liye historical data ka analysis bhi zaroori hai. Traders ko yeh dekhna chahiye ke past mein jab BOP indicator ne positive ya negative values dikhayi thi toh market ka response kya tha. Is historical analysis se traders ko future trends ka better andaza lagane mein madad milti hai.

        7. Bullish Aur Bearish Signals

        Agar BOP indicator positive value dikhata hai, toh yeh buying pressure ka signal hota hai. Negative value selling pressure ko indicate karti hai. Yeh signals traders ko market mein entry aur exit points identify karne mein madad dete hain. Positive signals ka matlab hai ke yeh ek accha time hai buy karne ka aur negative signals selling ka waqt indicate karte hain.

        Traders ko signals ko confirm karne ke liye additional indicators aur analysis tools ka istemaal karna chahiye. Sirf BOP indicator pe rely karna risky ho sakta hai. Combining BOP with other indicators like Moving Averages aur RSI se trading decisions ko aur bhi accurate banaya ja sakta hai.

        Bullish aur bearish signals ko samajhne ke liye market ke overall trend ko bhi dekhna zaroori hai. Agar market already ek strong trend mein hai toh BOP signals ka impact zyada significant hota hai. Lekin agar market sideways movement mein hai toh BOP signals ka effect kam ho sakta hai.

        8. Indicator Ki Strength

        BOP indicator ki strength is baat pe depend karti hai ke yeh market ki overall trend ke saath kis tarah se react karta hai. Yeh indicator short-term aur long-term trends dono ko analyze kar sakta hai. Indicator ki strength uske ability mein hai ke yeh market ke true sentiment ko accurately measure karta hai.

        BOP indicator ki ek aur strength yeh hai ke yeh market ke turning points ko identify karne mein madad karta hai. Market ke reversals ko pehle se samajh kar traders timely entry aur exit decisions le sakte hain. Yeh indicator market ke hidden trends ko reveal karne mein bhi madad karta hai jo ke price action analysis se identify karna mushkil hota hai.

        Indicator ki strength ko maximize karne ke liye traders ko isse doosre analysis tools ke saath combine karna chahiye. Moving Averages, RSI aur MACD jaise indicators ke saath BOP indicator ka combination trading strategy ko aur mazboot bana sakta hai. Yeh combination comprehensive market analysis provide karta hai jo ke successful trading ke liye zaroori hai.

        9. Indicator Ka Istemaal

        BOP indicator ko trading platform par apply karna aasan hai. TradingView aur MetaTrader jaise platforms pe yeh indicator available hota hai. Platforms par BOP indicator ko apply karne ke liye charts ke settings mein jaakar indicator ko select karna hota hai. Yeh process simple hai aur beginners bhi isse asaani se kar sakte hain.

        Indicator ka istemaal karte waqt, traders ko charts par uski settings ko customize karne ka option bhi hota hai. Periods aur time frames ko adjust karke traders apne analysis ko apni trading strategy ke mutabiq bana sakte hain. Yeh customization options traders ko market ke specific trends aur patterns ko identify karne mein madad deti hain.

        BOP indicator ka istemaal regular basis par karna chahiye. Market ke trends aur sentiment constantly change hote rehte hain, isliye yeh zaroori hai ke traders regularly apne charts ko update karein aur BOP indicator ke signals ko monitor karein. Yeh continuous monitoring trading decisions ko timely aur effective banati hai.

        10. Indicator Ki Settings

        Default settings mein BOP indicator ko 14 periods ke liye calculate kiya jata hai. Traders apni trading strategy ke mutabiq yeh settings adjust kar sakte hain. 14 periods ki setting general use ke liye suitable hai lekin specific trading strategies ke liye isme adjustments karna beneficial ho sakta hai.

        Settings ko adjust karne se traders ko market ke specific trends aur patterns ko accurately identify karne mein madad milti hai. Short-term traders kam periods ke liye settings adjust kar sakte hain taake unko recent market movements ka better andaza lag sake. Long-term traders zyada periods ko select karke market ke overall trend ko dekh sakte hain.

        BOP indicator ki settings ko adjust karte waqt, traders ko backtesting bhi karna chahiye. Historical data par indicator ke performance ko dekh kar traders ko is baat ka andaza lagta hai ke unki customized settings kitni effective hain. Yeh backtesting process trading strategy ko refine karne mein madad deta hai.

        11. Divergence Trading

        BOP indicator divergence trading ke liye bhi use hota hai. Agar price aur BOP indicator opposite directions mein move kar rahe hain, toh yeh trend reversal ka signal ho sakta hai. Divergence trading ek popular technique hai jo traders ko potential trend reversals ko identify karne mein madad deti hai.

        Price aur BOP indicator ke beech ka divergence trading opportunities ko highlight karta hai. Bullish divergence tab hota hai jab price lower lows bana raha hota hai lekin BOP indicator higher lows show kar raha hota hai. Yeh signal potential trend reversal ka indication hota hai. Bearish divergence tab hoti hai jab price higher highs bana raha hota hai lekin BOP indicator lower highs show kar raha hota hai.

        Divergence trading ke liye BOP indicator ko doosre confirmation tools ke saath combine karna zaroori hai. Price action aur volume analysis ke saath BOP indicator ka istemaal karke traders apne trading decisions ko aur accurate bana sakte hain. Yeh combination traders ko better risk management mein bhi madad deta hai.

        12. Combination with Other Indicators

        BOP indicator ko doosre technical indicators, jaise ke Moving Averages aur RSI ke saath combine karna beneficial hota hai. Yeh combination trading decisions ko aur mazboot banata hai. Moving Averages market ke overall trend ko highlight karte hain aur RSI market ke overbought aur oversold conditions ko indicate karta hai.

        BOP indicator ke saath in indicators ko use karke traders ko comprehensive market analysis milti hai. Moving Averages aur RSI ke signals ko BOP indicator ke signals ke saath confirm karke traders apne trades ko accurately place kar sakte hain. Yeh combination false signals se bachne mein madadgar hota hai aur trading decisions ko aur reliable banata hai.

        Indicators ke combination se traders ko market ke complex trends aur patterns ko identify karna asaan hota hai. Yeh combination trading strategy ko diversify karta hai aur different market conditions mein effective trading decisions lene mein madad deta hai. Har trader ko apni specific needs ke mutabiq in indicators ka combination select karna chahiye.

        13. Indicator Ki Limitations

        Har indicator ki tarah, BOP indicator bhi kuch limitations rakhta hai. Yeh indicator false signals de sakta hai aur market noise se bhi affect ho sakta hai. Isliye, traders ko BOP indicator ke signals ko confirm karne ke liye doosre analysis tools ka istemaal karna chahiye.

        BOP indicator ki ek aur limitation yeh hai ke yeh short-term price movements par zyada focus karta hai. Long-term traders ke liye yeh indicator kaafi effective nahi ho sakta. Isliye, long-term traders ko BOP indicator ke saath long-term indicators ko bhi use karna chahiye taake unko comprehensive analysis mil sake.

        Indicator ki limitations ko samajhne ke baad, traders ko apne trading strategy ko accordingly adjust karna chahiye. Har indicator ki tarah, BOP indicator bhi ek tool hai jo traders ko market ko samajhne mein madad deta hai lekin ispe blindly rely karna theek nahi. Accurate trading decisions lene ke liye comprehensive analysis zaroori hai.

        14. Conclusion

        Balance of Power Indicator ek useful tool hai jo traders ko market trends aur price movements ko samajhne mein madad deta hai. Iska sahi istimaal karne ke liye practice aur analysis zaroori hai. Forex trading mein BOP indicator ka istemaal kar ke traders apni trading strategy ko aur effective bana sakte hain. BOP indicator market ke buying aur selling pressure ko accurately measure karke traders ko better trading decisions lene mein madad karta hai. Iska combination doosre indicators ke saath kar ke trading strategy ko diversify karna zaroori hai. Har trader ko BOP indicator ke strengths aur limitations ko samajh kar isse apni trading strategy mein shaamil karna chahiye.
        • #5 Collapse

          Forex Trading Mein Balance of Power Indicator:!:!:!:!

          Forex trading mein, Balance of Power (BoP) ek technical analysis indicator hota hai jo price movement ke piche ke strength aur momentum ko measure karta hai. Yeh indicator, Dr. Igor Livshin ne develop kiya tha, aur yeh mainly trend strength aur potential reversal points ko identify karne ke liye use hota hai.


          Balance of Power indicator ka calculation simple hai:

          BoP=(Close−Open)(High−Low)BoP = \frac{(Close - Open)}{(High - Low)}BoP=(High−Low)(Close−Open)​

          Yeh formula har period ke liye apply hota hai, aur phir ek moving average se smooth kiya jata hai.

          Forex Trading Mein Balance of Power Indicator Ki Interpretation:!:!:!:!
          • Positive BoP: Jab BoP positive hota hai (Close > Open), toh yeh buyers ke control ko indicate karta hai. Iska matlab hai ke market me buying pressure zyada hai.
          • Negative BoP: Jab BoP negative hota hai (Close < Open), toh yeh sellers ke control ko indicate karta hai. Iska matlab hai ke market me selling pressure zyada hai.
          • Zero Line Crossover: Jab BoP zero line cross karta hai, yeh trend reversal ko indicate kar sakta hai. Zero se upar crossover bullish signal hai aur zero se niche crossover bearish signal hai.
          • Divergence: Price aur BoP ke beech divergence bhi ek strong signal hota hai. Agar price higher highs bana raha hai lekin BoP lower highs bana raha hai, toh yeh bearish divergence hai aur potential reversal ka signal hai. Similarly, agar price lower lows bana raha hai lekin BoP higher lows bana raha hai, toh yeh bullish divergence hai.
          Forex Trading Mein Balance of Power Indicator Ka Forex Mein Use:!:!:!:!
          1. Trend Identification: BoP trend strength aur direction ko identify karne me madad karta hai.
          2. Reversal Points: Zero line crossover aur divergence ka use potential reversal points ko identify karne ke liye kiya ja sakta hai.
          3. Confirmation: BoP ko dusre indicators ke sath combine karke trade signals ko confirm karne ke liye use kiya ja sakta hai.
          BoP indicator ka use karke traders market me better informed decisions le sakte hain, lekin yeh zaruri hai ke BoP ko dusre technical tools aur fundamental analysis ke sath combine kiya jaye for a holistic trading strategy.
          • #6 Collapse

            Balance of Power (BOP) Indicator kya hai?

            Balance of Power (BOP) ek price-based indicator hai jiska istemal technical analysts market mein buyers aur sellers ki relative strength ko assess karne ke liye karte hain. Ise Igor Livshin ne develop kiya tha aur 2001 mein Stocks and Commodities Magazine mein pehli baar public kiya gaya tha.

            BOP price movements ko extreme highs aur lows tak push karne wali buyers aur sellers ki strength ko evaluate karke price trends ko measure karta hai. Yah indicator zero line ke aas paas oscillates karta hai, jahan positive values bullish sentiment aur negative values bearish sentiment ka sign hain.


            BOP ki calculation kaise ki jaati hai?

            BOP ki calculation ke liye, do steps hain:
            1. Average price ka calculation karna hai jab selling pressure hota hai aur jab buying pressure hota hai.
              • Selling pressure average price: Close price - average true range (ATR) ke aadhar par calculate kiya jata hai.
              • Buying pressure average price: Close price + ATR ke aadhar par calculate kiya jata hai.
            2. Difference ka calculation karna hai: Buying pressure average price se selling pressure average price ko subtract karen.
            3. Total trading volume se divide karen: Difference ko total trading volume se divide karen.

            Resulting value zero line ke aas paas oscillates karta hai.


            BOP ka interpretation kaise karen?
            • Positive values: Positive values bullish sentiment ka sign hain. Yah batata hai ki buyers market mein control kar rahe hain aur prices ko upar push kar rahe hain.
            • Negative values: Negative values bearish sentiment ka sign hain. Yah batata hai ki sellers market mein control kar rahe hain aur prices ko niche push kar rahe hain.
            • Zero line: Zero line ka matlab hai ki buyers aur sellers ki strength equal hai.


            BOP ka use kaise karen?

            BOP ka use kai tarah se kiya ja sakta hai, jinmein shamil hain:
            • Potential trend shifts aur reversals ki identification karna: BOP ka use potential trend shifts aur reversals ki identification karne ke liye kiya ja sakta hai. Jab BOP zero line ko cross karta hai, to yah ek potential trend shift ka sign ho sakta hai.
            • Trend strength ka assessment karna: BOP ka use trend strength ka assessment karne ke liye kiya ja sakta hai. Strong trends mein, BOP values zero line se dur rahegi. Weak trends mein, BOP values zero line ke kareeb rahegi.
            • Entry aur exit points ki identification karna: BOP ka use entry aur exit points ki identification karne ke liye kiya ja sakta hai. Jab BOP bullish signal deta hai, to yah ek potential entry point ho sakta hai. Jab BOP bearish signal deta hai, to yah ek potential exit point ho sakta hai.


            BOP ki limitations:

            BOP ek lagging indicator hai, jiska matlab hai ki yah price movement ke baad react karta hai. Isliye, yah ek perfect indicator nahi hai aur iska use dusre indicators ke saath conjunction mein karna chahiye.

            BOP noisy bhi ho sakta hai, jiska matlab hai ki yah false signals generate kar sakta hai. Isliye, iska use smoothing indicator ke saath conjunction mein karna chahiye.


            Conclusion:

            BOP ek useful indicator hai jiska use market sentiment aur trend strength ko assess karne ke liye kiya ja sakta hai. Halanki, yah ek perfect indicator nahi hai aur iska use dusre indicators ke saath conjunction mein karna chahiye.


            Note:

            BOP ka use financial advice ke liye nahi kiya jana chahiye. Koi bhi trading decision lene se pehle, apna research karna aur financial advisor se consult karna zaroori hai.


            Aapke sawal ka jawab:

            Kya aap mujhe Balance of Power Indicator ke bare mein details se bata sakte hain?

            Haan, main aapko Balance of Power Indicator ke bare mein details se bata sakta hun. Is response mein, maine BOP ki definition, calculation, interpretation, use aur limitations ko cover kiya hai.


            Kya aap mujhe kuch aur bata sakte hain?

            Haan, main aapko kuch aur bata sakta hun. BOP ke bare mein aapki kya specific queries hain? Mujhe bataiye aur main aapke sawalon ka jawab dene ki puri koshish karunga.


            Disclaimer:

            I am not a financial advisor and this information is not intended to be financial advice. Please do your own research and consult with a financial advisor before making any investment decisions.
            • #7 Collapse

              Forex mein Balance of Power Indicator ka matlab kya hai

              Click image for larger version

Name:	images (95).jpeg
Views:	35
Size:	19.8 کلوبائٹ
ID:	13040556

              Balance of Power Indicator forex trading mein ek technical analysis tool hai jo traders ko market sentiment aur trend ka pata lagane mein madad karta hai. Ye indicator market mein bulls aur bears ke power ke beech ka balance darshata hai.is me apka blnce boht value rkhta h.

              Power indicator

              Is indicator ke use se traders ko ye pata chalta hai ki kis taraf market ja raha hai aur kya trend hai. Agar BoP indicator bullish hai to market mein buyers ki power zyada hai aur agar bearish hai to sellers ki power zyada hai.ye b market k indicator k mutabiq chlta h.

              Balance of Power Indicator ka formula ye hai:

              BoP = (Close price – Open price) / (High price – Low price)

              Click image for larger version

Name:	images (94).jpeg
Views:	29
Size:	7.3 کلوبائٹ
ID:	13040557

              Is formula se indicator ka value -1 aur 1 ke beech mein aata hai. Agar BoP 0 ke paas hai to ye sideways market ko indicate karta hai. Agar BoP negative hai to ye bearish market ko indicate karta hai aur agar positive hai to ye bullish market ko indicate karta hai.ye formula apko indication dta rehta h k Kia cheeze up down ho rhi h. Jtna apka blnce zda hoga utna ap acha kam kr k acha profit ly skty hen.

              Click image for larger version

Name:	images (37).png
Views:	28
Size:	9.5 کلوبائٹ
ID:	13040558

              Conclusion

              Is indicator ke use se traders ko entry aur exit points ka pata lagta hai aur unko trading decisions lene mein madad milti hai. Ye indicator market sentiment aur trend ka pata lagane mein madad karta hai aur traders ko profitable trading opportunities deta hai.

              • #8 Collapse

                ​​​​​Shark Harmonic Pattern

                The Shark Harmonic Pattern is a relatively new and advanced trading pattern used in the financial markets. It is part of the Harmonic Trading methodology and helps traders identify potential reversal zones in the price action of assets. This pattern relies on specific Fibonacci ratios and precise measurements of price swings to predict future price movements.

                Introduction to Harmonic Patterns

                Harmonic patterns are a set of geometric price patterns that utilize Fibonacci sequences to identify potential reversal points in the market. These patterns are used to predict future price movements with a high degree of accuracy. The Shark pattern, in particular, is a powerful tool for traders who seek to capitalize on trend reversals.

                Shark Pattern ki Pehchaan (Identifying the Shark Pattern)

                Shark pattern ko pehchanay ke liye kuch khas points hain jo traders ko dekhne hote hain:
                1. X to A Leg: Pehla point hota hai X se A ka leg. Ye leg ek impulsive move hota hai.
                2. A to B Leg: Phir price A se B tak move karta hai, jo ek correction phase hoti hai.
                3. B to C Leg: C leg ka formation B point se shuru hota hai aur X-A leg ka 113% to 161.8% retracement hota hai.
                4. C to D Leg: D leg ko hum final leg kehte hain jo C point se move karta hai aur 88.6% retracement hota hai.

                Fibonacci Ratios

                Shark pattern mein specific Fibonacci ratios use hoti hain:
                • 0.886 Retracement: Yeh point C ke baad hota hai jo B leg ka retracement hota hai.
                • 1.13 and 1.618 Extensions: Yeh levels X-A leg ke extension points hain jo D point banate hain.

                Pattern ki Construction (Construction of the Pattern)

                Pattern ki construction kuch is tarah hoti hai:
                1. X-A Move: Strong impulse move hota hai jo pattern ka pehla leg hota hai.
                2. A-B Move: Correction phase hoti hai jo X-A leg ka part hoti hai.
                3. B-C Move: B se C tak ka move X-A leg ka 113% to 161.8% retracement hota hai.
                4. C-D Move: C se D tak ka move B leg ka 88.6% retracement hota hai jo final point hota hai.

                Trading Strategy

                Shark pattern ko trade karne ke liye kuch basic strategies hain:
                1. Entry Point: D point pe entry karni hoti hai jo final point hota hai pattern ka.
                2. Stop Loss: Stop loss point D se thoda upar ya neeche rakhte hain depending on buy ya sell signal.
                3. Take Profit: Pehla target point X-A leg ka 50% retracement hota hai aur doosra target 100% retracement hota hai.

                Example

                Agar hum ek practical example dekhein, to let's say ek stock ka price X se A tak impulsive move karta hai. Phir price A se B tak correction phase mein aata hai. B se C tak price X-A leg ka 113% retracement hota hai. Aur phir C se D tak price B leg ka 88.6% retracement hota hai. Jab price D point pe aata hai to trader yahan buy ya sell position open kar sakta hai with proper stop loss and take profit levels.
                • #9 Collapse


                  Balance of Power Indicator
                  Click image for larger version

Name:	download (2).png
Views:	32
Size:	7.8 کلوبائٹ
ID:	13040899

                  Balance of Power (BoP) Indicator aik financial tool hai jo stock market traders aur investors use karte hain taake market trends ko samajh saken. Ye indicator market mein bulls (buyers) aur bears (sellers) ke darmiyan power balance ko measure karta hai. BoP indicator ke zariye, traders ye dekh sakte hain ke market mein kis taraf zyada pressure hai, buying ya selling. Ye indicator price movements ka analysis karke, future price direction ko predict karne mein madadgar hota hai.

                  BoP Indicator Ka Matlab

                  BoP Indicator ki buniyad yeh hai ke agar ek stock ki closing price uski opening price se zyada hai, to market bulls ke control mein hai. Aur agar closing price opening price se kam hai, to market bears ke control mein hai. Ye indicator stock ka daily price action calculate karta hai aur market ki internal strength ko samajhne mein madad deta hai.

                  Conclusion

                  BOP ek useful indicator hai jiska use market sentiment aur trend strength ko assess karne ke liye kiya ja sakta hai. Halanki, yah ek perfect indicator nahi hai aur iska use dusre indicators ke saath conjunction mein karna chahiye.BOP ka use financial advice ke liye nahi kiya jana chahiye. Koi bhi trading decision lene se pehle, apna research karna aur financial advisor se consult karna zaroori hai.


                  Kya aap mujhe Balance of Power Indicator ke bare mein details se bata sakte hain

                  Haan, main aapko Balance of Power Indicator ke bare mein details se bata sakta hun. Is response mein, maine BOP ki definition, calculation, interpretation, use aur limitations ko cover kiya hai.


                  Kya aap mujhe kuch aur bata sakte hain

                  Haan, main aapko kuch aur bata sakta hun. BOP ke bare mein aapki kya specific queries hain? Mujhe bataiye aur main aapke sawalon ka jawab dene ki puri koshish karunga.

                  • #10 Collapse

                    Balance of Power (BOP) indicator aik technical analysis tool hai jo market ke buying aur selling pressure ko measure karne ke liye use hota hai. Yeh indicator traders ko market ke overall strength aur trend ko understand karne mein madad karta hai. Ab hum detail mein dekhte hain ke Balance of Power indicator kya hai aur yeh kaise kaam karta hai:

                    Balance of Power Indicator Kya Hai?

                    Balance of Power indicator ko Igor Livshin ne develop kiya tha. Yeh indicator price movements aur volume ke beech ke relationship ko measure karta hai. BOP indicator price action ke strength aur weakness ko identify karne ke liye use hota hai.

                    Balance of Power Indicator Ka Calculation

                    Balance of Power indicator ka basic formula kuch is tarah hota hai:

                    \[ BOP = \frac{(Close - Open)}{(High - Low)} \]

                    Is formula ko calculate karne ke liye, aapko current period ke closing, opening, high, aur low prices ki zaroorat hoti hai.

                    Balance of Power Indicator Ka Use

                    Balance of Power indicator ko traders different purposes ke liye use karte hain:

                    1. Trend Identification:

                    BOP indicator se traders market trends ko identify kar sakte hain. Positive BOP value strong buying pressure ko indicate karti hai, jab ke negative BOP value strong selling pressure ko indicate karti hai.

                    2. Trend Reversals:

                    BOP indicator trend reversals ko identify karne mein madadgar hota hai. Jab BOP value zero ke aas-paas hover karti hai, to yeh market indecision ko signal karta hai.

                    3. Divergence Analysis:

                    BOP indicator aur price ke beech divergence potential trend reversal ko indicate kar sakti hai. Agar price higher high bana rahi ho aur BOP lower high bana raha ho, to yeh bearish divergence hai, aur agar price lower low bana rahi ho aur BOP higher low bana raha ho, to yeh bullish divergence hai.

                    Balance of Power Indicator Ki Significance

                    Balance of Power indicator ke kuch important aspects hain jo isko valuable banate hain:

                    1. Simplicity:

                    Iska calculation aur interpretation simple hai, jo beginners ke liye isko use karna asaan banata hai.

                    2. Versatility:

                    BOP indicator different time frames aur market conditions mein effective hota hai.

                    3. Trend Strength:

                    Yeh indicator buying aur selling pressure ko accurately measure karta hai, jo trading decisions ko enhance karta hai.

                    Balance of Power Indicator Ka Limitation

                    1. Lagging Nature:

                    BOP indicator historical price data par based hota hai, isliye yeh lag kar sakta hai aur timely signals miss ho sakte hain.

                    2. False Signals:

                    High volatility periods mein BOP indicator false signals generate kar sakta hai, jo misleading ho sakte hain.

                    Example

                    Agar ek Balance of Power indicator ka example dekha jaye:


                    - Jab BOP value positive ho aur continuously increase kar rahi ho, to yeh strong bullish trend ko indicate karta hai.
                    - Jab BOP value negative ho aur continuously decrease kar rahi ho, to yeh strong bearish trend ko indicate karta hai.

                    Conclusion

                    Balance of Power indicator aik powerful tool hai jo forex traders ko market ke buying aur selling pressure ko analyze karne mein madadgar hota hai. Yeh indicator trading signals provide karta hai jo market movements ko better understand karne mein madad karte hain. Lekin, isko doosre technical indicators ke saath combine karke use karna chahiye taake accurate trading decisions liye ja sakein.

                    • #11 Collapse

                      Forex Trading mein Balance of Power Indicator


                      Balance of Power (BOP) indicator ek price-based indicator hai jiska istemal technical analysts market mein buyers aur sellers ki overall strength ko evaluate karne ke liye karte hain. Yah zero line ke aas paas oscillate karta hai, jahan positive values bull market dominance aur negative values bear market dominance ko indicate karte hain.


                      BOP ki calculation kaise ki jaati hai:

                      Balance of Power ki calculation is formula se ki jaati hai:

                      Balance of Power = (Close price – Open price) / (High price – Low price)
                      Yeh formula har candle ke liye calculate kiya jaata hai aur indicator chart par plot kiya jaata hai.


                      BOP ko kaise interpret kiya jaaye:

                      BOP indicator bullish aur bearish signals generate karta hai jo ki zero line ke relative position par based hote hain. Jab indicator zero line ke upar move karta hai to buyers market ko control karte hain aur price ke badhane ki sambhavna hoti hai. Conversely, jab indicator zero line ke niche move karta hai to sellers market ko dominate karte hain aur price ke girne ki sambhavna hoti hai.


                      BOP indicator ka istemal karne ke kuch tips:
                      • Zero-line crossovers: Jab BOP indicator zero line ko cross karta hai to yah ek potential trend reversal signal ho sakta hai. Agar indicator upar ki taraf break karta hai to yah ek bullish signal hai aur agar indicator niche ki taraf break karta hai to yah ek bearish signal hai.
                      • Divergence: Jab BOP indicator price chart se diverge karta hai to yah ek potential trend reversal signal ho sakta hai. Agar price upar ja raha hai lekin BOP indicator niche ja raha hai to yah ek bearish divergence hai aur yah ek potential sell signal ho sakta hai. Conversely, agar price niche ja raha hai lekin BOP indicator upar ja raha hai to yah ek bullish divergence hai aur yah ek potential buy signal ho sakta hai.
                      • Overbought aur oversold levels: Traders BOP indicator ka istemal overbought aur oversold conditions ko identify karne ke liye bhi kar sakte hain. Agar indicator kafi upar ja raha hai to yah ek signal ho sakta hai ki market overbought hai aur price mein correction aa sakta hai. Conversely, agar indicator kafi niche ja raha hai to yah ek signal ho sakta hai ki market oversold hai aur price mein rebound aa sakta hai.
                      Yeh dhyan rakhna zaruri hai ki BOP indicator ek stand-alone tool nahin hai aur ise dusre technical indicators ke saath use karna chahiye.


                      Forex trading mein BOP indicator ka istemal karne ke kuch examples:
                      • Trend confirmation: Agar price ek uptrend mein hai aur BOP indicator bhi upar ki taraf move kar raha hai to yah trend ki strength ko confirm karta hai aur aap trend ki direction mein trade karne per consider kar sakte hain.
                      • Trend reversal: Agar price ek uptrend mein hai lekin BOP indicator niche ki taraf move kar raha hai to yah ek potential trend reversal signal ho sakta hai aur aap trend ke against trade karne per consider kar sakte hain.
                      • Overbought aur oversold trading: Agar indicator kafi upar ja raha hai to aap sell trade karne per consider kar sakte hain aur agar indicator kafi niche ja raha hai to aap buy trade karne per consider kar sakte hain.
                       
                      • #12 Collapse

                        **Balance of Power Indicator: Forex Trading Mein Ahmiyat Aur Istemaal**
                        Forex trading mein technical indicators bohot important hotay hain kyunke yeh market ke trend aur price movements ko samajhne mein madad karte hain. Ek aisa hi unique aur effective indicator Balance of Power (BOP) hai. Yeh indicator market ke buying aur selling pressure ko measure karta hai aur traders ko trend direction aur potential reversals identify karne mein help karta hai. Is post mein hum Balance of Power indicator ke components, iski ahmiyat aur isko use karne ke tareeqe ko detail mein discuss karenge.

                        ### Balance of Power Indicator Kya Hai?

                        Balance of Power (BOP) indicator ek momentum oscillator hai jo market ke buying aur selling pressure ko measure karta hai. Yeh indicator Igor Livshin ne develop kiya tha aur iska primary purpose market ke power shifts ko identify karna hai. BOP indicator traders ko market ke underlying strength aur potential trend changes ke signals provide karta hai.

                        ### Components of Balance of Power Indicator

                        1. **Calculation:**
                        - **Formula:** BOP = (Close - Open) / (High - Low)
                        - **Values:** Yeh indicator -1 se +1 ke range mein values generate karta hai. Positive values buying pressure ko indicate karti hain aur negative values selling pressure ko show karti hain.

                        2. **Smoothed BOP:**
                        - **Moving Average:** Smoothed BOP ko calculate karne ke liye BOP values ka moving average use kiya jata hai, jo indicator ko smooth aur less volatile banata hai.

                        ### Ahmiyat of Balance of Power Indicator

                        1. **Trend Identification:** BOP indicator market ke buying aur selling pressure ko measure karke trend direction ko identify karne mein madad karta hai.
                        2. **Potential Reversals:** Yeh indicator potential trend reversals ko signal karta hai jab buying aur selling pressure mein significant changes hoti hain.
                        3. **Divergence:** BOP indicator ko price movements ke sath compare karke bullish aur bearish divergences identify ki ja sakti hain, jo potential trend reversals ke signals hotay hain.

                        ### Strategies for Using Balance of Power Indicator

                        #### 1. **Trend Confirmation**

                        - **Positive BOP:** Jab BOP positive values show karta hai, toh yeh strong buying pressure aur bullish trend ko indicate karta hai.
                        - **Negative BOP:** Jab BOP negative values show karta hai, toh yeh strong selling pressure aur bearish trend ko indicate karta hai.

                        #### 2. **Divergence Analysis**

                        - **Bullish Divergence:** Jab price lower lows banati hai aur BOP higher lows banata hai, toh yeh bullish divergence hoti hai, jo potential bullish reversal ko indicate karti hai.
                        - **Bearish Divergence:** Jab price higher highs banati hai aur BOP lower highs banata hai, toh yeh bearish divergence hoti hai, jo potential bearish reversal ko indicate karti hai.

                        #### 3. **Entry and Exit Points**

                        - **Buy Entry:** Jab BOP positive values show karta hai aur upward trend confirm hota hai, toh buy entry karein.
                        - **Sell Entry:** Jab BOP negative values show karta hai aur downward trend confirm hota hai, toh sell entry karein.
                        - **Stop-Loss:** Proper stop-loss levels set karein based on recent swing highs ya swing lows taake risk ko manage kiya ja sake.
                        - **Profit Targets:** Profit targets ko predefined risk-reward ratio ya key support/resistance levels ke basis par set karein.

                        ### Implementation Tips

                        1. **Chart Analysis:** Regularly price charts ka analysis karein aur BOP indicator ki movements ko monitor karein.
                        2. **Combine with Other Indicators:** BOP indicator ko other technical indicators jaise moving averages, RSI (Relative Strength Index), aur MACD (Moving Average Convergence Divergence) ke sath use karein taake better confirmation mil sake.
                        3. **Risk Management:** Proper risk management techniques use karein taake losses ko minimize kiya ja sake.

                        ### Example of Trading with Balance of Power Indicator

                        #### Step-by-Step Process

                        1. **Identify Trend:** 50-day aur 200-day moving averages ko use karke current trend identify karein.
                        2. **Monitor BOP Values:** BOP indicator ki values ko monitor karein. Positive BOP values buying pressure ko indicate karti hain aur negative BOP values selling pressure ko show karti hain.
                        3. **Enter Trade:** Trend confirmation aur BOP values ke basis par buy ya sell entry karein.
                        4. **Set Stop-Loss:** Recent swing highs ya swing lows ke basis par stop-loss set karein.
                        5. **Set Profit Target:** Predefined risk-reward ratio ya key support/resistance levels ke basis par profit target set karein.

                        ### Conclusion

                        Balance of Power (BOP) indicator ek valuable tool hai jo forex trading mein market ke buying aur selling pressure ko measure karne aur trend direction ko identify karne mein madad karta hai. Is indicator ko sahi tarah se samajhna aur use karna trading decisions ko improve kar sakta hai. Forex trading mein success ke liye yeh zaroori hai ke indicators ko sahi tarah se identify kiya jaye aur unka effective istemaal kiya jaye. BOP indicator trading strategies aur risk management techniques ko enhance karne ke liye ek reliable aur effective tool hai.
                         
                        • #13 Collapse

                          Forex Trading mein Balance of Power Indicator:

                          Balance of Power (BOP) indicator ek technical analysis tool hai jo Forex trading mein market ki taqat ko measure karta hai. Ye indicator buying aur selling pressure ko compare karta hai aur traders ko trading decisions lene mein madad karta hai.

                          BOP indicator ka istemal karne ke kuch tips:
                          • Zero-line crossovers: Jab BOP indicator zero line ko cross karta hai to yah ek potential trend reversal signal ho sakta hai. Agar indicator upar ki taraf break karta hai to yah ek bullish signal hai aur agar indicator niche ki taraf break karta hai to yah ek bearish signal hai.
                          • Divergence: Jab BOP indicator price chart se diverge karta hai to yah ek potential trend reversal signal ho sakta hai. Agar price upar ja raha hai lekin BOP indicator niche ja raha hai to yah ek bearish divergence hai aur yah ek potential sell signal ho sakta hai. Conversely, agar price niche ja raha hai lekin BOP indicator upar ja raha hai to yah ek bullish divergence hai aur yah ek potential buy signal ho sakta hai.
                          • Overbought aur oversold levels: Traders BOP indicator ka istemal overbought aur oversold conditions ko identify karne ke liye bhi kar sakte hain. Agar indicator kafi upar ja raha hai to yah ek signal ho sakta hai ki market overbought hai aur price mein correction aa sakta hai. Conversely, agar indicator kafi niche ja raha hai to yah ek signal ho sakta hai ki market oversold hai aur price mein rebound aa sakta hai.

                          BOP Indicator ki calculation:

                          BOP = (Close - Open) / (High - Low)

                          Is formula mein:

                          - Close: Current candle ki closing price
                          - Open: Current candle ki opening price
                          - High: Current candle ki highest price
                          - Low: Current candle ki lowest price

                          BOP Indicator ki values:

                          - Positive values: Buying pressure ki dominance
                          - Negative values: Selling pressure ki dominance
                          - Zero: Balance between buying and selling pressure

                          Trading Strategies:

                          - Buy signal: BOP indicator ki value positive hone par
                          - Sell signal: BOP indicator ki value negative hone par
                          - Stop loss: BOP indicator ki value zero ke paas hone par
                          - Take profit: Key resistance or support levels par ya risk-reward ratio 1:2 ya usse adhik par

                          BOP Indicator ki advantages:

                          - Market ki taqat ko measure karta hai
                          - Buying aur selling pressure ko compare karta hai
                          - Traders ko trading decisions lene mein madad karta hai

                          BOP Indicator ki limitations:

                          - Lagging indicator hai, isliye price movements ke baad react karta hai
                          - Other technical analysis tools ke saath combine karna chahiye
                          - Proper risk management ka dhyaan rakhna chahiye

                          Conclusions:

                          Balance of Power indicator Forex trading mein ek powerful tool hai jo traders ko market ki taqat ko samajhne mein madad karta hai. Iske saath hi, traders ko is indicator ko other technical analysis tools ke saath combine karna chahiye aur proper risk management ka dhyaan rakhna chahiye.
                          • #14 Collapse

                            Balance of Power indicator aik technical analysis tool hai jo financial markets, especially forex trading aur stocks mein price trends aur potential reversals ko identify karne ke liye use hota hai. Is indicator ka basic idea yeh hai ke yeh market ke buyers aur sellers ke darmiyan power struggle ko measure karta hai. Yeh indicator traders ko market sentiment aur potential trend reversals ke bare mein valuable information provide karta hai.


                            Balance of Power Indicator


                            Balance of Power indicator ko Igor Livshin ne develop kiya tha aur yeh indicator price movements ke piche ke dynamics ko samajhne mein madadgar hota hai. Yeh indicator ek oscillator ki tarah kaam karta hai aur -1 se le kar +1 tak ke range mein move karta hai. Iska main purpose yeh hai ke market mein buyers aur sellers ke darmiyan power ka balance measure kiya jaye. Jab BOP indicator positive values show karta hai, to iska matlab hota hai ke buyers market mein dominant hain. Aur jab yeh negative values show karta hai, to iska matlab hota hai ke sellers dominant hain.


                            BOP Indicator ka Interpretation


                            BOP indicator ko interpret karte waqt, kuch important points ko dhyan mein rakhna zaroori hai. Is indicator ka zero line bohot important hota hai. Zero line cross hona indicate karta hai ke power shift ho rahi hai buyers se sellers ki taraf ya vice versa.
                            1. Positive BOP : Jab BOP indicator positive hota hai, iska matlab hota hai ke buyers market mein zyada dominant hain. Yeh situation usually market mein bullish sentiment ko indicate karti hai aur price upward trend mein ho sakti hai.
                            2. Negative BOP : Jab BOP indicator negative hota hai, iska matlab hota hai ke sellers market mein zyada dominant hain. Yeh bearish sentiment ko indicate karta hai aur price downward trend mein ho sakti hai.
                            3. Zero Line Crossover: Jab BOP indicator zero line ko cross karta hai, to yeh market mein potential trend reversal ka indication ho sakta hai. Agar BOP negative se positive hota hai, to yeh bullish reversal ka signal hai. Aur agar positive se negative hota hai, to yeh bearish reversal ka signal hai.
                            Trading Strategies


                            Balance of Power indicator ko alag-alag trading strategies mein use kiya ja sakta hai. Yeh indicator price trends ko identify karne aur potential entry aur exit points ko determine karne mein madadgar hota hai. Kuch common strategies jisme BOP indicator use hota hai, unmein trend following aur contrarian trading strategies shamil hain.
                            1. Trend Following Strategy: Is strategy mein, traders BOP indicator ke signals ko follow karte hain. Agar BOP positive hai aur continuously upward move kar raha hai, to yeh trend continuation ka indication ho sakta hai. Is situation mein, traders buy positions open kar sakte hain. Aur agar BOP negative hai aur downward move kar raha hai, to yeh sell positions ke liye signal ho sakta hai.
                            2. Contrarian Strategy: Yeh strategy un traders ke liye hoti hai jo market ke against trade karna pasand karte hain. Jab BOP indicator extreme levels ko touch karta hai, jaise ke -1 ya +1, to yeh indicate kar sakta hai ke market overbought ya oversold hai. Is situation mein, traders opposite direction mein trade kar sakte hain, anticipating ke market soon reverse karega.
                            Risk Management


                            Forex trading aur kisi bhi financial market mein trading karte waqt risk management bohot zaroori hota hai. BOP indicator ka signal hamesha accurate nahi hota, isliye risk ko minimize karne ke liye proper risk management techniques ko follow karna chahiye. Ismein stop-loss orders ka use aur position sizing ko manage karna shamil hai.

                            BOP indicator ko use karte waqt kuch cautions ko bhi madde nazar rakhna chahiye. Yeh indicator kisi bhi market condition mein khud se kaafi nahi hota. Isliye, isko dusre technical indicators jaise ke moving averages, RSI , aur volume indicators ke sath combine karke use karna chahiye. Yeh additional indicators aapko stronger confirmation signals denge aur aapke trading decisions ko support karenge.


                            Balance of Power indicator ek valuable technical analysis tool hai jo forex trading aur dusre financial markets mein buyers aur sellers ke power balance ko measure karta hai. Yeh indicator market sentiment aur potential trend reversals ko identify karne mein madadgar hota hai. BOP ka positive value hona buyers ki dominance ko aur negative value hona sellers ki dominance ko indicate karta hai. Is indicator ko use karte waqt, confirmation signals aur risk management strategies ko follow karna zaroori hai.

                            BOP indicator ka sahi istemal aapko market ke dynamics ko behtar samajhne mein madad de sakta hai aur aapko profitable trading opportunities identify karne mein help kar sakta hai. Lekin, hamesha yaad rakhein ke koi bhi indicator perfect nahi hota aur market mein unpredictable factors bhi hote hain, isliye responsible aur well-informed trading decisions lena hamesha zaroori hai.
                            Last edited by ; 30-07-2024, 11:35 AM.
                            • <a href="https://www.instaforex.org/ru/?x=ruforum">InstaForex</a>
                            • #15 Collapse

                              Balance of power indicator

                              Balance of power indicator (BOP) ek technical indicator hai jo financial markets mein price trends aur potential reversal points ko identify karne ke liye use hota hai. Ye indicator traders ko market ka sentiment aur momentum samajhne mein madad karta hai. BOP indicator ka concept financial market mein balance of power ko measure karna hai, jo ki buyers aur sellers ke beech competition ko represent karta hai.

                              BOP ka calculation closing price aur opening price ke beech ka difference le kar kiya jata hai, jise trading volume se divide kiya jata hai. BOP ka positive value ka matlab hai ke buyers dominate kar rahe hain aur price upar jaane ke chances hain, jab ke negative value indicate karti hai ke sellers dominate kar rahe hain aur price niche gir sakta hai.

                              Is indicator ko trading charts mein line ya histogram ke form mein dikhaya jata hai. Agar BOP ka value zero ke kareeb hai to iska matlab hai ke buyers aur sellers mein balance hai aur market mein koi strong trend nahi hai. Lekin agar BOP positive ya negative extreme values show kare to ye strong buying ya selling pressure ka signal hota hai, jo ke market reversal ya continuation ka indicator ho sakta hai.

                              Balance of power indicator ko use karte waqt, traders ko doosre technical indicators aur price action ko bhi consider karna chahiye taake false signals se bacha ja sake. BOP indicator ko moving averages ke saath combine karke bhi use kiya jata hai, jisse trend direction aur entry/exit points identify karna aasaan ho jata hai.

                              Ek common strategy jo BOP indicator ke sath use hoti hai wo hai divergence trading. Agar price chart aur BOP indicator mein divergence nazar aaye, jaise ke price new highs bana raha ho lekin BOP lower highs show kar raha ho, to ye potential trend reversal ka signal ho sakta hai. Isi tarah, agar price new lows bana raha ho aur BOP higher lows show kar raha ho to ye bullish reversal ka signal ho sakta hai.

                              BOP indicator ka ek aur important use overbought aur oversold conditions ko identify karna hai. Agar BOP extreme positive values par hai to market overbought ho sakta hai aur correction expected ho sakti hai. Isi tarah, agar BOP extreme negative values par hai to market oversold ho sakta hai aur buying opportunity ho sakti hai.

                              Balance of power indicator beginners aur experienced traders dono ke liye ek valuable tool hai. Ye market sentiment ko quantify karke trading decisions ko enhance karne mein madad karta hai. Lekin, jaise ke kisi bhi technical indicator ke sath hota hai, BOP ko bhi independently nahi balki doosre analysis tools ke sath combine karke use karna chahiye taake best results mil sakein.

                              اب آن لائن

                              Working...
                              X