Renko chart forex trading mein ek common technical analysis tool hai jo price movement ko visualize karne aur traders ko trend identification aur entry/exit signals provide karne mein madad karta hai. Renko charts ke naam ka matlab hai "renga kagi" jo Japanese words hain aur ek particular type ka chart represent karte hain.
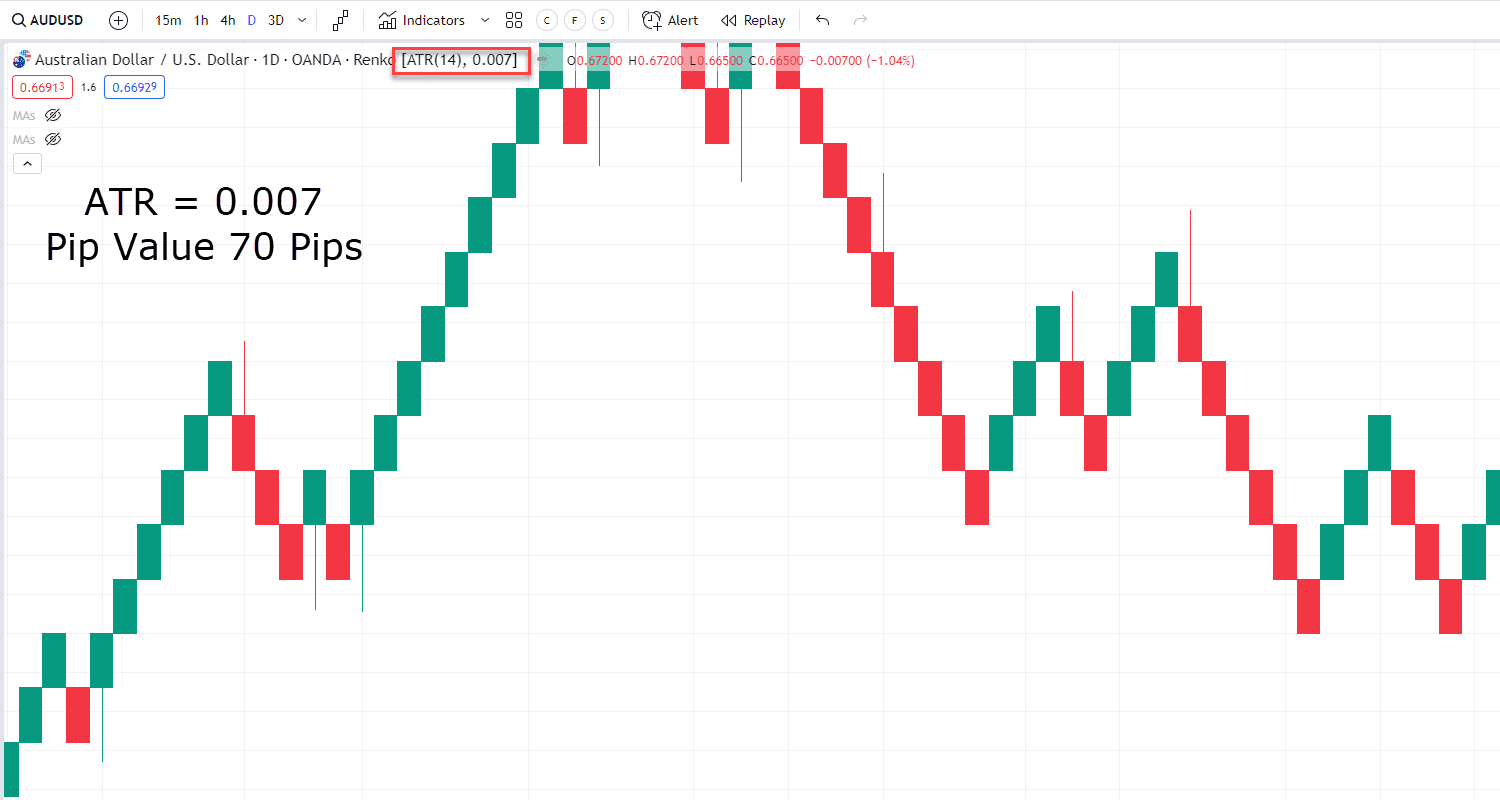
Renko charts traditional candlestick charts se thoda alag hote hain. Traditional charts mein price ke changes ke hisab se bars ya candles draw kiye jate hain, jabki Renko charts mein bars ya candles sirf price ke significant movements par focus karte hain. Renko charts mein har block ya 'brick' ek fixed price movement ko represent karta hai, jise 'brick size' kehte hain.
Renko charts ka istemal karke traders prices ke minor fluctuations ko ignore karke sirf major price movements par dhyan dete hain. Isse unhe clearer trend signals milte hain. Renko charts mein har brick ke size maine par depend karta hai, jisse traders apne trading style aur preferences ke hisab se set kar sakte hain.
Forex trading mein Renko charts ka istemal karne ke kuch fawaid aur nuksan hain:
Fayday:
1. Clear Trend Signals: Renko charts traders ko clear trend signals provide karte hain, jisse unhe market trends aur price movements samajhne mein madad milti hai.
2. Entry/Exit Points: Renko charts ke istemal se traders ko entry aur exit points identify karne mein madad milti hai, jisse unhe profitable trades karne mein asani hoti hai.
3. Price Action Analysis: Renko charts price action analysis ke liye bhi bahut upyogi hote hain, jisse traders market volatility aur price movements ko samajhne mein safalta pate hain.
Nuksan:
1. Lagging Indicators: Renko charts ke use se lagging indicators ki adhikta hoti hai, jisse traders ko pichhe rehne ka khatra hota hai.
2. Whipsaws: Renko charts mein price movements ke sudden changes se traders ko nuksan ho sakta hai, agar woh yeh sahi tarike se manage nahi karte.
3. Brick Size ka Selection: Renko charts mein brick size ka sahi selection karna important hai, agar yeh size galat ho toh traders ko false signals mil sakte hain.
In conclusion, Renko charts ek powerful tool hai forex trading mein, jo traders ko price movements ko samajhne mein madad karta hai. Iska istemal karne se traders ko behtar trading decisions lene mein madad milti hai. Yeh ek versatile charting method hai jo har type ke traders ke liye faydemand ho sakta hai, agar sahi tarike se istemal kiya jaye.
تبصرہ
Расширенный режим Обычный режим