Spining Bottom candlestick Pattern
X
  • وقت
  • دکھائیں
Clear All
new posts
  • #1 Collapse

    Spining Bottom candlestick Pattern
    Spining Bottom Candlestick Kya Hai?


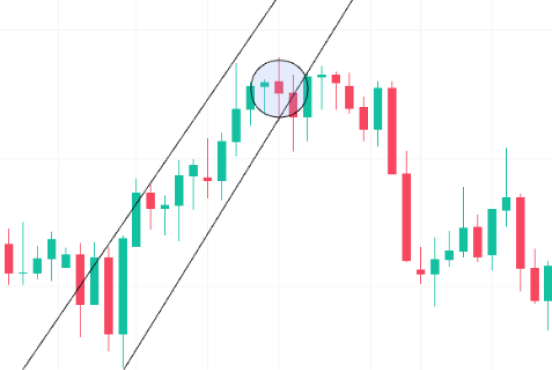
    Spining Bottom candlestick pattern ek neutral candlestick pattern hai jo indecision ka signal deta hai. Yah ek doji pattern ke saman hai, lekin iski body thodi badi hoti hai aur upper aur lower shadows bhi lambi hoti hain.

    Spining Bottom pattern ko banane wali candlestick ki body ka rang bullish ya bearish ho sakta hai.

    Spining Bottom pattern ko chart mein is tarah se identify kiya ja sakta hai:
    • Body: Body chhoti honi chahiye, jo yah darshati hai ki buyers aur sellers ke beech mein balance hai.
    • Upper shadow: Upper shadow lambi honi chahiye, jo yah darshati hai ki buyers ne price ko upar badhane ki koshish ki thi.
    • Lower shadow: Lower shadow bhi lambi honi chahiye, jo yah darshati hai ki sellers ne price ko niche karne ki koshish ki thi.


    Spining Bottom Candlestick Ka Istemal Kaise Karen?


    Spining Bottom candlestick pattern ka istemal trend reversal ki pahchan karne ke liye kiya ja sakta hai.

    Agar yah pattern downtrend ke ant mein banta hai, to yah ek bullish reversal ka signal de sakta hai. Iska matlab hai ki price uptrend mein badhane ki shuruaat kar sakta hai.

    Agar yah pattern uptrend ke ant mein banta hai, to yah ek bearish reversal ka signal de sakta hai. Iska matlab hai ki price downtrend mein girne ki shuruaat kar sakta hai.

    Spining Bottom pattern ko sirf ek signal ke taur par hi dekhna chahiye. Confirm karne ke liye, aapko other technical indicators ka bhi istemal karna chahiye.


    Spining Bottom candlestick pattern ke sath kuch trading strategies yeh hain:
    • Bullish reversal trade: Agar spinning bottom pattern downtrend ke ant mein banta hai, to aap buy order kar sakte hain aur price ke upar stop-loss order rakh sakte hain.
    • Bearish reversal trade: Agar spinning bottom pattern uptrend ke ant mein banta hai, to aap sell order kar sakte hain aur price ke niche stop-loss order rakh sakte hain.


    Yah dhyan rakhna zaroori hai ki koi bhi trading strategy 100% sahi nahin hoti hai. Trading mein hamesha risk hota hai.

    Spining Bottom candlestick pattern ek useful tool ho sakta hai jo aapko trend reversals ki pahchan karne mein madad kar sakta hai. Lekin, yah sirf ek signal hai aur aapko confirm karne ke liye other technical indicators ka bhi istemal karna chahiye.


    Disclaimer

    Main koi financial advisor nahin hun aur main aapko koi bhi financial advice nahin de sakta hun. Trading mein hamesha risk hota hai aur aapko apna khud ka research karna chahiye aur apne liye sahi trading decisions lene chahiye.
  • <a href="https://www.instaforex.org/ru/?x=ruforum">InstaForex</a>
  • #2 Collapse

    Spinning Bottom Candlestick Pattern

    Introduction

    Spinning Bottom candlestick pattern aik technical analysis ka tool hai jo financial markets mein price movement ko samajhne ke liye use hota hai. Yeh pattern traders aur investors ko potential trend reversal ke indications provide karta hai. Yeh pattern market ke sentiment aur uncertainty ko highlight karta hai.

    Click image for larger version

Name:	hqdefault.jpg
Views:	34
Size:	50.3 کلوبائٹ
ID:	13036689
    Definition aur Formation

    Spinning Bottom candlestick pattern tab form hota hai jab opening aur closing prices ke darmiyan farq bohat kam hota hai, aur upper aur lower shadows relatively long hoti hain. Yeh pattern bearish aur bullish dono trends mein dekhne ko mil sakta hai.

    Components:
    1. Small Real Body: Iska real body chhota hota hai, jo opening aur closing prices ke darmiyan kam farq ko indicate karta hai.
    2. Long Upper Shadow: Yeh shadow high price aur closing price ke darmiyan farq ko show karti hai.
    3. Long Lower Shadow: Yeh shadow low price aur opening price ke darmiyan farq ko show karti hai.
    Interpretation aur Importance


    Spinning Bottom candlestick pattern ko market ki indecision ya uncertainty ka signal samjha jata hai. Jab yeh pattern form hota hai, iska matlab hai ke buyers aur sellers dono ki strength equal hai aur koi clear trend nahi ban raha.

    Bullish Spinning Bottom:
    • Agar yeh pattern downtrend mein form hota hai, toh yeh potential bullish reversal ka indication ho sakta hai.
    • Iska matlab hai ke sellers weak ho rahe hain aur buyers market mein interest show kar rahe hain.

    Bearish Spinning Bottom:
    • Agar yeh pattern uptrend mein form hota hai, toh yeh potential bearish reversal ka indication ho sakta hai.
    • Iska matlab hai ke buyers weak ho rahe hain aur sellers market mein interest show kar rahe hain.

    Click image for larger version

Name:	internet-business-concept-on-the-background-of-interactive-forex-charts-there-is-a-marker-and-a-sticker-with-the-inscription-bullish-spinning-botto-2JJ4PNX.jpg
Views:	24
Size:	160.3 کلوبائٹ
ID:	13036690
    Example aur Application

    Let's say aik stock ka price consistently decline ho raha hai aur suddenly ek spinning bottom candlestick pattern form hota hai. Iska matlab ho sakta hai ke decline slow ho raha hai aur buyers market mein enter ho rahe hain, jo potential bullish reversal ka signal hai.

    Trading Strategy:
    1. Confirmation: Spinning bottom pattern ke baad ek strong bullish candle ka form hona zaroori hai taake bullish reversal confirm ho sake.
    2. Stop Loss: Yeh important hai ke risk manage karne ke liye stop loss use kiya jaye. Stop loss ko spinning bottom ke low ke neeche set karna chahiye.
    3. Target: Target ko recent resistance level ke paas set karna chahiye.
    Spinning Bottom candlestick pattern aik important tool hai jo market ki sentiment aur potential trend reversals ko identify karne mein madadgar hota hai. Is pattern ko doosre technical indicators aur analysis ke sath combine karke use karna chahiye taake accurate trading decisions liye ja sakein. Trading mein hamesha risk management ka khayal rakhna chahiye aur market ke signals ko samajhne ki koshish karni chahiye.
    • #3 Collapse

      Spinning Bottom candlestick pattern ek technical analysis ka tool hai jo traders aur investors ko market ki movement samajhne mein madad karta hai. Yeh pattern aksar market ki consolidation ya indecision ko represent karta hai. Isme candlestick ki body choti hoti hai aur upper aur lower shadows lambi hoti hain. Yeh pattern tab banta hai jab opening aur closing prices ke darmiyan farq kam hota hai, magar high aur low prices ke darmiyan zyada farq hota hai.
      Spinning Bottom pattern ko aksar neutral pattern samjha jata hai, lekin iske context ko samajhna bohot zaroori hai. Yeh pattern bullish ya bearish trend ke baad bhi aa sakta hai, aur uski significance depend karti hai is baat par ke market kis direction mein move kar raha hai. Agar yeh pattern uptrend ke baad aata hai, to yeh indicate karta hai ke bulls thake hue hain aur market mein selling pressure barh raha hai. Aur agar yeh pattern downtrend ke baad aata hai, to yeh signal hota hai ke bears weak ho rahe hain aur market mein buying interest barh raha hai.

      Spinning Bottom candlestick pattern ko identify karne ke liye kuch khas features hain jo traders ko dhyan mein rakhne chahiye. Sabse pehla feature hai choti body, jo opening aur closing prices ke darmiyan chote farq ko indicate karta hai. Doosra feature hai lambi shadows, jo market mein high volatility ko reflect karti hain. Yeh shadows indicate karti hain ke market ne higher aur lower levels ko test kiya, lekin end mein near opening price close hua.

      Is pattern ki interpretation market ki broader context par bhi depend karti hai. Agar yeh pattern ek support level ke qareeb form ho raha hai, to yeh indicate kar sakta hai ke market us level ko respect kar raha hai aur wahan se bounce karne ki koshish kar raha hai. Isi tarah agar yeh pattern ek resistance level ke qareeb form ho raha hai, to yeh signal ho sakta hai ke market us level ko break nahi kar paa raha aur wahan se reverse ho sakta hai.

      Trading strategies mein Spinning Bottom pattern ka use karte waqt risk management ka dhyan rakhna bohot zaroori hai. Yeh pattern aksar market ki indecision ko indicate karta hai, isliye yeh zaroori hai ke traders iske saath confirmatory indicators ka bhi use karein. For example, volume analysis, trendlines, aur moving averages ka use karke market ke trend aur strength ko samajhna helpful ho sakta hai.

      Spinning Bottom pattern ko use karte waqt ek aur important aspect hai time frame. Different time frames par yeh pattern alag significance rakh sakta hai. For example, daily chart par yeh pattern ek different context mein interpret hoga, jabke hourly chart par iski interpretation mukhtalif ho sakti hai. Isliye yeh zaroori hai ke traders apni trading strategy aur time frame ke mutabiq is pattern ko interpret karein

      Akhir mein, Spinning Bottom candlestick pattern ek valuable tool hai jo market ki indecision aur potential reversal ko identify karne mein madad karta hai. Lekin iske saath saath confirmatory indicators aur risk management strategies ka use karna bhi zaroori hai. Market ki broader context ko samajhkar aur alag alag time frames ka analysis karke, traders is pattern ka effective use kar sakte hain aur apne trading decisions ko improve kar sakte hain
      • #4 Collapse

        Spinning Bottom Candlestick Pattern: Forex Trading Guide

        1. Candlestick Patterns Ki Introduction


        Candlestick patterns Forex trading mein ek important tool hai jise traders price movements aur market sentiment ko analyze karne ke liye use karte hain. In patterns ka study karne se traders ko market dynamics aur potential future price movements ke insights milte hain.

        Candlestick patterns ka concept Japan se aaya hai, jahaan rice trading ke time par traders ne graphical representations develop kiye to analyze rice prices. Har ek candlestick pattern specific information provide karta hai about price action during a certain period of time.
        2. Spinning Bottom Candlestick Pattern Ki Samajh


        Spinning Bottom pattern ek specific type ka candlestick pattern hai jo market trend ke reversals ya continuations ko indicate karta hai. Is pattern mein ek small body hota hai jo upper aur lower shadows se surrounded hota hai. Jab is pattern ka formation kisi trend ke baad hota hai, to iska interpretation us trend ke continuation ya reversal ke liye critical hota hai.

        Spinning Bottom pattern ke formation aur components ko samajhna traders ke liye crucial hai. Is pattern ka size aur shape, aur shadows ke relative length ki analysis karke traders entry aur exit points determine karte hain.
        3. Spinning Bottom Ke Components


        Spinning Bottom pattern ke mukhtalif components ko samajhna trading decisions ke liye crucial hota hai:
        • Body Size: Spinning Bottom pattern ka body chota hota hai, jo ki market indecision ko indicate karta hai.
        • Shadows: Is pattern mein upper aur lower shadows ka length barabar hota hai, reflecting market volatility aur competing forces of buyers aur sellers ke beech.

        Spinning Bottom ka formation significant price moves ke baad hota hai, indicating market indecision. Is pattern ke saath volume aur other technical indicators ka use kiya jata hai to confirm its validity aur reliability.
        4. Formation Ke Requirements


        Spinning Bottom pattern ko identify karne ke liye specific criteria hote hain jin par focus kiya jata hai:
        • Size and Shape: Pattern ka body chota hona chahiye aur shadows ke length nearly equal hona chahiye.
        • Context: Is pattern ka formation aur significance us trend ke context par depend karta hai jisme ye form hota hai, jaise ki support/resistance levels ya fir previous price action.

        Is pattern ko confirm karne ke liye traders often wait karte hain ki kya next candlestick pattern confirmatory signal provide karta hai.
        5. Spinning Bottom Ki Interpretation


        Spinning Bottom pattern ka interpretation us market context par depend karta hai jisme ye form hota hai:
        • Reversal Signal: Agar ye pattern downtrend ke baad form hota hai aur uske baad bullish candlestick follow karta hai, to ye reversal signal ho sakta hai.
        • Continuation Signal: Uptrend mein ye pattern bullish momentum ka continuation indicate karta hai jab uske baad bullish candle follow hota hai.

        Is pattern ka interpretation market psychology aur current market sentiment ke saath correlate hota hai, jo ki future price action ke insights provide karta hai.
        6. Contextual Analysis


        Spinning Bottom ki effectiveness uski position par depend karta hai broader market context ke andar:
        • Support aur Resistance: Agar ye pattern support ya resistance levels ke paas form hota hai, to iska significance aur bhi zyada hota hai.
        • Volume Confirmation: Is pattern ke saath higher volume hone par iski reliability aur bhi jyada hoti hai, indicating strong market sentiment in the direction suggested by the pattern.

        Traders often wait karte hain ki kya next candlestick pattern confirmatory signal provide karta hai for better entry aur exit points determine karne ke liye.
        7. Trading Strategies with Spinning Bottom


        Spinning Bottom pattern ke saath trading strategies formulate karne se pehle traders ko kuch key points par focus karna chahiye:
        • Entry Strategies: Entry points ko define karne ke liye traders often wait karte hain ki kya next candlestick pattern us direction mein confirmatory signal deta hai.
        • Stop Loss Placement: Stop loss levels ko determine karte samay, pattern ke low (for long positions) ya high (for short positions) ke just below ya above set kiya jata hai.
        • Profit Targets: Profit targets ko calculate karte samay, traders previous price movements ya support/resistance levels ko consider karte hain, jo pattern ki height se estimate kiya ja sakta hai.

        Is pattern ke saath trading strategies develop karte samay risk management ka bhi dhyan rakha jata hai for better trading outcomes.
        8. Examples in Forex Markets


        Spinning Bottom pattern ka practical application samajhne ke liye kuch examples dekhe ja sakte hain:
        • EUR/USD Daily Chart: Is chart par dekha ja sakta hai ki kaise Spinning Bottom pattern ne market trend ko indicate kiya aur traders ke liye profitable opportunities create kiye.
        • GBP/JPY Hourly Chart: Is chart par dekha ja sakta hai ki kaise intraday trading mein Spinning Bottom pattern ka use kiya gaya hai, highlighting specific entry aur exit points.

        Real-time examples dekhkar traders ko is pattern ka practical application aur effectiveness samajhne mein madad milti hai.
        9. Common Pitfalls


        Spinning Bottom pattern ke use mein kuch common pitfalls hote hain jo traders ko dhyan mein rakhna chahiye:
        • False Signals: Har ek Spinning Bottom pattern significant price movement ya trend reversal ko indicate nahi karta hai.
        • Over-reliance: Is pattern par adhik nirbhar karne se bachein aur dusre technical indicators aur market analysis tools ka bhi istemal karein.
        • Market Conditions: Always consider broader market conditions aur current news events ko analyze karein, jo pattern ke effectiveness par impact daal sakte hain.

        Is pattern ke use mein traders ko patience aur confirmation ke importance ko samajhna chahiye for effective trading decisions.
        10. Comparison with Similar Patterns


        Spinning Bottom pattern ko similar patterns ke saath compare karne se traders ko aur bhi clarity milti hai:
        • Doji: Both patterns market indecision ko indicate karte hain, lekin unki formation aur implications mein difference hota hai.
        • Hammer aur Inverted Hammer: In patterns ki appearance similar hoti hai, lekin unke interpretation aur context mein difference hota hai.

        Comparative analysis se traders ko different candlestick patterns ke characteristics aur application ke samajhne mein madad milti hai.
        11. Psychology Behind the Pattern


        Spinning Bottom pattern ke peeche market participants ke psychological factors ko samajhna trading decisions mein madadgar ho sakta hai:
        • Indecision: Pattern ka formation indicate karta hai ki market mein kisi bhi ek taraf ka dominance nahi hai, reflecting uncertainty.
        • Potential Shift: Is pattern ke formation ke baad market sentiment mein shift hone ka potential hota hai, depending on subsequent price action.

        Market psychology ko samajh kar traders ko market trends aur potential reversals ya continuations ko anticipate karne mein madad milti hai.
        12. Using Spinning Bottom in Risk Management


        Spinning Bottom pattern ke saath effective risk management strategies apply karne se trading outcomes improve ho sakte hain:
        • Position Sizing: Pattern ki reliability aur risk tolerance ke basis par position size adjust karein.
        • Diversification: Apne trades ko diversify karke individual patterns ke impact ko mitigate karein.

        Risk management techniques ka istemal karke traders apne trading strategies ko strengthen kar sakte hain, reducing overall market risk.
        13. Conclusion


        Spinning Bottom candlestick pattern Forex traders ke liye ek valuable tool hai jo market reversals ya continuations ko anticipate karne mein madad karta hai. Iske formation aur interpretation se traders ko market sentiment aur future price movements ke insights milte hain. Lekin jaise ki har technical indicator, iska use bhi confirmation aur market context ke saath hona chahiye trading decisions ko enhance karne ke liye.
        14. Further Learning and Application


        Spinning Bottom pattern aur other candlestick patterns ko master karne ke liye kuch steps hain:
        • Practice: Historical charts aur real-time market data par patterns identify karein.
        • Education: Courses, books, aur seminars ke through knowledge expand karein.
        • Integration: Fundamental analysis aur other technical indicators ke saath combine karke comprehensive trading strategies develop karein.

        Is comprehensive guide se traders ko Spinning Bottom candlestick pattern ko Forex trading mein effectively leverage karne ki knowledge milti hai, decision-making aur strategy implementation ko enhance karte hue.
        • #5 Collapse

          Introduction to Candlestick Patterns


          Forex trading mein candlestick patterns ka istemal price action analysis ka ek zaroori hissa hai. Ye patterns traders ko market sentiment aur price movements samajhne mein madad karte hain. Candlestick patterns, especially single candle patterns jaise ki Spinning Bottom, market ke short-term reversals ya continuations ko identify karne mein madadgar sabit hote hain. In patterns ki madad se traders market ke dynamics ko samajhte hain aur trading decisions improve karte hain.

          Candlestick patterns ka use Japan se shuru hua tha, jab Japanese traders ne rice trading ke dauraan is technique ko develop kiya tha. Aajkal ye patterns worldwide traders dwara istemal kiye jaate hain aur market analysis ka ek mukhya hissa ban gaye hain. Candlestick patterns ke istemal se traders ko technical analysis ke zariye market trends aur reversals ko predict karne mein madad milti hai.
          What is Spinning Bottom Candlestick Pattern?


          Spinning Bottom candlestick pattern ek single candlestick pattern hai jo market mein trend reversals ya trend continuations ke signals provide karta hai. Is pattern ko identify karne ke liye traders ko candlestick ke mukhtalif parts par dhyan dena hota hai. Ek typical Spinning Bottom candlestick pattern mein, candle ka real body (the central rectangular area) bahut chhota hota hai jabki upper aur lower shadows ya wicks bahut lambi hoti hain.

          Is pattern ka naam isliye hai kyunki iski shape ek spinning top ya gyroscope ki tarah hoti hai jisme real body upper aur lower shadows ke beech mein hoti hai. Ye pattern typically market ke bottom ya support level par dikhta hai, jo ki market sentiment ko indicate karta hai ki buyers ne market ko control kar liya hai aur potential reversal ho sakta hai.
          Characteristics of Spinning Bottom Candlestick Pattern


          Spinning Bottom candlestick pattern ko recognize karne ke liye kuch specific characteristics hote hain jo traders ke liye important hote hain:
          • Small Real Body: Pattern mein candle ka real body bahut chhota hota hai, jo ki market mein indecision ya equilibrium ko indicate karta hai.
          • Long Shadows: Upper aur lower shadows ya wicks bahut lambi hoti hain, indicating ki price during the session ne higher aur lower levels tak move kiya tha.
          • Location: Pattern usually support level ya market ke bottom par form hota hai, indicating potential reversal points.

          Ye characteristics ek saath mil kar ek powerful signal dete hain ki market ka trend change hone ki possibility hai, aur traders ko isko identify karne aur interpret karne mein madad milti hai.
          Interpretation of Spinning Bottom Candlestick Pattern


          Spinning Bottom candlestick pattern ke interpretation mein traders ko kuch key points par dhyan dena hota hai:
          • Location: Pattern ka location bahut important hai. Agar ye pattern market ke support level par form hota hai, toh ye bullish reversal signal ho sakta hai.
          • Volume: Trading volume bhi pattern ke interpretation mein ek important factor hai. Agar pattern ke formation ke samay volume high hai, toh ye pattern ka reliability increase karta hai.
          • Confirmation: Pattern ke formation ke baad next candlestick ki confirmation important hoti hai. Traders typically wait for the next candlestick to close above the high of the Spinning Bottom candle for bullish confirmation, or below its low for bearish confirmation.

          Is pattern ke sahi interpretation se traders ko market ke potential reversals ya continuations ke baare mein better insights milte hain, jo ki unke trading decisions ko improve karte hain.
          Trading Strategies Using Spinning Bottom Pattern


          Spinning Bottom pattern ke use karke kuch common trading strategies hote hain jo traders apply karte hain:
          • Reversal Trading Strategy: Agar Spinning Bottom pattern support level ya market ke bottom par form hota hai, toh traders expect karte hain ki market bullish reversal show karega. Is scenario mein traders long positions le sakte hain, placing stop-loss orders just below the low of the pattern.
          • Continuation Trading Strategy: Agar pattern existing trend ke beech form hota hai, toh ye continuation signal deta hai. Traders existing trend mein trades continue kar sakte hain, using the pattern's high or low as a reference point for placing stop-loss orders.

          Har ek strategy ko implement karte waqt, traders ko apne risk management ke strategies ko bhi dhyan mein rakhna chahiye jaise ki appropriate stop-loss levels set karna aur position sizes manage karna.
          Real-Life Examples and Case Studies


          Spinning Bottom candlestick pattern ke real-life examples aur case studies traders ke liye ek valuable learning tool hai:
          • Example 1: Historical chart analysis where a Spinning Bottom pattern accurately predicted a bullish reversal in a major currency pair.

            In this example, we look at a daily chart of EUR/USD where a Spinning Bottom candlestick pattern formed at a significant support level of 1.1200. The pattern's small body and long lower shadow indicated that sellers tried to push the price lower but failed, and buyers stepped in, causing a reversal. The next candle closed above the Spinning Bottom's high, confirming the bullish reversal. Traders who entered long positions based on this pattern could have profited as the price continued to rise in the following sessions.
          • Example 2: Case study where a Spinning Bottom pattern failed to provide a reliable signal due to low trading volume and lack of confirmation.

            In another scenario, we analyze a 4-hour chart of USD/JPY where a Spinning Bottom pattern formed during a period of low trading volume and market indecision. Despite the pattern indicating a potential reversal, the lack of confirmation from the following candlestick and overall market sentiment led to a false signal. Traders who entered trades solely based on this pattern without considering other factors might have faced losses as the price continued in its previous direction.

          Is tarah ke real-life examples aur case studies traders ko pattern ke application aur reliability ko samajhne mein madad karte hain, aur unhe is pattern ke sahi use ke liye guidance provide karte hain.
          Tips for Trading with Spinning Bottom Candlestick Pattern


          Spinning Bottom pattern ke saath trading karte waqt kuch important tips jo traders ke liye helpful ho sakti hain:
          • Combine with Other Indicators: Pattern ke identification aur confirmation ke liye dusre technical indicators ya price action signals ke saath combine karna.
          • Risk Management: Position size aur stop-loss levels ko set karne mein careful hona, taki trading losses minimize kiya ja sake.
          • Practice and Backtesting: Is pattern ko samajhne aur usko effectively use karne ke liye practice aur historical data par backtesting karna.

          Ye tips traders ko Spinning Bottom pattern ke saath trading karte waqt better decision-making aur risk management mein madad karte hain, jo ki consistent profitability achieve karne mein madadgar sabit ho sakti hain.
          Conclusion


          Spinning Bottom candlestick pattern ek powerful tool hai jo traders ko market ke dynamics samajhne aur trading strategies ko improve karne mein madad karta hai. Is article mein humne is pattern ke basics, characteristics, interpretation, trading strategies, real-life examples, aur tips ko cover kiya hai. Pattern ko samajhna aur effectively use karna, traders ke liye ek crucial skill ban sakta hai jo consistent profitability ko achieve karne mein madad karta hai. Market mein success paane ke liye, traders ko is pattern ke sahi identification aur application par focus rakhna chahiye aur always market conditions aur risk tolerance ko consider karte hue trades execute karni chahiye.
          • #6 Collapse

            **Spinning Bottom Candlestick Pattern: Ek Mufassal Jaankari**
            Spinning bottom candlestick pattern forex aur stock market mein ek important candlestick pattern hai jo traders ke liye potential bullish reversal signal provide karta hai. Is pattern ko samajhna aur istemal karna traders ke liye zaroori hai takay wo market trends ko samajh sakein aur sahi trading decisions le sakein.

            **Spinning Bottom Candlestick Pattern Kya Hota Hai?**

            Spinning bottom candlestick pattern ek single candlestick se form hota hai jo typically downtrend ke baad ya market bottom ke baad develop hota hai. Is pattern mein candlestick ka body chota hota hai aur do lambi shadows hoti hain, ek upper shadow aur ek lower shadow. Candlestick ke bottom par small body hoti hai aur iske upper aur lower shadows almost equal length ke hote hain.

            **Spinning Bottom Pattern Ke Characteristics**

            1. **Small Body:** Spinning bottom pattern mein candlestick ka body chota hota hai jo indicate karta hai ke price movement mein kam variation tha.

            2. **Upper aur Lower Shadows:** Is pattern mein candlestick ke upper aur lower sides par lambi shadows hoti hain. Upper shadow indicate karta hai ke price ne upper levels par bhi jaane ki attempt ki thi lekin sellers ne price ko niche drag kar diya tha, jabki lower shadow indicate karta hai ke buyers ne price ko recover kar diya tha.

            3. **Balance of Power:** Spinning bottom pattern ek balance of power ko indicate karta hai jahan buyers aur sellers ke beech mein struggle hoti hai aur price stability develop hoti hai.

            **Spinning Bottom Pattern Se Trade Ki Information Hasil Karne Ka Tarika**

            1. **Identify Pattern:** Pehle to traders ko chart par spinning bottom pattern identify karna hota hai. Is pattern ko identify karne ke liye candlestick ke characteristics ko samajhna zaroori hai.

            2. **Confirm with Volume:** Volume analysis se confirm karein ke spinning bottom candlestick ke dauran volume kya tha. Agar spinning bottom ke saath high volume tha, to ye indicate karta hai ke market sentiment strong hai aur potential reversal ka confirmation mil sakta hai.

            3. **Wait for Confirmation:** Spinning bottom pattern ko confirm karne ke baad traders ko wait karna hota hai ke kya price next movement mein ja raha hai. Agar price direction confirm hota hai, to traders entry aur exit points decide kar sakte hain.

            4. **Risk Management:** Har trade ke liye risk management strategies zaroori hoti hai jaise stop-loss orders place karna aur position size manage karna.

            **Nateeja**

            Spinning bottom candlestick pattern forex aur stock market mein ek valuable tool hai jo traders ko potential bullish reversal signals provide karta hai. Iska sahi istemal karne se traders apne trading strategies ko refine kar sakte hain aur better decision making kar sakte hain. Haalanki, iska istemal karne se pehle thorough research aur practice zaroori hai taaki traders ko iska potential aur limitations samajh mein aa sakein.
            • #7 Collapse

              Spinning Bottom candlestick pattern ek ahem aur commonly used pattern hai jo financial trading mein istimaal hota hai. Ye pattern market ke sentiment ka ek indication hota hai aur traders isko apni trading decisions mein incorporate karte hain. Is pattern ko samajhna aur use karna trading mein bohat zaroori hai, especially agar aap technical analysis ke zariye apne trades ko manage kar rahe hain.


              Spinning Bottom Candlestick Pattern ka Structure
              Spinning Bottom candlestick ek chhoti body aur lambay upper aur lower shadows (ya wicks) se mil kar banta hai. Is pattern ka matlab yeh hota hai ke price action mein confusion ya indecision hai. Is pattern ki chhoti body show karti hai ke opening aur closing prices mein zyada farq nahi hai, jabke lambay shadows yeh batate hain ke price action ke dauran buyers aur sellers dono ne apni taraf se try kiya, lekin koi bhi dominate nahi kar saka.

              Agar hum Spinning Bottom ko visualize karen to iski body small hoti hai aur shadows kaafi lambay hote hain. Ye pattern mostly neutral hota hai aur iska asar agle candlesticks par depend karta hai. Yeh pattern dono, uptrend aur downtrend, dono situations mein ban sakta hai, lekin isko identify karna aur samajhna ahem hai.

              Spinning Bottom Candlestick ka Interpretation
              Spinning Bottom candlestick ka appearance market mein indecision ko represent karta hai. Iska matlab hai ke market participants, yani buyers aur sellers, dono ke darmiyan balance hai. Yeh balance indicate karta hai ke trend mein kisi bhi taraf shift aa sakta hai. Yani, market ya to upar ja sakti hai ya neeche gir sakti hai, lekin Spinning Bottom sirf yeh signal deta hai ke ab tak koi clear direction nahi hai.

              Uptrend mein Spinning Bottom
              Agar yeh pattern ek uptrend ke dauran ban raha hai, to iska matlab ho sakta hai ke buyers aur sellers ke darmiyan competition ho raha hai. Buyers ne pehle price ko push kiya hai lekin ab sellers ne resist karna shuru kar diya hai. Iska yeh bhi matlab ho sakta hai ke uptrend weak ho raha hai aur market mein possible reversal ya sideways movement ho sakti hai.

              Downtrend mein Spinning Bottom
              Agar yeh pattern ek downtrend mein banta hai, to iska matlab yeh ho sakta hai ke sellers ka pressure kam ho raha hai aur buyers kuch resistance show kar rahe hain. Is pattern ka appearance yeh indicate kar sakta hai ke market bottom ke qareeb hai aur yahan se reversal aasakta hai.

              Spinning Bottom Candlestick Pattern ka Significance
              Spinning Bottom pattern ki significance us context par depend karti hai jisme yeh pattern ban raha hai. Yani, ye pattern kis trend mein ban raha hai, aur uske baad aane wale candlesticks ka kya reaction hai.
              1. Trend Reversal ka Signal: Spinning Bottom pattern ko ek possible trend reversal ke signal ke taur par dekha ja sakta hai, magar yeh zaroori nahi ke har dafa reversal ho. Is pattern ke baad aane wale candlesticks par depend karta hai ke trend change hoga ya nahi.
              2. Indecision Market mein: Is pattern ka sab se bada signal yeh hota hai ke market mein indecision hai. Buyers aur sellers dono apni jagah strong hain lekin kisi ne bhi dusre par kabza nahi kiya. Yeh market mein uncertainty ko show karta hai.
              3. Confirmation Candlestick ka Zaroori Hona: Spinning Bottom pattern kabhi kabhi confusion create kar sakta hai, isliye agla candlestick bohat important hota hai. Agar agla candlestick ek strong bullish ya bearish pattern ho, to yeh confirm kar sakta hai ke market kahan move karegi.
              Spinning Bottom Candlestick ke Saath Trading Strategies
              Spinning Bottom candlestick pattern ke sath kaafi trading strategies ko incorporate kiya ja sakta hai. Yahan kuch common strategies discuss ki ja rahi hain jo traders use karte hain:

              1. Confirmation Candlestick ka Wait karna
              Jaisa ke pehle discuss kiya gaya, Spinning Bottom apne aap mein ek weak signal hai aur iske sath agla candlestick dekhna zaroori hota hai. Confirmation candlestick ke aane ka wait karna ek sensible approach hai. Agar Spinning Bottom ke baad ek strong bullish candlestick ban jaye, to yeh signal hai ke market mein uptrend continue ho sakta hai. Isi tarah agar bearish candlestick ban jaye, to yeh signal hai ke downtrend continue hoga.

              2. Support aur Resistance Levels ka Istimaal
              Spinning Bottom pattern ko support aur resistance levels ke sath combine karna ek effective strategy ho sakti hai. Agar yeh pattern support level par ban raha hai, to yeh indication ho sakti hai ke market mein reversal aasakta hai. Isi tarah agar yeh resistance level par ban raha hai, to yeh signal ho sakta hai ke market mein selling pressure barh raha hai.
              3. Volume Analysis


              Volume analysis bhi Spinning Bottom pattern ko trade karne mein madadgar ho sakti hai. Agar Spinning Bottom high volume ke sath ban raha hai, to yeh signal hai ke market mein strong indecision hai aur agle move ke liye market participants active hain. Agar low volume ho, to yeh pattern itna reliable nahi hoga.
              4. Multiple Timeframes ka Istimaal


              Different timeframes par Spinning Bottom pattern ko dekhna bhi ek acchi strategy ho sakti hai. Agar yeh pattern multiple timeframes par confirm ho raha ho, to yeh signal ho sakta hai ke market mein significant move aane wala hai. Example ke taur par, agar aapko daily aur hourly charts dono par Spinning Bottom pattern mil raha hai, to yeh signal ho sakta hai ke market mein reversal ya strong move aasakta hai.
              Spinning Bottom Pattern ka Comparison Doosray Candlestick Patterns se


              Spinning Bottom pattern ko samajhne ke liye zaroori hai ke aap doosray candlestick patterns se bhi isko compare karen. Yeh comparison aapko zyada behtar andaza dene mein madad karega ke kis situation mein yeh pattern zyada valuable hai.

              1. Doji Candlestick Pattern
              Doji aur Spinning Bottom dono indecision ko represent karte hain, lekin inmein farq hai. Doji mein opening aur closing prices almost barabar hoti hain aur shadows bhi short ho sakti hain. Spinning Bottom mein body thodi si badi hoti hai aur shadows usually long hoti hain. Doji zyada strong indecision ka signal hota hai jabke Spinning Bottom mild indecision ka.

              2. Hammer Candlestick Pattern
              Hammer pattern aur Spinning Bottom mein bhi kuch similarities hain lekin inka context alag hota hai. Hammer ek bullish reversal pattern hota hai jo downtrend ke end mein banta hai aur iski lower shadow kaafi badi hoti hai. Spinning Bottom ka context neutral hota hai aur yeh har tarah ke trends mein ban sakta hai.

              3. Spinning Top Pattern
              Spinning Top aur Spinning Bottom pattern mein farq yeh hai ke Spinning Top ke upper shadow zyada lambay hotay hain jabke Spinning Bottom mein dono shadows, upper aur lower, barabar ya lagbhag barabar hoti hain. Spinning Top bhi indecision ko represent karta hai lekin upper wick ke zyada lamba honay ki wajah se yeh thoda zyada bearish signal ho sakta hai.


              Spinning Bottom Pattern ka Limitations aur Challenges
              Jab bhi aap candlestick patterns use karte hain, to yeh samajhna zaroori hai ke inka asar 100% nahi hota. Spinning Bottom pattern ke bhi kuch limitations hain:
              1. Market Conditions ka Asar: Spinning Bottom ka asar market conditions par depend karta hai. Agar market highly volatile hai, to yeh pattern kam reliable ho sakta hai.
              2. False Signals: Kabhi kabhi Spinning Bottom pattern false signals bhi de sakta hai, especially agar isko confirmation ke baghair trade kiya jaye.
              3. Over-reliance ka Risk: Sirf Spinning Bottom pattern par rely karna risky ho sakta hai. Isko doosray technical indicators ke sath combine karna chahiye jaise ke Moving Averages, RSI, ya MACD.
              Spinning Bottom candlestick pattern ek important tool hai jo traders ko market sentiment samajhne mein madad deta hai. Yeh pattern indecision aur possible reversal ka signal de sakta hai lekin isko trade karne se pehle confirmation candlestick ka wait karna zaroori hota hai. Yeh pattern uptrend aur downtrend dono mein ban sakta hai, lekin iski reliability context aur agle candlesticks par depend karti hai. Is pattern ko successfully use karne ke liye zaroori hai ke aap isko doosray indicators aur market analysis ke sath combine karen. Iska asar market conditions, volume, aur support/resistance levels par bhi depend karta hai. Spinning Bottom pattern ko samajhne ke baad aap isko apni trading strategy mein incorporate karke better decisions le sakte hain. Trading mein success hasil karne ke liye sabr aur analysis ka hona zaroori hai, aur Spinning Bottom pattern ek ahem component hai jo aapki success mein madadgar ho sakta hai.
              Believe in yourself and your abilities. When you fight for your dreams, you can achieve anything.
              • #8 Collapse

                Candlestick Pattern;

                Spinning Bottom candlestick sample ko market ki indecision ya uncertainty ka sign samjha jata hai. Jab yeh sample form hota hai, iska matlab hai ke buyers aur dealers dono ki power same hai aur koi clear trend nahi ban raha.
                Main koi economic marketing consultant nahin hun aur fundamental aapko koi bhi financial advice nahin de sakta hun. Trading mein hamesha hazard hota hai aur aapko apna khud ka studies karna chahiye aur apne liye sahi buying and selling choices lene chahiye.Decline ho raha hai aur suddenly ek spinning bottom candlestick sample shape hota hai. Iska matlab ho sakta hai ke decline gradual ho raha hai aur consumers marketplace mein input ho rahe hain, jo potential bullish reversal ka sign hai.


                Introduction

                Spinning Bottom candlestick pattern aik technical evaluation ka tool hai jo economic markets mein rate movement ko samajhne ke liye use hota hai. Yeh pattern traders aur buyers ko capability fashion reversal ke symptoms offer karta hai. Yeh sample marketplace ke sentiment aur uncertainty ko highlight karta hai.Spinning Bottom candlestick pattern tab form hota hai jab commencing aur final expenses ke darmiyan farq bohat kam hota hai, aur top aur lower shadows tremendously lengthy hoti hain. Yeh pattern bearish aur bullish dono tendencies mein dekhne ko mil sakta hai.Candlestick pattern ek technical analysis ka tool hai jo traders aur investors ko market ki movement samajhne mein madad karta hai. Yeh pattern aksar market ki consolidation ya indecision ko represent karta hai. Isme candlestick ki frame choti hoti hai aur higher aur decrease shadows lambi hoti hain. Yeh sample tab banta hai jab starting aur ultimate charges ke darmiyan farq kam hota hai, magar excessive aur low costs ke darmiyan zyada farq hota hai.
                Spinning Bottom pattern ko aksar impartial pattern samjha jata hai, lekin iske context ko samajhna bohot zaroori hai. Yeh pattern bullish ya bearish fashion ke baad bhi aa sakta hai, aur uski significance rely karti hai


                Trading Strategy:


                Spinning Bottom candlestick pattern ko identify karne ke liye kuch khas capabilities hain jo traders ko dhyan mein rakhne chahiye. Sabse pehla characteristic hai choti frame, jo beginning aur remaining prices ke darmiyan chote farq ko imply karta hai. Doosra characteristic hai lambi shadows, jo market mein excessive volatility ko mirror karti hain. Yeh shadows suggest karti hain ke marketplace ne higher aur decrease levels ko test kiya, lekin cease mein close to commencing fee close hua.Spinning Bottom pattern ko use karte waqt ek aur critical element hai time frame. Different time frames par yeh sample alag importance rakh sakta hai. For example, day by day chart par yeh sample ek unique context mein interpret hoga, jabke hourly chart par iski interpretation mukhtalif ho sakti hai. Isliye yeh zaroori hai ke investors apni buying and selling approach aur time frame ke mutabiq is pattern ko interpret karein
                • #9 Collapse

                  Spinning Bottom Candlestick Pattern Kya Hai?


                  Spinning Bottom candlestick pattern aik important reversal signal hai jo market mein trend ke end ya reversal ka indication deta hai. Ye pattern tab banta hai jab market mein bulls aur bears ka barabar ka fight hota hai, lekin aakhri mein dono side se koi bhi jeet nahi pata. Iska matlab ye hai ke market ki trend mein change aane wala hai ya phir market consolidate kar raha hai.
                  Pattern Ki Structure


                  Spinning Bottom pattern aik single candlestick se banta hai. Is candle ka body chhota hota hai, jo is baat ki nishani hai ke opening aur closing price ke darmiyan zyada difference nahi tha. Is candle ka upper aur lower shadow (wick) almost barabar hota hai, jo ye dikhata hai ke price dono sides mein gaye, lekin last mein price phir se kareeb kareeb wahi pe close hua jahan se open hua tha.
                  Spinning Bottom Ka Significance


                  Spinning Bottom pattern ka significance is baat par depend karta hai ke ye market ke kis part mein banta hai. Agar ye pattern uptrend ke end mein banta hai, to ye indication hota hai ke market mein bearish reversal aane wala hai. Waisa hi, agar ye downtrend ke end mein banta hai, to ye indication hota hai ke bullish reversal aasakta hai. Lekin, ye pattern akela reliable nahi hota, isliye isse confirm karne ke liye doosre indicators ya patterns ka use karna zaroori hai.
                  Trading Strategy


                  Spinning Bottom pattern ko trade karte waqt thoda caution rakhna zaroori hai. Agar ye pattern uptrend ke baad banta hai, to iske baad market ke price action ko closely observe karna chahiye. Agar next candle bearish hoti hai, to ye indication hota hai ke reversal confirm ho raha hai, aur is point par sell position lena acha idea ho sakta hai.

                  Agar ye pattern downtrend ke end mein banta hai aur uske baad bullish candle form hoti hai, to ye sign hai ke market mein bullish reversal ho raha hai. Is situation mein buy position lena faydemand ho sakta hai.
                  Risk Management


                  Risk management Spinning Bottom pattern ko trade karte waqt bahut important hota hai. Stop loss levels ko identify karna zaroori hai. Agar aap uptrend ke end mein Spinning Bottom pattern dekhte hain aur bearish position lena chahte hain, to apna stop loss us candle ke high ke upar set karna chahiye. Waisa hi, downtrend ke end mein agar aap bullish position lena chahte hain, to stop loss us candle ke low ke neeche set karna chahiye.
                  Conclusion


                  Spinning Bottom candlestick pattern aik useful tool hai jo market ke trend mein possible reversal ka indication deta hai. Lekin, is pattern ko akela use karne ke bajaye doosre technical indicators aur patterns ke saath mila kar use karna chahiye. Isse aap apni trading decisions ko aur zyada strong aur accurate bana sakte hain. Risk management ko hamesha apni strategy ka hissa banayein taake unexpected market movements se apni capital ko protect kar sakein.
                  • <a href="https://www.instaforex.org/ru/?x=ruforum">InstaForex</a>
                  • #10 Collapse

                    **Spinning Bottom Candlestick Pattern**
                    Forex trading mein candlestick patterns ka bohot bara role hota hai, aur in patterns ko samajhna har trader ke liye bohot zaroori hai. Spinning Bottom candlestick pattern unhi important patterns mein se ek hai jo trend reversal ka indication de sakti hai.

                    **Spinning Bottom Candlestick Pattern Kya Hai?**

                    Spinning Bottom candlestick pattern ek single candlestick se mil kar banta hai. Is pattern mein candlestick ka body bohot chhota hota hai, jab ke uske upper aur lower shadows kaafi lambay hote hain. Yeh pattern usually market ke uncertain situation ko show karta hai, jahan buyers aur sellers ke darmiyan koi clear dominance nahi hoti. Iska matlab hai ke neither buyers and neither sellers market ko control kar pa rahay hote hain.

                    Yeh pattern generally tab banta hai jab ek strong trend ke baad market mein confusion hoti hai. Agar market mein ek downward trend chal raha ho aur Spinning Bottom pattern form ho, toh yeh indicate kar sakta hai ke market mein ab reversal ya consolidation ho sakti hai. Similarly, agar upward trend ke baad yeh pattern banta hai, toh yeh bhi market mein reversal ki nishani ho sakta hai.

                    **Spinning Bottom Pattern Kaise Trade Karein?**

                    Jab bhi aapko chart mein Spinning Bottom candlestick pattern nazar aaye, toh isko sirf ek signal ke tor pe na lein. Aapko market ke overall trend, aur dusray indicators ke signals ko bhi consider karna chahiye. Aksar traders Spinning Bottom ko confirmation ke liye use karte hain, aur jab dusray indicators bhi reversal ka indication dete hain, tab wo apni trading strategy ko execute karte hain.

                    Is pattern ko trade karte waqt, agar aapko lagta hai ke market mein reversal hone wala hai, toh aap apna stop-loss thoda tight rakh sakte hain. Yeh is liye taake agar market wapis apne original trend ki taraf move kare, toh aapke losses limited hoon.

                    **Conclusion**

                    Spinning Bottom candlestick pattern ek important tool hai jo traders ko market ke sentiments aur possible reversals ka indication de sakta hai. Magar, yeh zaroori hai ke aap isko dusray analysis tools ke sath use karein taake aapke decisions zyadah accurate hon. Har market condition mein yeh pattern equally effective nahi hota, is liye proper research aur analysis ke baghair trade na karein.

                    اب آن لائن

                    Working...
                    X