Commodity Channel Index Indicator Trading Strategy

No announcement yet.
`
X
  • وقت
  • دکھائیں
Clear All
new posts
  • #1 Collapse

    Commodity Channel Index Indicator Trading Strategy


    Forex trading ek mushkil aur competition wala industry hai jahan traders mufeed trades karne ke liye mukhtalif tools aur techniques istemal karte hain. Aik aise tool ka naam hai Commodity Channel Index (CCI) indicator, jo traders dwara market mein potential overbought ya oversold conditions ka pata lagane ke liye istemal hota hai.

    Is article mein, hum CCI indicator trading strategy par guftugu karenge, ye kaise kaam karta hai, aur forex market mein iske faiday aur nuqsanat ke mutaliq baat karenge.

    I. CCI Indicator Ki Introducation

    Commodity Channel Index (CCI) ek momentum-based oscillator hai jo mojudgi ka price level an average price level ke mutabiq measure karne ke liye istemal hota hai specific period of time. CCI indicator -100 se +100 tak range karta hai, jahan readings +100 se ooper ane par overbought condition ko zahir karti hain aur readings -100 se neeche ane par oversold condition ki taraf ishara deti hain.

    CCI indicator ka calculation is formula ke zariye hota hai:

    CCI = (Typical Price - Simple Moving Average) / (0.015 x Mean Deviation)

    Jahan:
    - Typical Price = (High + Low + Close) / 3
    - Simple Moving Average = Specific period ke average of Typical Prices
    - Mean Deviation = Specific period ke Simple Moving Average se Typical Prices ka average deviation

    II. CCI Indicator Trading Strategy

    CCI indicator mukhtalif tareeqon se istemal kiya ja sakta hai forex market mein potential trading opportunities ko pehchanne ke liye. Ek common trading strategy jo CCI indicator ka istemal karti hai, wo hai CCI crossover strategy, jo CCI line ko kisi khaas threshold ke ooper ya neeche cross karne ke liye istemal karti hai buy ya sell signals generate karne ke liye.

    Yahan CCI crossover strategy ko implement karne ke steps hain:

    1. CCI Indicator Parameters Set Karein: Pehla qadam ye hai ke CCI indicator ke parameters ko set karein, including the period length aur threshold levels for overbought aur oversold conditions. CCI indicator ke common parameter settings hote hain 14 period length ke sath aur threshold levels +100 for overbought conditions aur -100 for oversold conditions ke liye.

    2. CCI Crossovers Ko Pehchanen: unhalate pe dhyan de jahan CCI line +100 level ke upar cross kar rahi ho ta ke buy signal generate ho ya -100 level ke neeche cross kar rahi ho ta ke sell signal generate ho.

    3. Signal Ko Confirm Karein: CCI crossover signal ko confirm karne ke liye zaroori hai dosre technical indicators ya chart patterns ke sath taake trade ke safalta ke chances increase ho. Kuch traders CCI indicator ko dosre indicators jaise moving averages ya trend lines ke sath istemal karte hain signal ko confirm karne ke liye.

    4. Stop Loss aur Take Profit Levels Place Karein: Risk ko manage karne ke liye stop loss orders place karein taake potential losses ko limit karein aur take profit orders place karein taake profits ko lock kar dein. A common approach ye hota hai ke long trades ke liye recent low ke neeche stop loss order place karein aur short trades ke liye recent high ke upar stop loss order place karein.

    5. Trade Ko Monitor Karein: Trade ko nazdeek se monitor karein aur stop loss aur take profit levels ko adjust karte rahein jab trade progress hoti hai. Traders ko profits ko protect karne ke liye trailing stop losses bhi consider karna chahiye in case of a reversal.

    III. CCI Indicator Trading Strategy Ke Fawaid aur Nuqsanat

    Jaise koi bhi trading strategy, CCI indicator trading strategy ke apne faiday aur nuqsanat hote hain. Yahan kuch potential benefits aur drawbacks hain CCI indicator ka istemal karne ke liye forex trading mein:

    Fawaid:
    - CCI indicator ek versatile tool hai jo mukhtalif market conditions aur timeframes mein istemal kiya ja sakta hai.
    - CCI crossover strategy relatively simple aur easy to implement hai, jo ise beginner aur experienced traders ke liye suitable banata hai.
    - CCI indicator traders ko market mein potential overbought ya oversold conditions ka pata lagane mein madad karta hai, jisse profitable trading opportunities paida hoti hain.

    Nuqsanat:
    - CCI indicator false signals generate kar sakta hai, khas kar choppy ya ranging market conditions mein, jo traders ke liye losses le kar aata hai.
    - CCI crossover strategy price movements ke peechay reh sakta hai, jisse trading opportunities miss hone ya delayed entry signals aane ke chances hote hain.
    - CCI indicator ek lagging indicator hai, matlab ye future price movements aur trends ko accurately predict nahi kar sakta.

    IV. Conclusion

    Akhri mein, Commodity Channel Index (CCI) indicator traders ke liye ek fayede mand tool ho sakta hai forex market mein potential trading opportunities ko identify karne ke liye overbought ya oversold conditions par base karte hue. CCI crossover strategy ek popular trading strategy hai jo traders ko CCI indicator istemal karke buy aur sell signals generate karne mein madad karta hai.

    Magar, zaroori hai ke traders CCI indicator ko dosre technical indicators aur risk management techniques ke sath istemal karein taake successful trades ke probability ko increase karein. Traders ko CCI indicator ke limitations ka bhi maloom hona chahiye aur changing market conditions ke base par apni trading strategy ko adjust karne ke liye tayyar rehne chahiye.

    Overall, CCI indicator trading strategy traders ke liye ek mufeed tool ho sakta hai unke trading arsenal mein shamil karne ke liye aur unki trading performance ko improve karne ke liye forex market mein.
  • <a href="https://www.instaforex.org/ru/?x=ruforum">InstaForex</a>
  • #2 Collapse

    Commodity Channel Index (CCI) Indicator Trading Strategy in Forex Trading


    Forex trading offers a plethora of technical indicators to help traders analyze market trends and make informed decisions. One such tool is the Commodity Channel Index (CCI), developed by Donald Lambert in 1980. This article explores how traders can effectively use the CCI indicator to enhance their trading strategies.
    1. Introduction to the Commodity Channel Index (CCI)


    CCI is a versatile oscillator that measures the current price level relative to an average price level over a specified period of time. It helps identify overbought or oversold conditions in the market, as well as potential trend reversals.

    The calculation of CCI involves taking the difference between the typical price of an asset and its simple moving average (SMA), dividing the result by the mean absolute deviation of the typical price. This normalization process allows CCI to vary between +100 and -100, with extremes indicating potential trading opportunities.
    2. Understanding CCI Calculation


    The Commodity Channel Index (CCI) is calculated using the following steps:
    1. Calculate the Typical Price (TP): Sum of high, low, and close divided by 3.
    2. Calculate the Simple Moving Average (SMA) of the Typical Prices: Usually calculated over a period of 20 periods.
    3. Calculate the Mean Deviation: Absolute deviation of TP from its SMA, averaged over the same 20 periods.

    The formula for CCI is: CCI=TP−SMA of TP0.015×Mean Deviation\text{CCI} = \frac{\text{TP} - \text{SMA of TP}}{0.015 \times \text{Mean Deviation}}CCI=0.015×Mean DeviationTP−SMA of TP​

    This calculation provides a normalized oscillator that moves between +100 and -100, indicating overbought and oversold conditions respectively.
    3. Interpreting CCI Levels


    CCI typically fluctuates between -100 and +100, with extreme levels indicating potential trading signals. When CCI moves above +100, it suggests that the price is overbought and may soon reverse downwards. Conversely, when CCI drops below -100, it suggests that the price is oversold and may soon reverse upwards.

    Traders often use these extreme levels as signals to enter or exit trades. However, it's essential to consider other technical and fundamental factors before making trading decisions solely based on CCI levels.
    4. Basic CCI Trading Strategies

    a. CCI as an Overbought/Oversold Indicator


    One of the simplest ways to use CCI is to identify overbought and oversold conditions:
    • Buying Opportunities: Look for CCI below -100 and rising, signaling potential buy opportunities as the market might be oversold and could reverse upwards.
    • Selling Opportunities: Look for CCI above +100 and falling, indicating potential sell opportunities as the market might be overbought and could reverse downwards.

    By waiting for CCI to reach these extreme levels and then confirming with other technical indicators or price action, traders can increase the probability of successful trades.
    b. CCI Divergence Trading


    CCI divergence occurs when the price action forms a different pattern from the CCI indicator, suggesting a potential reversal. There are two types of divergence:
    • Bullish Divergence: Occurs when the price forms lower lows while CCI forms higher lows, indicating potential upward momentum.
    • Bearish Divergence: Occurs when the price forms higher highs while CCI forms lower highs, indicating potential downward momentum.

    Divergence trading with CCI can be a powerful tool when combined with other technical analysis techniques to confirm signals and manage risk effectively.
    5. Advanced CCI Trading Strategies

    c. CCI with Moving Average Crossovers


    Moving averages are popular indicators used to smooth out price data and identify trends. When combined with CCI, moving average crossovers can provide additional confirmation signals:
    • Golden Cross: CCI crossing above its moving average suggests a bullish trend, signaling potential buy opportunities.
    • Death Cross: CCI crossing below its moving average suggests a bearish trend, signaling potential sell opportunities.

    Traders often use these crossover signals to enter trades in the direction of the trend identified by CCI, enhancing the accuracy of their trading decisions.
    d. Using CCI to Set Stop Loss and Take Profit Levels


    Setting appropriate stop loss and take profit levels is crucial for managing risk and maximizing profitability in forex trading:
    • Stop Loss: Place stop losses above or below recent highs or lows that correspond with CCI levels to protect against adverse price movements.
    • Take Profit: Set profit targets based on historical price action and CCI signals, ensuring that potential gains are captured while minimizing the risk of giving back profits.

    By integrating CCI levels with stop loss and take profit strategies, traders can create a disciplined approach to risk management and trade execution.
    6. Practical Example of CCI Strategy

    e. Case Study: Applying CCI in Real-Time Trading


    To illustrate the effectiveness of CCI strategies, consider a hypothetical trade scenario:
    • Scenario: A trader identifies CCI crossing above +100, indicating overbought conditions. They wait for confirmation from other technical indicators or price action signals before entering a short trade.
    • Entry: The trader enters a short position as CCI confirms overbought conditions and other indicators align with the bearish bias.
    • Management: The trader sets a stop loss above recent highs and a take profit target based on historical support levels or Fibonacci retracement levels.
    • Outcome: If the trade moves in the expected direction, the trader profits from the price reversal indicated by CCI.

    By documenting and analyzing such case studies, traders can refine their CCI strategies and improve decision-making in real-time trading environments.
    7. Backtesting and Optimizing CCI Strategy

    f. Importance of Backtesting


    Backtesting involves testing a trading strategy using historical data to evaluate its performance and reliability:
    • Process: Use historical price data to simulate trades based on CCI signals and other trading criteria.
    • Analysis: Evaluate the profitability, drawdowns, and consistency of the strategy over different market conditions.
    • Optimization: Adjust parameters such as CCI period, overbought/oversold levels, and exit criteria to maximize profitability and minimize risk.

    By backtesting CCI strategies, traders can gain confidence in their approach and identify potential areas for improvement before deploying them in live trading environments.
    g. Optimizing CCI Strategy


    Optimizing a CCI strategy involves fine-tuning its parameters to adapt to changing market conditions and improve performance:
    • Parameter Adjustment: Experiment with different CCI periods (e.g., 14, 20, 30) to determine which provides the most reliable signals.
    • Filtering Signals: Use additional technical indicators or filters to confirm CCI signals and reduce false positives.
    • Risk Management: Incorporate effective stop loss and take profit levels based on historical volatility and CCI readings to manage risk effectively.

    Continuous optimization ensures that CCI strategies remain robust and adaptable to varying market dynamics, enhancing their long-term profitability potential.
    8. Risk Management with CCI

    h. Managing Risk Effectively


    Risk management is crucial in forex trading to protect capital and minimize losses during adverse market conditions:
    • Position Sizing: Determine the appropriate position size based on account size, risk tolerance, and CCI signal reliability.
    • Stop Loss Placement: Set stop losses based on recent price action or CCI levels to limit potential losses if the trade moves against expectations.
    • Diversification: Spread risk across multiple trades and asset classes to reduce overall portfolio volatility and exposure to specific market risks.

    By integrating risk management principles with CCI trading strategies, traders can safeguard their capital and maintain consistency in achieving their trading goals.
    i. Avoiding Common Pitfalls


    To avoid pitfalls associated with CCI trading, consider the following:
    • Overtrading: Resist the urge to trade every CCI signal without considering other market factors or confirming signals from complementary indicators.
    • Ignoring Fundamentals: While technical analysis is essential, be mindful of economic events, news releases, and geopolitical factors that may impact market sentiment and price movements.

    Maintaining discipline and a comprehensive approach to trading can help mitigate risks and enhance the overall effectiveness of CCI strategies.
    9. Advantages of Using CCI

    j. Benefits of CCI Indicator


    The CCI indicator offers several advantages to forex traders:
    • Clear Signals: CCI provides clear entry and exit signals based on overbought/oversold conditions and divergence patterns.
    • Versatility: Suitable for various trading styles, including scalping, day trading, and swing trading.
    • Objective Analysis: Helps traders make objective trading decisions based on quantifiable data rather than emotional reactions.

    By leveraging these advantages, traders can capitalize on market opportunities and improve their trading performance over time.
    k. Practical Integration of CCI


    Integrating CCI with other technical indicators or trading systems can further enhance its effectiveness:
    • Moving Averages: Combine CCI with moving average crossovers to confirm trends and identify potential entry points.
    • Support and Resistance Levels: Use CCI to validate support and resistance levels and adjust trading strategies accordingly.
    • Volatility Indicators: Incorporate volatility measures to adjust stop loss and take profit levels based on market conditions.

    By customizing CCI strategies to fit specific trading preferences and market environments, traders can optimize their trading outcomes and achieve consistent profitability.
    10. Limitations of CCI

    l. Drawbacks of CCI Indicator


    While CCI is a valuable tool, it has limitations that traders should be aware of:
    • False Signals: CCI can generate false signals, especially in choppy or sideways markets with erratic price movements.
    • Lagging Indicator: CCI may lag behind rapid price changes, leading to missed opportunities or delayed reactions.
    • Subjectivity: Interpretation of CCI signals can vary among traders, leading to inconsistent trading decisions.

    To mitigate these drawbacks, traders should complement CCI with other technical indicators, fundamental analysis, and risk management strategies to make well-informed trading decisions.
    11. Integration of CCI with Other Indicators

    m. Combining CCI with Other Tools


    To enhance signal reliability, consider combining CCI with complementary technical indicators:
    • Relative Strength Index (RSI): Confirm overbought/oversold conditions identified by CCI with RSI readings.
    • Moving Average Convergence Divergence (MACD): Use MACD crossovers to validate trend reversals indicated by CCI divergence.
    • Bollinger Bands: Utilize Bollinger Bands to identify price volatility and potential breakout opportunities in conjunction with CCI signals.

    By integrating multiple indicators, traders can corroborate signals and increase confidence in their trading decisions, leading to more consistent performance.
    12. Best Practices for CCI Trading

    n. Tips for Effective CCI Trading


    To optimize CCI trading strategies, consider the following best practices:
    • Consistent Parameters: Establish consistent CCI parameters (e.g., period, overbought/oversold levels) based on thorough testing and analysis.
    • Patience and Discipline: Wait for confirmed signals and avoid impulsive trading based solely on initial CCI readings.
    • Continuous Learning: Stay updated with market trends, economic events, and new developments in technical analysis to refine CCI strategies over time.

    By adhering to these best practices, traders can develop a structured approach to CCI trading that enhances profitability and minimizes risk in the dynamic forex market.
    13. Practical Application in Trading

    o. Implementing CCI Strategies


    Implementing CCI strategies involves a systematic approach to:
    • Strategy Development: Define clear entry and exit criteria based on CCI signals and confirmatory indicators.
    • Risk Assessment: Evaluate potential risks and rewards for each trade, adjusting position sizes and stop losses accordingly.
    • Performance Monitoring: Track the effectiveness of CCI strategies through regular review and analysis of trading results.

    By documenting trades and analyzing performance metrics, traders can identify strengths and weaknesses in their CCI strategies, leading to continuous improvement and enhanced profitability.
    14. Case Study: Real-Time Example

    p. Case Study: Applying CCI in Forex Trading


    Consider a practical example of applying CCI strategies in forex trading:
    • Market Analysis: Identify a currency pair exhibiting clear trends or potential reversals based on CCI signals.
    • Trade Execution: Enter a trade based on confirmed CCI signals, considering additional technical indicators and fundamental analysis.
    • Risk Management: Implement appropriate risk management techniques, including stop losses and take profit levels aligned with CCI readings.
    • Outcome Analysis: Evaluate trade outcomes, learning from successes and failures to refine future CCI strategies.

    By analyzing real-time examples, traders can gain practical insights into the application of CCI strategies and adapt them to different market conditions effectively.
    15. Conclusion


    In conclusion, the Commodity Channel Index (CCI) is a valuable tool for forex traders seeking to identify potential entry and exit points based on market momentum and overbought/oversold conditions. By understanding its calculation, interpreting its signals, and integrating it with other indicators, traders can develop robust strategies to navigate the complexities of the forex market effectively.
    16. Glossary

    q. Key Terms


    To aid understanding, here are key technical terms used in this article:
    • Overbought: A condition where the price of an asset has risen more than its market fundamentals justify, potentially indicating a pending price decline.
    • Oversold: A condition where the price of an asset has fallen more than its market fundamentals justify, potentially indicating a pending price increase.
    • Divergence: A situation where price movement and an indicator, such as CCI, move in opposite directions, suggesting a potential change in trend direction.
    • Moving Average (MA): A statistical calculation used to analyze data points by creating a series of averages of different subsets of the full data set.
    17. References

    r. Sources and Further Reading


    For readers interested in exploring CCI trading strategies further, here are some recommended resources:
    • Books: "New Concepts in Technical Trading Systems" by J. Welles Wilder Jr.
    • Websites: Investopedia, TradingView, and Forex Factory offer comprehensive guides and discussions on CCI and other technical indicators.
    18. Acknowledgments

    s. Contributors and Support


    Acknowledgment of individuals or organizations whose insights and support contributed to the development of this article.
    This extended guide provides traders with a comprehensive understanding of CCI and its application in forex trading. By mastering CCI strategies and integrating them with sound risk management practices, traders can enhance their decision-making process and potentially improve trading outcomes in the competitive forex market.
    • #3 Collapse

      **Commodity Channel Index (CCI) Indicator Trading Strategy**
      Commodity Channel Index (CCI) ek popular momentum-based indicator hai jo traders ko overbought aur oversold conditions ko identify karne mein madad deta hai. Yeh indicator commodity, forex, aur stocks trading mein equally useful hota hai. Is post mein, hum CCI indicator ki trading strategy ko detail mein discuss karenge aur samjhenge ke isko kaise effectively use kiya ja sakta hai.

      **Commodity Channel Index (CCI) Indicator Kya Hai?**

      CCI indicator ek momentum oscillator hai jo price action ke average deviation ko measure karta hai. Yeh indicator overbought aur oversold conditions ko identify karne ke liye use hota hai. CCI values -100 se +100 ke beech oscillate karti hain. Jab CCI +100 se upar hota hai to market overbought condition mein hota hai aur jab -100 se neeche hota hai to market oversold condition mein hota hai.

      **CCI Indicator Trading Strategy**

      1. **Overbought aur Oversold Conditions:**
      CCI indicator ko use karke overbought aur oversold conditions ko identify karein. Jab CCI +100 se upar ho to market overbought hai aur sell signal generate hota hai. Jab CCI -100 se neeche ho to market oversold hai aur buy signal generate hota hai.

      2. **Divergence:**
      CCI indicator divergence ko identify karne mein bhi madadgar hota hai. Jab price higher highs bana raha ho aur CCI lower highs bana raha ho to bearish divergence hota hai jo ke potential trend reversal ko indicate karta hai. Isi tarah, jab price lower lows bana raha ho aur CCI higher lows bana raha ho to bullish divergence hota hai jo potential trend reversal ko indicate karta hai.

      3. **CCI Crossovers:**
      CCI crossovers bhi trading signals generate karte hain. Jab CCI -100 se cross karke upar jaye to buy signal hota hai aur jab CCI +100 se cross karke neeche aaye to sell signal hota hai. Yeh crossovers strong momentum shifts ko indicate karte hain.

      4. **Combining with Other Indicators:**
      CCI indicator ko doosre indicators ke sath combine karke zyada accurate signals hasil kiye ja sakte hain. For example, moving averages aur support/resistance levels ke sath CCI ko combine karke false signals ko filter kiya ja sakta hai.

      **CCI Indicator Trading Strategy Ke Faide**

      1. **Identify Overbought aur Oversold Conditions:**
      CCI indicator traders ko easily overbought aur oversold conditions ko identify karne mein madad deta hai jo profitable trading opportunities provide karta hai.

      2. **Trend Reversals:**
      CCI divergence aur crossovers se trend reversals ko identify karna asan hota hai.

      3. **Simple Aur Effective:**
      Yeh indicator use karne mein simple hai aur effective trading signals generate karta hai.

      **CCI Indicator Trading Strategy Ke Risks**

      1. **False Signals:**
      Kabhi kabhi CCI indicator false signals de sakta hai jo losses ka sabab ban sakte hain. Isliye, confirmatory indicators ka use zaroori hai.

      2. **Lagging Indicator:**
      CCI ek lagging indicator hai jo price movements ke baad signals generate karta hai. Early entry aur exit missed ho sakti hain.

      **Conclusion**

      Commodity Channel Index (CCI) indicator ek powerful tool hai jo traders ko overbought aur oversold conditions ko identify karne mein madad deta hai. Is indicator ko sahi tarah se samajh kar aur implement karke, traders apni trading performance ko improve kar sakte hain. Lekin, hamesha risk management ko madde nazar rakhna chahiye aur confirmatory indicators ka use karna chahiye taake false signals se bacha ja sake. Trading mein successful hone ke liye consistent analysis aur research bohot zaroori hai.
      • #4 Collapse

        Commodity Channel Index (CCI)

        Introduction
        Assalam o Alaikum Dear Friends and Fellows Commodity Channel Index (CCI) aik aham technical indicator hy jo trading me istemal hota hy. Ye indicator traders ko market me aane wale possible trends aur reversals ko samajhne me madadgar hota hy. Is article me, hum CCI indicator ki madad se step-wise trading strategy ko samjhenge.

        Click image for larger version

Name:	1.jpg
Views:	39
Size:	20.8 کلوبائٹ
ID:	13035285
        Trading Strategy Using Commodity Channel Index


        Step 1: Indicator Ki Tashreeh
        CCI ek momentum oscillator hy jo market ke volatility aur overbought/oversold conditions ko darust karta hy. Iska calculation ek complex formula par mabni hota hy, lekin aapko iske exact details par focus nahi karni chahiye. CCI ki values -100 se +100 ke darmiyan hoti hein. +100 se ziada values overbought conditions ko darust karti hein, jabke -100 se kam values oversold conditions ko darust karti hein.

        Step 2: Time Frame Selection
        CCI indicator ko istemal karny se pehly, aapko trading time frame chunna hoga. Yeh aapke trading objectives aur tolerance level par depend karta hy. Agar aap short-term trading karty hein toh chota time frame jaise 5-minute ya 15-minute charts ka istemal kar sakty hein. Long-term traders ke liye daily ya weekly charts zyada madadgar hoti hein.

        Step 3: Buy and Sell Signals
        CCI indicator ke signals aapko buy aur sell points provide kar sakty hein.
        Buy Signal: Agar CCI +100 se upar chala jata hy, toh ye ek buy signal hy. Yani ke market me bullish trend ho sakta hy aur aapko long position lena chahiye.
        Sell Signal: Agar CCI -100 se neechy gir jata hy, toh ye ek sell signal hy. Yani ke market me bearish trend ho sakta hy aur aapko short position lena chahiye.

        Step 4: Divergence Ka Tafteesh
        CCI indicator ki madad se aap divergence tafteesh kar sakty hein. Agar market price aur CCI indicator ke beech me mukhtalif raste par hein, toh ye ek strong reversal signal ho sakta hy. Agar CCI neechy gir raha hy lekin market price upar ja rahi hy, toh ye bearish divergence hy aur sell signal ho sakta hy. Upar ki taraf jane wale market price aur neechy ja rahe CCI me farq ho to ye bullish divergence hy aur buy signal ho sakta hy.

        Step 5: Risk Management
        Trading strategy me risk management ek ahem hissa hy. Har trade me stop-loss aur take-profit levels ko set karna zaruri hy. Stop-loss aapko nuksan se bachata hy aur take-profit aapko munafa se nawazta hy. CCI indicator ke signals ke sath-sath in levels ko tay karna bohot zaruri hy.

        Step 6: Practice and Testing
        CCI indicator ki trading strategy ko real market conditions me test karna bohot zaruri hy. Demo trading account istemal karke aap apni strategy ko refine kar sakty hein aur confidence build kar sakty hein.

        Step 7: Psychological Readiness
        Trading ek psychological khel hy. Hamesha dhyan me rakhein ke market me nuksan bhi ho sakta hy. Apni trading strategy par mazboot rahein aur hamesha tajziya karty rahein.
        Advice:Yaad rahen ke koi bhi trading strategy risk ke sath aati hy. Isliye hamesha apne trading capital ko surakshit rakhein aur jameen par rehne wale aurat rahein. Trading me safalta hasil karny ke liye patience aur discipline bohot ahem hein.
        • #5 Collapse

          Commodity Channel Index (CCI) Indicator Trading Strategy
          • Ta'aruf
          • Commodity Channel Index (CCI) ek technical indicator hai jo traders ko market ke trend aur potential reversals identify karne mein madad deta hai. Yeh indicator asset ki price ke momentum ko measure karta hai aur overbought aur oversold conditions identify karta hai. CCI ke zariye, traders apni trading strategies ko refine kar sakte hain aur better trading decisions le sakte hain. Is article mein hum CCI indicator ka detailed study karenge aur dekhenge ke kis tarah se yeh market analysis mein madadgar sabit hota hai.

          CCI Ki Tehqiq

          CCI ko Donald Lambert ne 1980 mein introduce kiya tha. Lambert ka maqsad ek aisa tool develop karna tha jo cyclical price movements ko identify kar sake. Yeh indicator originally commodity markets ke liye design kiya gaya tha, lekin aaj kal yeh stocks, forex, and other financial markets mein bhi extensively use hota hai. Lambert ne yeh observe kiya tha ke prices cyclic patterns follow karti hain aur CCI in patterns ko accurately identify karne mein madad karta hai.
          • Calculation Ka Tariqa
          • CCI ka formula hai: (Typical Price - Moving Average) / (0.015 * Mean Deviation). Yeh formula price aur uske average ke darmiyan ka difference nikaalta hai aur us difference ko mean deviation se divide karta hai. 0.015 ek constant hai jo CCI ki values ko standard range mein rakhta hai. Calculation ke liye pehle Typical Price calculate ki jati hai, phir uska Moving Average nikaala jata hai, aur phir Mean Deviation calculate hota hai.

          Typical Price Kya Hai

          Typical Price calculate karne ke liye, High, Low aur Close prices ko add kar ke 3 se divide kiya jata hai. Typical Price ka formula hai: (High + Low + Close) / 3. Yeh average price hoti hai jo ek specific period ke liye market ka overall sentiment reflect karti hai. Typical Price CCI calculation ka pehla step hai aur isse hi Mean Deviation aur Moving Average calculate karne mein madad milti hai.


          Mean Deviation Ki Calculation

          Mean Deviation calculate karne ke liye, Typical Price aur Moving Average ke differences ka absolute value ka average nikaala jata hai. Yeh step zaroori hai kyunki yeh CCI ke denominator ko define karta hai. Mean Deviation ka formula hai: (Sum of |Typical Price - Moving Average|) / N, jahan N period length hai. Mean Deviation CCI ko price fluctuations ke mutabiq adjust karne mein madad karta hai.


          CCI Ka Interpretation

          CCI ki value +100 se upar hoti hai to overbought condition indicate hoti hai aur -100 se neeche hoti hai to oversold condition indicate hoti hai. Yeh levels traders ko market ki extreme conditions identify karne mein madad karte hain. +100 se upar CCI ki value ka matlab hai ke price bohot tezi se upar gayi hai aur reversal ka chance hai. Isi tarah, -100 se neeche CCI ki value ka matlab hai ke price bohot tezi se niche aayi hai aur yeh buying opportunity ho sakti hai.
          • Trend Identification
          • Agar CCI +100 ke upar ho to market bullish hai aur agar -100 ke neeche ho to market bearish hai. Yeh basic interpretation hai jo CCI ko trend identification ke liye useful banata hai. Bullish market mein CCI positive territory mein hota hai jab ke bearish market mein yeh negative territory mein move karta hai. Yeh trends identify karne ke liye CCI ko price ke movement ke sath compare karna zaroori hai.

          Overbought aur Oversold Levels

          +100 ke upar overbought level indicate hota hai jahan se price niche aa sakti hai aur -100 ke neeche oversold level indicate hota hai jahan se price upar ja sakti hai. Yeh levels traders ko potential entry aur exit points identify karne mein madad karte hain. Jab CCI +100 ke upar jata hai, to yeh signal ho sakta hai ke market mein buying pressure bohot zyada hai aur reversal ho sakta hai. Isi tarah, -100 ke neeche CCI ki value ka matlab hai ke selling pressure bohot zyada hai aur price rebound kar sakti hai.


          Breakouts Ki Pehchan

          Jab CCI -100 se upar ya +100 se neeche breakout kare, to yeh significant trend change indicate kar sakta hai. Breakouts trend continuation ya reversal ka signal ho sakte hain. Jab CCI -100 ke neeche se upar move karta hai, to yeh bullish trend ki shuruaat ka signal ho sakta hai. Isi tarah, jab CCI +100 ke upar se neeche move karta hai, to yeh bearish trend ki shuruaat ka signal ho sakta hai. Breakout signals ko confirm karne ke liye, traders additional technical indicators ka istemal bhi kar sakte hain.


          Trend Reversals

          CCI ke extreme levels se trend reversals identify kiye ja sakte hain. +200 ya -200 ki levels par bhi reversal points observe kiye ja sakte hain. Jab CCI +200 se upar chala jata hai, to yeh indicate karta hai ke market bohot overbought hai aur reversal ka chance hai. Isi tarah, jab CCI -200 se neeche jata hai, to yeh oversold condition indicate karta hai aur market reversal ki possibility badh jati hai. Trend reversals ko accurately identify karne ke liye, price action aur other technical indicators ka bhi analysis zaroori hai.


          Divergences

          Price aur CCI ke beech divergence bhi ek strong signal hota hai. Agar price new high banaye aur CCI nahi to bearish divergence aur agar price new low banaye aur CCI nahi to bullish divergence hota hai. Divergences potential trend reversals ke indicators hote hain. Bearish divergence tab hoti hai jab price higher highs banati hai lekin CCI lower highs banata hai. Yeh indicate karta hai ke bullish momentum weak ho raha hai aur price niche aa sakti hai. Bullish divergence tab hoti hai jab price lower lows banati hai lekin CCI higher lows banata hai. Yeh indicate karta hai ke bearish momentum weak ho raha hai aur price upar ja sakti hai.
          • CCI Histogram
          • CCI Histogram bhi trend strength measure karne mein madadgar hota hai. Positive histogram bullish trend aur negative histogram bearish trend indicate karta hai. CCI Histogram price aur CCI ke darmiyan difference ko graphically represent karta hai. Jab histogram positive territory mein hota hai, to yeh bullish trend ko confirm karta hai aur jab negative territory mein hota hai, to yeh bearish trend ko confirm karta hai. Histogram ki changes ko observe karke, traders trend strength aur potential reversals ko assess kar sakte hain.

          Trading Signals

          Buy signal tab generate hota hai jab CCI -100 se upar move kare aur sell signal tab generate hota hai jab CCI +100 se neeche move kare. Yeh basic trading signals hain jo CCI se derive kiye jate hain. Buy signal indicate karta hai ke market oversold condition se recover ho rahi hai aur bullish trend start ho sakta hai. Sell signal indicate karta hai ke market overbought condition se decline ho rahi hai aur bearish trend start ho sakta hai. Trading signals ko confirm karne ke liye, additional indicators aur price action analysis ka bhi use kiya jata hai.


          Combining with Other Indicators

          CCI ko doosre indicators jaise ke Moving Averages, RSI ke saath combine karke trading strategy ko enhance kiya ja sakta hai. Moving Averages CCI ke trend signals ko confirm karne mein madadgar hote hain. For example, agar CCI buy signal de aur price Moving Average ke upar ho, to yeh stronger buy signal hota hai. Isi tarah, Relative Strength Index (RSI) CCI ke overbought aur oversold conditions ko confirm kar sakta hai. CCI ko multiple indicators ke sath combine karke, traders apni strategy ki accuracy aur reliability improve kar sakte hain.


          Risk Management

          Risk management ke liye, stop-loss levels define karna zaroori hai. Oversold levels par buy karte waqt previous low ko stop-loss aur overbought levels par sell karte waqt previous high ko stop-loss set kar sakte hain. Stop-loss levels define karke, traders apne capital ko unexpected market movements se protect kar sakte hain. Risk management strategy mein position sizing aur risk-to-reward ratio ka bhi khayal rakha jata hai. Yeh ensure karta hai ke ek trade par zyada risk na liya jaye aur overall trading performance stable rahe.


          Timeframes

          CCI ko different timeframes par use karke short-term aur long-term trends identify kiye ja sakte hain. Short-term trading ke liye, CCI ko lower timeframes jaise ke 15-minute, 1-hour ya 4-hour charts par use kiya jata hai. Long-term trading ke liye, CCI ko higher timeframes jaise ke daily, weekly ya monthly charts par use kiya jata hai. Different timeframes par CCI ka analysis karke, traders market ke multiple perspectives se trends aur reversals ko identify kar sakte hain. Yeh multi-timeframe analysis strategy ko robust banane mein madadgar hota hai.


          Backtesting

          Kisi bhi trading strategy ko use karne se pehle backtesting zaroori hai. CCI trading strategy ko historical data par test karke uski effectiveness verify ki ja sakti hai. Backtesting se yeh pata lagta hai ke strategy past market conditions mein kaisa perform karti thi aur kya yeh consistently profitable hai ya nahi. Is process mein historical price data ka use karke trades simulate kiye jate hain aur strategy ke performance metrics jaise ke win rate, risk-to-reward ratio aur maximum drawdown ko analyze kiya jata hai. Backtesting se traders ko confidence milta hai aur wo apni strategy ko real market conditions mein implement karne ke liye better prepared hote hain.


          Advantages

          CCI ke advantages mein trend identification, early entry aur exit signals aur versatile application shamil hain. CCI ek adaptable indicator hai jo different markets aur timeframes mein use kiya ja sakta hai. Yeh indicator price cycles ko accurately identify karta hai aur traders ko market ke trend aur potential reversals ka timely signal deta hai. CCI ke zariye traders market ke extreme conditions ko bhi detect kar sakte hain, jo profitable trading opportunities provide karta hai. Yeh indicator simple formula aur clear interpretation ki wajah se bhi popular hai.


          Disadvantages​​​​​​​

          Har indicator ki tarah, CCI bhi kuch limitations rakhta hai, jaise ke false signals aur choppy markets mein poor performance. CCI overbought aur oversold levels par false signals generate kar sakta hai, especially jab market trending nahi hoti. Yeh choppy markets mein zyada reliable nahi hota kyunki price fluctuations frequent hote hain aur CCI ki values rapidly change hoti hain. Is wajah se, CCI ko doosre indicators aur price action ke sath combine karke use karna chahiye taake signals ko confirm kiya ja sake. Additionally, CCI ki accuracy increase karne ke liye longer timeframes aur smooth price data use karna beneficial hota hai.


          Commodity Channel Index (CCI) ek powerful tool hai jo traders ko market ke trends aur potential reversals identify karne mein madad deta hai. Isse sahi tarike se use karke profitable trading decisions liye ja sakte hain. CCI ke basic principles aur calculation method ko samajhne ke baad, traders isse apni trading strategy mein integrate kar sakte hain. Risk management aur additional technical indicators ke sath combine karke, CCI ki reliability aur profitability ko further enhance kiya ja sakta hai. Proper backtesting aur analysis ke baad, CCI trading strategy real market conditions mein successful ho sakti hai.
          • #6 Collapse

            **Commodity Channel Index Indicator Trading Strategy**
            Commodity Channel Index (CCI) ek technical analysis indicator hai jo traders aur investors ke liye market ki trend aur momentum ko evaluate karne mein madad deta hai. CCI ek oscillating indicator hai jo generally overbought ya oversold levels ko identify karne mein istemal hota hai. Iska basic concept hai ki jab market overbought hota hai, tab price neeche jaane ka expectation hota hai aur jab oversold hota hai, tab price upar jaane ka expectation hota hai.

            CCI ka calculation price ke variation se hota hai. Isme typically last 20 periods ke average price se current price ka difference aur is average price ke standard deviation ka ratio hota hai. Isse ek normalized indicator milta hai jo -100 se +100 ke beech oscillate karta hai.

            CCI ka use karke traders multiple trading strategies develop karte hain. Ek common strategy hai CCI ka divergence analysis jisme price movement aur CCI ke movement ke beech mein contradiction ko identify kiya jata hai. Agar price higher high banata hai lekin CCI lower high banata hai, toh yeh bearish divergence signal deta hai aur downward movement expected hota hai. Is tarah se bullish divergence mein opposite scenario hota hai.

            Ek aur popular strategy hai CCI ka overbought aur oversold levels ka use karna. Jab CCI +100 se upar jata hai, tab market overbought consider hota hai aur selling opportunity ki signal hoti hai. Jab CCI -100 se neeche jaata hai, tab market oversold consider hota hai aur buying opportunity ki signal hoti hai.

            CCI ke signals ko confirm karne ke liye traders aur investors doosre technical indicators aur price action analysis ka bhi use karte hain. Isme moving averages, support aur resistance levels, aur volume analysis bhi include hota hai.

            Yeh strategy depend karti hai market ki volatility aur current trend par. Isliye traders ko CCI ke signals ko samajhne mein aur unpar depend karne se pehle thorough analysis aur risk management ka dhyan rakhna zaroori hai.

            Agar aap CCI indicator ka use karna chahte hain apne trading strategy mein, toh pehle isko acche se samajhna aur practice karna important hai. Real-time market conditions par iska application karne se pehle demo account par backtesting karna aur risk management ke principles ko follow karna crucial hai.

            CCI ek versatile tool hai jo different timeframes par use kiya ja sakta hai aur short-term se long-term trading strategies develop karne mein madad deta hai. Isliye, har trader ko apne risk tolerance aur trading goals ke according CCI ka use consider karna chahiye.

            Yeh indicator market ki dynamic nature ko samajhne aur profitable trading opportunities ko identify karne mein madad karta hai, lekin iska use samajhdari aur discipline ke saath karna zaroori hai.
            • #7 Collapse

              **Commodity Channel Index (CCI) Indicator Trading Strategy**
              Commodity Channel Index (CCI) ek popular technical indicator hai jo traders ke liye price trends aur potential reversals identify karne mein madad deta hai. Yeh indicator originally Donald Lambert ne develop kiya tha aur iska istemal market volatility aur price movements ko analyze karne ke liye hota hai.

              **CCI Indicator ki Tashreeh**

              CCI indicator price movements ko analyze karne ke liye use hota hai. Yeh momentum-based indicator hai jo price ki current level ko uske average se compare karta hai. Iska basic formula yeh hai:

              \[ CCI = \frac{{\text{{Typical Price}} - \text{{SMA of Typical Price}}}}{{0.015 \times \text{{Mean Deviation}}}} \]

              Yahan par:
              - Typical Price = (High + Low + Close) / 3
              - SMA = Simple Moving Average
              - Mean Deviation = Average Deviation from the SMA

              CCI typically +100 aur -100 levels ke around oscillate karta hai. +100 se zyada hone par yeh indicate karta hai ki price overbought ho sakta hai aur reversal ka chance hai, jabki -100 se neeche hone par yeh oversold condition aur potential reversal ki indication deta hai.

              **CCI Indicator Trading Strategy**

              1. **Overbought and Oversold Conditions:** CCI indicator ke +100 aur -100 levels ko identify karne se traders overbought aur oversold conditions ko identify karte hain. Jab CCI +100 se upar jaata hai, traders sell positions consider karte hain aur jab -100 se neeche jaata hai, to buy positions consider karte hain.

              2. **Divergence Analysis:** Traders CCI ke readings ko price action ke saath compare karte hain. Agar price higher highs bana raha hai aur CCI lower highs bata raha hai (negative divergence), to yeh potential reversal signal ho sakta hai, aur vice versa.

              3. **Trend Confirmation:** CCI indicator traders ko trend confirm karne mein bhi madad deta hai. Jab CCI positive territory mein hai aur trend upar ki taraf ja raha hai, to uptrend confirm hota hai, jabki negative territory mein trend neeche jaane ki indication deta hai.

              **Forex Trading Mein CCI Indicator ka Istemal**

              Forex trading mein CCI indicator ka istemal short-term aur medium-term trading strategies develop karne mein hota hai. Traders is indicator ki madad se market volatility ko samajhte hain aur price reversals ko predict karne ki koshish karte hain. CCI ke readings ke saath price action analysis karke traders apne entry aur exit points determine karte hain.

              **Conclusion**

              CCI indicator forex trading mein ek versatile tool hai jo traders ko price trends, momentum, aur potential reversals ke bare mein valuable insights provide karta hai. Iske sahi istemal se traders apne trading strategies ko refine karte hain aur market conditions ko better understand karke apne trading decisions ko improve karte hain. CCI indicator ke through traders risk ko manage karte hain aur consistent profitability achieve karne ki koshish karte hain.
              • #8 Collapse

                Commodity Channel Index (CCI) Indicator Trading Strategy

                Commodity Channel Index (CCI) ek mashhoor aur powerful technical indicator hai jo traders ko market ke trends aur price reversals identify karne mein madad karta hai. Is article mein hum CCI indicator ki trading strategy ke bare mein baat karenge. Yeh guide 6 headings mein divided hai jahan aapko CCI ke basics se lekar advanced trading techniques tak sab kuch samjhaya jayega.
                1. Commodity Channel Index (CCI) Indicator Kya Hai?


                CCI ek momentum-based oscillator hai jo kisi bhi financial instrument ki price movement ka analysis karta hai. Is indicator ko Donald Lambert ne 1980 mein introduce kiya tha aur iska basic purpose yeh hai ke price ko overbought ya oversold conditions mein identify kiya jaye.

                Yeh indicator ek scale par kaam karta hai jo -100 se +100 ke beech rehta hai. Jab CCI +100 se upar chala jata hai, toh iska matlab hai ke market overbought hai aur price gir sakta hai. Jab yeh -100 se neeche jata hai, toh iska matlab hai ke market oversold hai aur price barh sakta hai.
                2. CCI Indicator Ko Kaise Use Karein?


                CCI indicator ko use karne ka tareeqa bohot simple hai. Isse aap kisi bhi trading platform par laga sakte hain. TradingView, MetaTrader 4 (MT4), aur MT5 par yeh easily available hai.
                • Step 1: Apne chart par CCI indicator apply karein.
                • Step 2: Indicator ki default settings (14-period) ko use karein ya apni trading strategy ke mutabiq customize karein.
                • Step 3: Price ki movement aur CCI ki positioning ko closely observe karein.

                3. CCI Ki Signals Ko Samajhna


                CCI indicator ke signals ko samajhna aur unhe trading decisions mein implement karna bohot zaroori hai.
                • Overbought Signal: Jab CCI +100 se upar chala jata hai, iska matlab hai ke price apne high par hai aur correction ya reversal ho sakta hai.
                • Oversold Signal: Jab CCI -100 se neeche jata hai, iska matlab hai ke price low par hai aur wahan se price upward move kar sakta hai.
                • Zero Line Crossover: Jab CCI zero line cross karta hai, toh yeh ek trend continuation ka signal deta hai. Agar CCI neeche se upar jaye, toh bullish trend ka indication hota hai. Agar upar se neeche aaye, toh bearish trend ka indication hota hai.

                4. CCI Ke Sath Entry Aur Exit Points


                CCI indicator trading mein accurate entry aur exit points define karne mein madad karta hai.
                • Buy Signal: Jab CCI -100 ke neeche se upar ki taraf move kare, toh yeh ek buy signal hota hai. Is waqt aapko long position open karni chahiye.
                • Sell Signal: Jab CCI +100 ke upar se neeche ki taraf move kare, toh yeh ek sell signal hota hai. Is waqt aapko short position lena chahiye.
                • Stop-Loss Placement: Jab bhi CCI par trading karein, apna stop-loss zaroor set karein. Buy trades ke liye recent low ke neeche aur sell trades ke liye recent high ke upar stop-loss lagayen.

                5. CCI Ko Doosre Indicators Ke Sath Combine Karna


                CCI ko doosre indicators ke sath combine karne se aapki trading accuracy barh sakti hai. Yahan kuch popular combinations diye gaye hain:
                • CCI + Moving Average: Jab CCI buy signal de aur price moving average ke upar ho, toh yeh confirmation hota hai ke trend upward hai.
                • CCI + RSI: Jab CCI oversold ho aur RSI bhi 30 ke neeche ho, toh yeh strong buy signal hai.
                • CCI + MACD: MACD ke sath CCI use karna divergence aur trend reversals identify karne ke liye best strategy hai.

                6. CCI Trading Strategy Ke Liye Tips Aur Best Practices


                Akhir mein kuch tips jo CCI indicator ko effectively use karne mein madadgar hongi:
                1. Backtest Karein: Kisi bhi new strategy ko real market mein apply karne se pehle backtest karna zaroori hai.
                2. Risk Management: Apne capital ka zyada hissa ek trade mein risk mat karein. General rule hai ke aap apne account ka sirf 1-2% risk karein.
                3. Trend Follow Karein: CCI ko trend-following strategies ke liye use karein aur market ki overall direction ka hamesha dhyan rakhein.
                4. Avoid False Signals: Sirf CCI ke signals par rely na karein. Hamesha multiple confirmations ka wait karein.
                5. Emotions Control Karein: Trading mein patience aur discipline kaafi zaroori hai. Apne trading plan se hatkar decisions mat karein.

                Conclusion


                Commodity Channel Index (CCI) ek versatile aur reliable indicator hai jo trading strategies ko enhance karne mein madad karta hai. Agar aap isse effectively use karte hain, toh aap market trends aur price reversals ko better predict kar sakte hain. Is article mein di gayi strategies aur tips ko follow karte huye aap apne trading results improve kar sakte hain.

                Hamesha yaad rakhein ke trading ek high-risk activity hai, is liye apna capital sirf ussi level tak risk karein jo aap afford kar sakein. Happy Trading!
                 
                • #9 Collapse

                  Commodity channel index

                  forex market mein commodity channel index aik kesam ka technical indicator hota hey or yeh zyada tar time indicator ka chart
                  neutral zone mein he enter ho jata hey jes ke wajah say market nesbatan sakon mein hote hey yeh tools forex market ke price e raftar ko he identify kar sakte hein naiz yeh keh CCI ke madad say aik trader keh market kab zyada overbought karay ge or kab zyada oversold karay ge es tarah tred ke thakan or market kay reversal janay eslah ke paishan goi ke ja sakte hey

                  forex market mein index aik curve ke tarah he lagta hey jo keh 0 say oper ya nechay jata hey 100+ or 200+ or 100- or 200- ke level bhe hote hein en ka estamal price ke raftar kay sath sath market ke overbought ya oversold hallat ke bhe paish goi kar sakte hey
                  CCI trading ke amome asolon kay sath he hote hey forex market mein aik trend mein trade karnay kay asol he hotay hein or trading kay ley aik eslah hote hey
                  strong up trend mein CCI ke trading strategy he hote hey ap ko indicator 0 line ko break kar kay reversal trade mein enter ho sakta hey jab ap down trend mein trade kar rahay hon to market reversal bhe ja sakte hey jab tak aik indicator 0 line ko break na he kar day or sell trade mein enter ho sakta hey

                  Commodity Channel Index signal

                  trend trading kay ley CCI signal ko he zahair kar sakta hey yeh es time zahair jab CCI 0 line kay signal ko he cross kar sakte hey
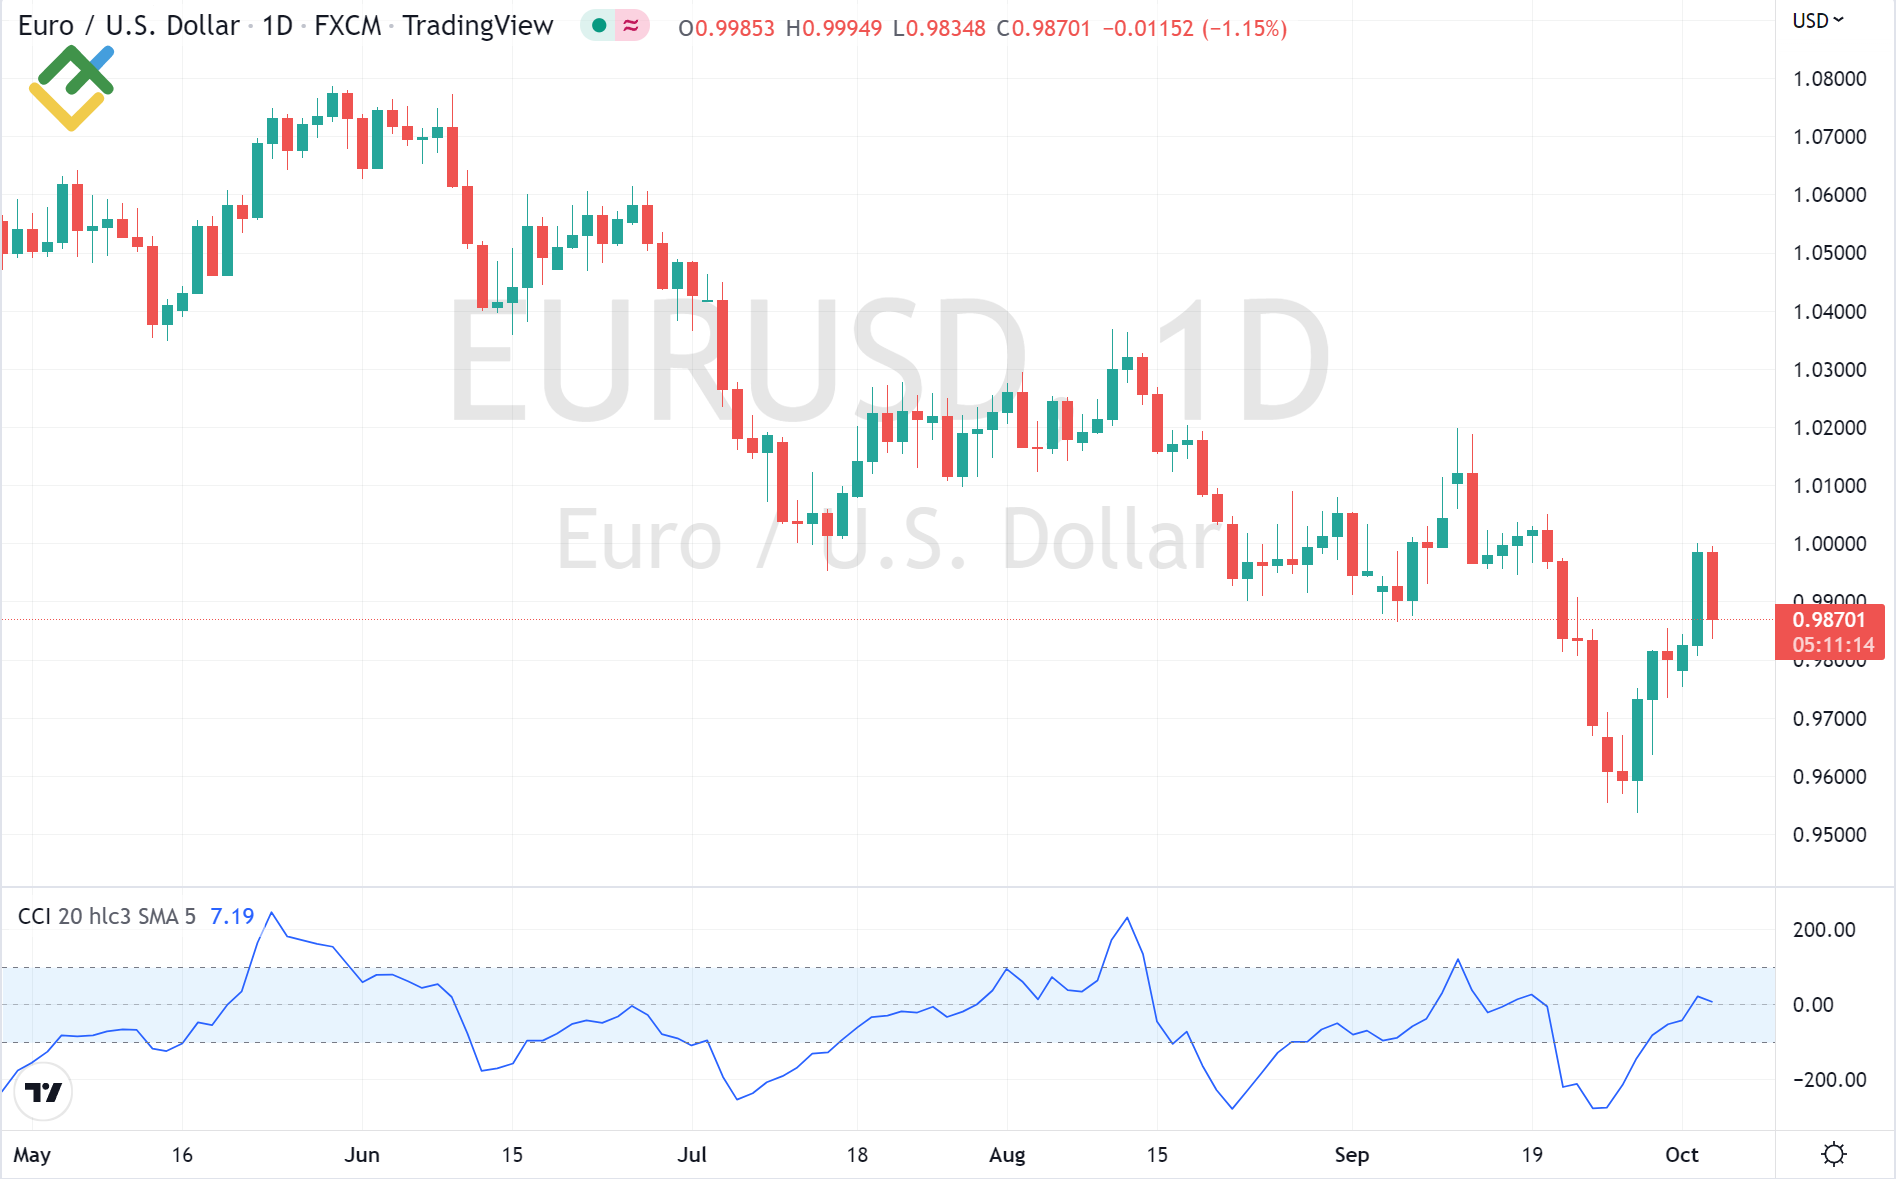
                  nechay dey gay chart signal trade kay downtrend mein hein jo keh EURUSD ka chart deya geya hey
                  blue vertical line en ke movement ko he neshan zad kar sakte hey jab CCI indicator 0 level ay nechay he cross kar sakta hey or trading end kay bad e kay signal ke confirmation ke ja sakte hein trading ko selling ke confirmation karni chihay
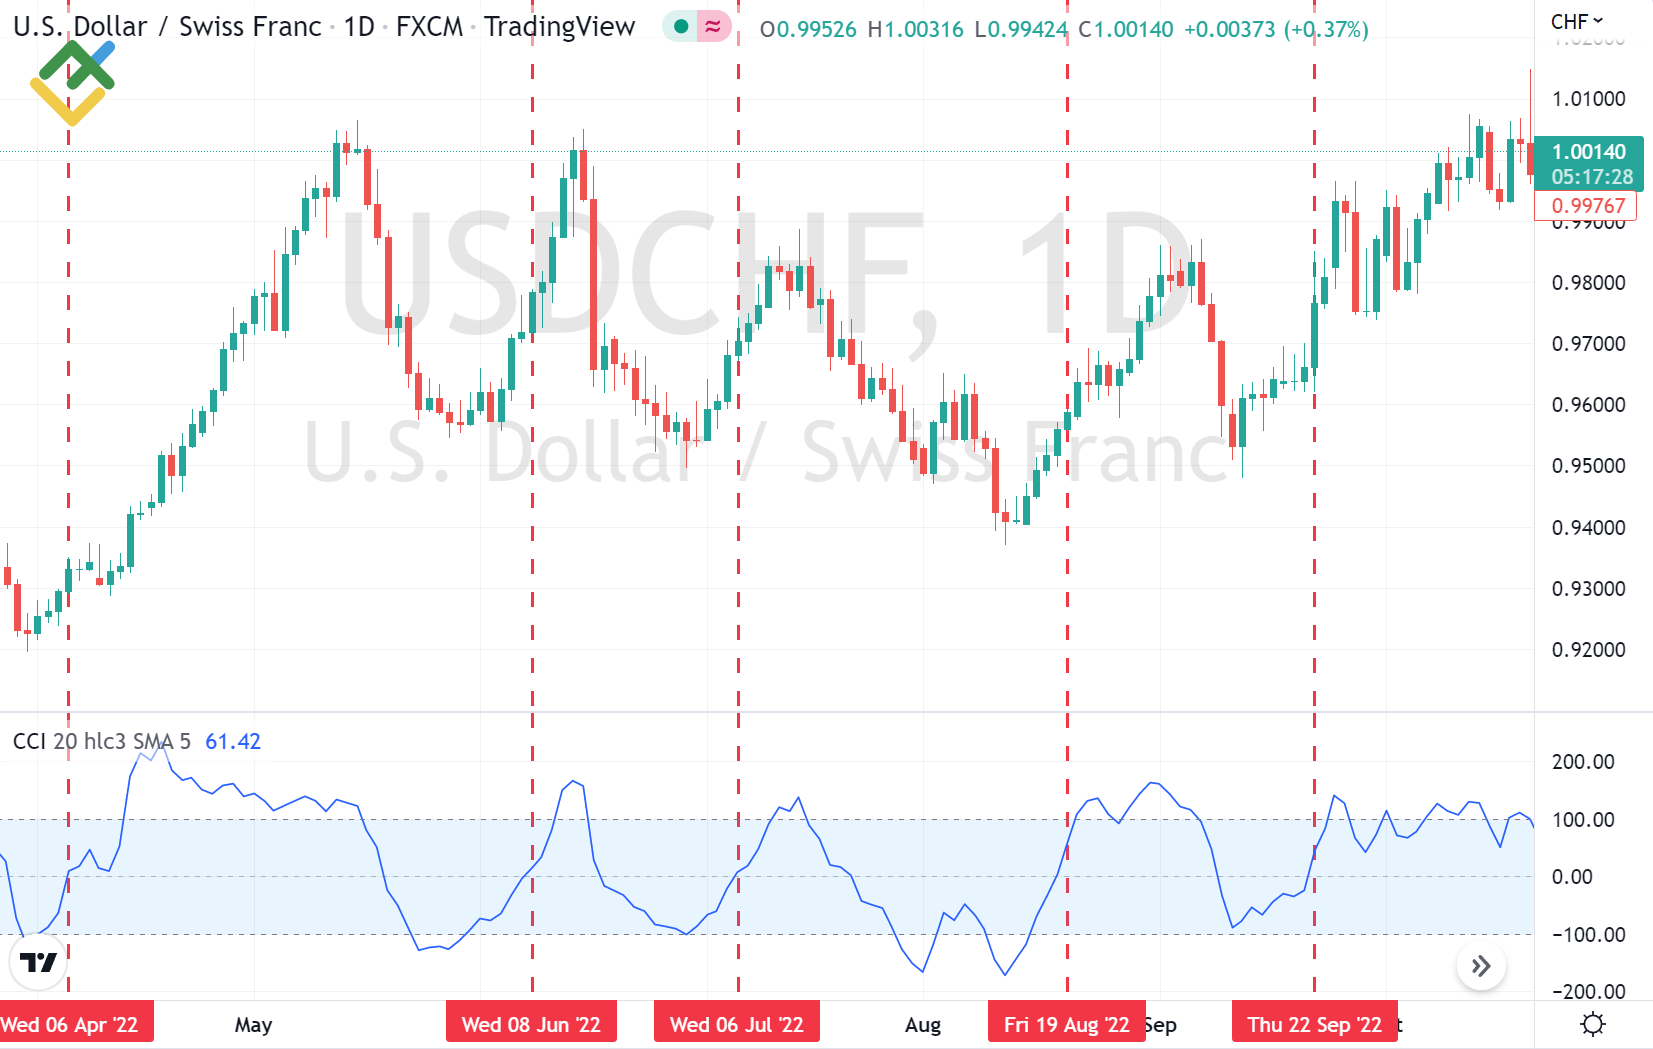
                  nechay dey gay chart mein vertical line draw ke ja sakte hey USDCHF up trend mein buy ka he eshara ho sakta hey


                  signal correction commodity channel index

                  koi bhe CCI indicator estamal kartay hovay trend ka he competition kar saktay hein jab indicator line aam market ke hallat say agay nekal jate hey 100+ level say oper or 100- level say nechay 200+ or 200- kay bad behtareen signal frahm kar saktay hein
                  bohut say trader trend kay opposite trade karnay kay ley 100+ or 100- ka he hawalla day saktay hein phir bhe strong level 200- or 200+ k he level he ho sakte hein market mein 100 say mazeed signal bhe ho saktay hein or dosree market kay competition mein otar charhao he zyada ho sakta hey
                  sahi position ke opening kay ley ap ko phlay say CCI level k strong level say agay ja saktay hein or bad mein en ka wapes jana chihay a jare trend kay sath he position ko open kar saktay hein
                   
                  bhali kay badlay bhali
                  • #10 Collapse

                    Commodity channel index

                    forex market mein commodity channel index aik kesam ka technical indicator hota hey or yeh zyada tar time indicator ka chart
                    neutral zone mein he enter ho jata hey jes ke wajah say market nesbatan sakon mein hote hey yeh tools forex market ke price e raftar ko he identify kar sakte hein naiz yeh keh CCI ke madad say aik trader keh market kab zyada overbought karay ge or kab zyada oversold karay ge es tarah tred ke thakan or market kay reversal janay eslah ke paishan goi ke ja sakte hey

                    forex market mein index aik curve ke tarah he lagta hey jo keh 0 say oper ya nechay jata hey 100+ or 200+ or 100- or 200- ke level bhe hote hein en ka estamal price ke raftar kay sath sath market ke overbought ya oversold hallat ke bhe paish goi kar sakte hey
                    CCI trading ke amome asolon kay sath he hote hey forex market mein aik trend mein trade karnay kay asol he hotay hein or trading kay ley aik eslah hote hey
                    strong up trend mein CCI ke trading strategy he hote hey ap ko indicator 0 line ko break kar kay reversal trade mein enter ho sakta hey jab ap down trend mein trade kar rahay hon to market reversal bhe ja sakte hey jab tak aik indicator 0 line ko break na he kar day or sell trade mein enter ho sakta hey

                    Commodity Channel Index signal

                    trend trading kay ley CCI signal ko he zahair kar sakta hey yeh es time zahair jab CCI 0 line kay signal ko he cross kar sakte hey
                    nechay dey gay chart signal trade kay downtrend mein hein jo keh EURUSD ka chart deya geya hey
                    blue vertical line en ke movement ko he neshan zad kar sakte hey jab CCI indicator 0 level ay nechay he cross kar sakta hey or trading end kay bad e kay signal ke confirmation ke ja sakte hein trading ko selling ke confirmation karni chihay
                    nechay dey gay chart mein vertical line draw ke ja sakte hey USDCHF up trend mein buy ka he eshara ho sakta hey


                    signal correction commodity channel index

                    koi bhe CCI indicator estamal kartay hovay trend ka he competition kar saktay hein jab indicator line aam market ke hallat say agay nekal jate hey 100+ level say oper or 100- level say nechay 200+ or 200- kay bad behtareen signal frahm kar saktay hein
                    bohut say trader trend kay opposite trade karnay kay ley 100+ or 100- ka he hawalla day saktay hein phir bhe strong level 200- or 200+ k he level he ho sakte hein market mein 100 say mazeed signal bhe ho saktay hein or dosree market kay competition mein otar charhao he zyada ho sakta hey
                    sahi position ke opening kay ley ap ko phlay say CCI level k strong level say agay ja saktay hein or bad mein en ka wapes jana chihay a jare trend kay sath he position ko open kar saktay hein
                     
                    bhali kay badlay bhali
                    • <a href="https://www.instaforex.org/ru/?x=ruforum">InstaForex</a>
                    • #11 Collapse

                      Commodity Channel Index (CCI) Indicator Trading Strategy

                      Commodity Channel Index (CCI) ek mashhoor aur powerful technical indicator hai jo traders ko financial markets mein price trends aur momentum samajhne mein madad deta hai. Is article mein hum CCI indicator ki trading strategy ko discuss karenge aur seekhenge k kaise is tool ka behtareen istemal karte hue profit generate kiya ja sakta hai.
                      1. CCI Indicator Kya Hai?


                      CCI ka matlab hai Commodity Channel Index, jo 1980 mein Donald Lambert ne develop kiya tha. Pehlay ye indicator sirf commodity markets ke liye design kiya gaya tha, lekin ab ye forex, stocks aur cryptocurrencies mein bhi use hota hai.

                      CCI ek oscillator hai jo kisi bhi asset ki current price ko uski average price ke sath compare karta hai. Ye indicator ki range -100 se +100 hoti hai, lekin kabhi kabhi ye is range se bahar bhi ja sakta hai. Jab CCI positive (+100 se upar) ho, to price overbought (zyada kharidari) zone mein hoti hai, aur jab negative (-100 se neeche) ho, to price oversold (zyada bikri) zone mein hoti hai.
                      2. CCI Indicator Ka Calculation Formula


                      CCI ka calculation formula kuch is tarah se hota hai:

                      CCI = (Typical Price - Moving Average) / (0.015 × Mean Deviation)
                      • Typical Price: (High + Low + Close) / 3
                      • Moving Average: Typical Price ka SMA (Simple Moving Average)
                      • Mean Deviation: Typical Price aur Moving Average ka difference

                      Is formula ka purpose price ka deviation measure karna hai, jo CCI ko ek accurate momentum indicator banata hai.
                      3. CCI Indicator Ka Kaise Istemaal Karein?


                      CCI indicator ka istemal karte hue traders kai strategies apna sakte hain, lekin sabse zyada common approaches trend following aur reversal trading hain. Dono methods ka brief overview niche diya gaya hai:
                      Trend Following Strategy
                      • Jab CCI +100 se upar ho, to ye signal hota hai ke price ek strong bullish trend mein hai.
                      • Is waqt, traders buy positions open karte hain aur profit tab tak hold karte hain jab tak CCI wapis +100 se neeche na aa jaye.
                      • Jab CCI -100 se neeche ho, to bearish trend ka signal milta hai. Is case mein, traders sell positions open karte hain.
                      Reversal Trading Strategy
                      • Jab CCI overbought zone (+200 ya usse upar) mein ho, to price ka reversal hone ka chance hota hai. Is waqt traders sell signal ka intezar karte hain.
                      • Similarly, jab CCI oversold zone (-200 ya neeche) mein ho, to price bounce back kar sakti hai. Traders buy karte hain jab CCI upward momentum dikhata hai.
                      4. CCI Signal Strength Ka Analysis


                      CCI indicator ke signal ko understand karna aur uski strength ka analysis karna zaroori hai. Har signal reliable nahi hota, is liye kuch confirmation tools ka use karna chahiye, jaise:
                      • Support aur Resistance Levels: CCI ke sath important price levels ka analysis karein taake signals ka reliability check ho sake.
                      • Volume Indicators: Jab CCI ka signal high volume ke sath aata hai, to wo zyada reliable hota hai.
                      • Divergence: Agar price aur CCI indicator opposite directions mein move kar rahe hon, to ye ek strong reversal signal hota hai.
                      5. CCI Strategy Ko Improve Karne Ke Tips


                      CCI trading strategy ko effective banane ke liye kuch important tips follow karna zaroori hai:
                      A. Timeframes Ka Selection
                      • Short-term trading ke liye small timeframes (e.g., 5-min ya 15-min charts) use karein.
                      • Long-term investors ke liye daily aur weekly charts behtareen hain.
                      B. Stop Loss Aur Take Profit Levels Set Karein
                      • Har trade ke liye stop-loss set karna zaroori hai taake unexpected losses ko control kiya ja sake.
                      • Take-profit levels set karke apne targets ko timely achieve karein.
                      C. Indicator Combination Use Karein


                      CCI ke sath doosre indicators jaise RSI (Relative Strength Index) aur MACD (Moving Average Convergence Divergence) ka istemal karen taake signals ki accuracy barh sake.
                      D. Backtesting Aur Practice


                      CCI strategy ko backtest karein aur demo account par practice karein. Isse real market conditions ko samajhne aur strategy ke flaws ko theek karne ka mauka milta hai.
                      6. CCI Trading Strategy Ke Fayde Aur Nuqsanat

                      Fayde
                      1. Trend aur Momentum Ki Pehchan: CCI indicator traders ko market ki current direction aur momentum samajhne mein madad deta hai.
                      2. Versatility: Ye tool har market (forex, stocks, commodities) mein kaam karta hai.
                      3. Simple Signals: Iska interpretation simple aur user-friendly hai.
                      Nuqsanat
                      1. False Signals: High volatility market mein CCI kabhi kabhi false signals generate karta hai.
                      2. Lagging Nature: Ye indicator thoda late react karta hai, jo early entry aur exit ko mushkil bana sakta hai.
                      3. Over-Reliance: Agar CCI ko akela use kiya jaye, to signals unreliable ho sakte hain.
                      Conclusion


                      Commodity Channel Index (CCI) ek powerful aur versatile trading tool hai, lekin iska behtareen istemal tabhi hota hai jab isko doosre indicators aur risk management techniques ke sath combine kiya jaye. CCI strategy ko samajhne aur use karne ke liye practice aur patience ki zarurat hoti hai. Har trader apne trading style aur goals ke mutabiq CCI strategy ko customize kar sakta hai.

                      Hamari trading journey mein discipline aur risk management sabse zyada ahmiyat rakhte hain. Is liye, CCI ka istemal karte waqt apne trading plan ko zaroor follow karein aur hamesha market ki dynamics par nazar rakhein.
                       

                      اب آن لائن

                      Working...
                      X