Bearish Flag Pattern Kya Hai.
Introduction.
Bearish flag pattern aik technical analysis ka tool hai jo market mein girawat ko predict karne ke liye istemal hota hai. Yeh pattern aksar downtrend ke doran dekha jata hai aur yeh batata hai ke market abhi aur neeche ja sakta hai. Is pattern ka nam "flag" isliye rakha gaya hai kyunki yeh ek flag ya parcham ki shakal banata hai.

Pattern Ki Pehchaan.
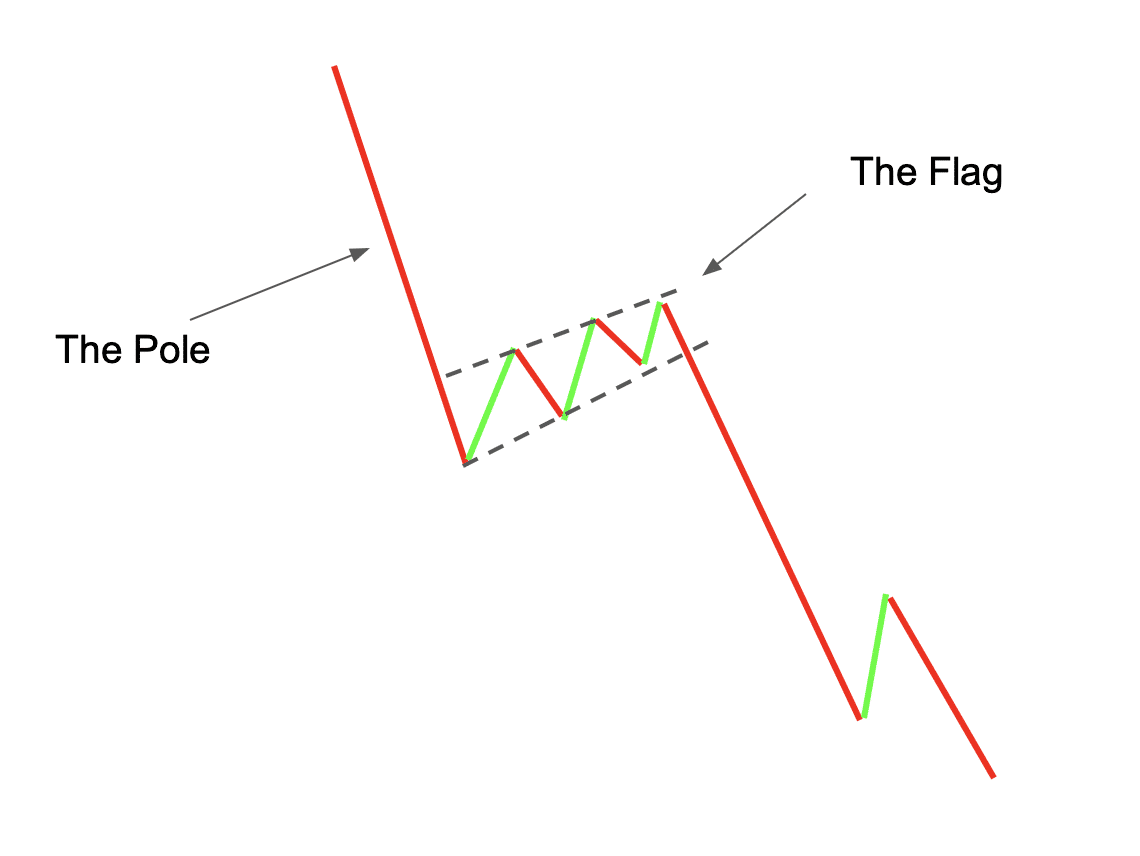
1. Strong Downtrend: Sab se pehle, aik strong downtrend hota hai jo flagpole create karta hai. Yeh woh period hai jab market aggressively neeche ja raha hota hai.
2. Consolidation Phase: Iske baad, market temporarily ruk jata hai aur sideways ya slightly upward move karta hai. Yeh phase flag ke fabric jesa hota hai. Is phase ko consolidation phase kehte hain.
3. Breakout: Jab yeh consolidation phase khatam hota hai, market phir se neeche move karna shuru karta hai. Is movement ko breakout kehte hain. Breakout hote hi price neechay girna shuru ho jati hai, aur yeh indicate karta hai ke downtrend continue hone wala hai.
Formation of Bearish Flag.
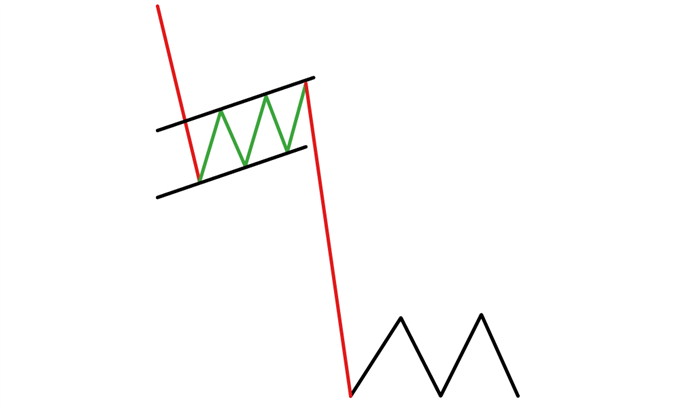
Bearish flag pattern kuch is tarah se form hota hai.

Example of Bearish Flag Pattern.
Misaal ke taur par, agar kisi stock ka price $100 se $70 par aata hai aur phir kuch din ke liye $70 se $75 ke range mein trade karta hai, yeh flag banata hai. Jab price $70 ke neeche girti hai, yeh breakout hota hai aur bearish flag pattern confirm hota hai.
Importance of Volume.
Volume bhi bearish flag pattern ko confirm karne mein madadgar hoti hai. Initial downtrend ke doran volume high hoti hai jo selling pressure ko dikhati hai. Consolidation phase ke doran volume kam hoti hai. Jab breakout hota hai, phir se volume badh jati hai jo is pattern ki authenticity ko confirm karti hai.
Strategies for Trading.
Bearish flag pattern ko dekh kar traders aksar yeh strategies adopt karte hain.
Yeh pattern market ki technical analysis mein aik valuable asset hai jo short-term trading aur long-term investment strategies mein equally useful hai.
Introduction.
Bearish flag pattern aik technical analysis ka tool hai jo market mein girawat ko predict karne ke liye istemal hota hai. Yeh pattern aksar downtrend ke doran dekha jata hai aur yeh batata hai ke market abhi aur neeche ja sakta hai. Is pattern ka nam "flag" isliye rakha gaya hai kyunki yeh ek flag ya parcham ki shakal banata hai.
Pattern Ki Pehchaan.
1. Strong Downtrend: Sab se pehle, aik strong downtrend hota hai jo flagpole create karta hai. Yeh woh period hai jab market aggressively neeche ja raha hota hai.
2. Consolidation Phase: Iske baad, market temporarily ruk jata hai aur sideways ya slightly upward move karta hai. Yeh phase flag ke fabric jesa hota hai. Is phase ko consolidation phase kehte hain.
3. Breakout: Jab yeh consolidation phase khatam hota hai, market phir se neeche move karna shuru karta hai. Is movement ko breakout kehte hain. Breakout hote hi price neechay girna shuru ho jati hai, aur yeh indicate karta hai ke downtrend continue hone wala hai.
Formation of Bearish Flag.
Bearish flag pattern kuch is tarah se form hota hai.
- Flagpole: Yeh wo vertical downtrend hai jo strong selling pressure ko dikhata hai.
- Flag: Yeh wo horizontal ya slightly upward moving channel hai jo price ko temporarily stabilize karti hai.
- Breakout: Yeh phase woh hai jab price is channel ko torh kar neeche girti hai, jo ek naye downtrend ka aghaz hota hai.
Example of Bearish Flag Pattern.
Misaal ke taur par, agar kisi stock ka price $100 se $70 par aata hai aur phir kuch din ke liye $70 se $75 ke range mein trade karta hai, yeh flag banata hai. Jab price $70 ke neeche girti hai, yeh breakout hota hai aur bearish flag pattern confirm hota hai.
Importance of Volume.
Volume bhi bearish flag pattern ko confirm karne mein madadgar hoti hai. Initial downtrend ke doran volume high hoti hai jo selling pressure ko dikhati hai. Consolidation phase ke doran volume kam hoti hai. Jab breakout hota hai, phir se volume badh jati hai jo is pattern ki authenticity ko confirm karti hai.
Strategies for Trading.
Bearish flag pattern ko dekh kar traders aksar yeh strategies adopt karte hain.
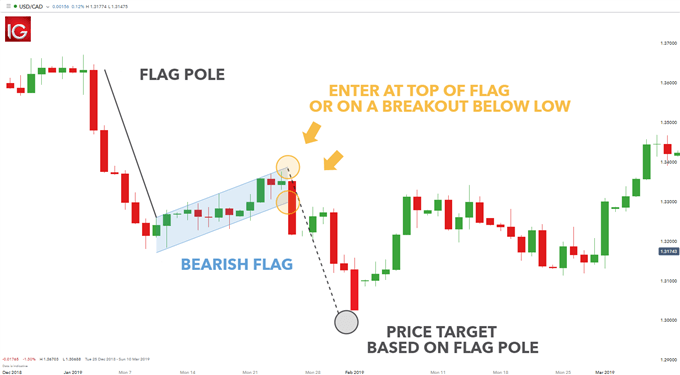
- Short Selling: Jab breakout confirm hota hai, traders short selling karte hain taake wo girte huye market se profit kama saken.
- Stop-Loss Placement: Is pattern ke torh kar neeche girne par, stop-loss orders ko flag ke upar set kiya jata hai taake risk management ho sake.
- Target Price: Target price ko measure karne ke liye flagpole ke length ko dekha jata hai aur usko breakout point se neeche calculate kiya jata hai.
Yeh pattern market ki technical analysis mein aik valuable asset hai jo short-term trading aur long-term investment strategies mein equally useful hai.


تبصرہ
Расширенный режим Обычный режим