Net Volume Indicator" on Forex.
X
  • وقت
  • دکھائیں
Clear All
new posts
  • #1 Collapse

    Net Volume Indicator" on Forex.
    Net Volume Indicator.

    Net Volume Indicator ka Introduction.

    Net Volume Indicator ek technical analysis tool hai jo forex market mein volume aur price movement ka rishta dekhta hai. Ye indicator traders ko yeh samajhne mein madad karta hai ke market ka trend kis direction mein ja raha hai aur is mein kitni strength hai.

    Volume ka Concept.

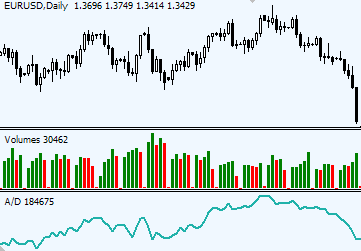
    Forex market mein volume ka matlab hai ke kitne units (lots) trade ho rahe hain ek specific period mein. Jab volume zyada hota hai, toh iska matlab hai ke zyada interest hai us currency pair mein. Volume kam hone ka matlab hai ke kam interest hai.

    Click image for larger version

Name:	volume.png
Views:	24
Size:	3.5 کلوبائٹ
ID:	13031336

    Net Volume Calculation.

    Net Volume Indicator ko calculate karne ke liye, pehle hamein har bar ka volume dekhna padta hai.
    • Agar closing price previous closing price se zyada ho, toh volume positive hota hai.
    • Agar closing price previous closing price se kam ho, toh volume negative hota hai.

    Net Volume ko calculate karne ke liye, hum positive aur negative volumes ko net karte hain.

    Net Volume=Positive Volume−Negative Volume\text{Net Volume} = \text{Positive Volume} - \text{Negative Volume}Net Volume=Positive Volume−Negative Volume

    Indicator ka Kaam.

    Net Volume Indicator yeh dekhta hai ke price movement ke sath sath volume kaise change ho raha hai. Yeh trend confirmation aur reversal points dhoondhne mein madadgar hota hai.


    Trend Confirmation.

    Jab price aur Net Volume Indicator dono ek hi direction mein move karte hain, toh yeh trend confirmation hota hai. Yani agar price upward ja raha hai aur Net Volume bhi positive hai, toh yeh bullish trend ki confirmation hai. Aur agar price downward ja raha hai aur Net Volume negative hai, toh yeh bearish trend ki confirmation hai.

    Divergence.

    Divergence tab hoti hai jab price aur Net Volume Indicator different directions mein move karte hain. Agar price upward ja raha hai lekin Net Volume negative hai, toh yeh potential trend reversal ka sign hota hai. Similarly, agar price downward ja raha hai lekin Net Volume positive hai, toh yeh bhi trend reversal ka signal ho sakta hai.

    Click image for larger version

Name:	spike_vs_reversal.png
Views:	17
Size:	10.0 کلوبائٹ
ID:	13031337

    Trading Strategy.
    1. Trend Following: Net Volume Indicator ko use kar ke traders trend ki direction aur strength confirm kar sakte hain. Agar price aur Net Volume dono increase ho rahe hain, toh buying opportunities dekhi ja sakti hain. Aur agar price aur Net Volume dono decrease ho rahe hain, toh selling opportunities dekhi ja sakti hain.
    2. Trend Reversal: Divergence ka istemal kar ke traders trend reversal points identify kar sakte hain. Agar price aur Net Volume different directions mein move kar rahe hain, toh yeh trend ke reverse hone ka signal ho sakta hai. Is waqt traders apni positions adjust kar sakte hain ya nayi positions open kar sakte hain.

    Limitations.

    Har indicator ki tarah, Net Volume Indicator bhi apni limitations rakhta hai. Forex market mein exact volume data milna mushkil hota hai kyunki yeh centralized market nahi hai. Is liye kuch situations mein yeh indicator accurate signals nahi de sakta.
  • <a href="https://www.instaforex.org/ru/?x=ruforum">InstaForex</a>
  • #2 Collapse

    Net Volume Indicator Introduction:-

    Assalam o Alaikum Dear Friends and Fellows NVI, jo kay "Net Volume Indicator" ka short form hy, forex trading me ek technical indicator hy. Ye indicator traders ko market ke volume aur price movement ke beech ka connection batany me help karta hy. NVI, volume changes aur price trends ke correlation ko samajhny me help karta hy. Volume, forex market me price movement ke sath juda hua hy, isliye volume analysis trading ke liye bahot zaruri hy. - NVI volume aur price movement ke beech ke relationship ko samajhny me help karta hy, jisse traders ko sahi trading decisions lene me help milti hy.NVI, volume bars ko analyze kar ke market sentiment ko determine karta hy. - Jab price upar jaata hy aur volume bhi increase hota hy, tab NVI positive (upward) trend indicate karta hy. - Jab price neechy jata hy aur volume bhi kam hota hy, tab NVI negative (downward) trend indicate karta hy.

    Click image for larger version

Name:	1.jpg
Views:	20
Size:	16.3 کلوبائٹ
ID:	13031406
    How to use a Net Volume Work


    Dear Friends Traders jab taizi ke rujhan ki nishandahi karty hein ya jab woh mandi ke rujhan ki nishandahi karty hein to taweel safar se faida utha satke hein. aik misbet khalis hajam me taizi hy kyunkay market ke majmoi jazbaat ne asasa kharidne ki taraf rujhan kya hy. doosri taraf, aik manfi khalis hajam mandi ka shikaar hy kyunkay market ke majmoi jazbaat ka rujhan farokht ki taraf hy. aam tor par, khalis hajam rujhan ki simt se mumasil hona chahiye. agar qeemat aur hajam aik dosray ki pairwi nahi karty hein, to yeh is baat ki nishandahi kar sakta hy ke mustaqbil qareeb me rujhan badal jaye ga. khalis hajam ziyada paicheeda qisam ke isharay se mukhtalif hy kyunkay yeh sirf tijarat shuda asasa ke hajam ko samjhta hy. khalis hajam ki saada noiyat ka matlab yeh hy ke usay aam tor par rujhanaat ko parhnay ke liye takneeki tajzia ki deegar aqsam ke sath mil kar istemaal kya jata hy. misaal ke tor par, tajir khalis hajam ke rujhanaat ki raftaar par ziyada par aetmaad ho satke hein agar asasa ki muzahmat toot jaye ( jab taizi ho ) ya asasa ki himayat ki khilaaf warzi ho ( jab mandi ho )

    Calculation of Net Volume Indicator:

    Forex trading me, Net Volume Indicator (NVI) ek aham technical analysis tool hy jo volume changes ko price movements ke sath relate karta hy. Yeh indicator traders ko market ke trend aur sentiment ko samajhne me help deta hy. Aayiye, detail me dekhte hein ke Net Volume Indicator kaise calculate kiya jata hy.

    • #3 Collapse

      Forex Mein Net Volume Indicator Ki Tashreeh

      Taqreeban Har Trade Mein Net Volume Indicator Ki Ahmiyat

      Forex trading ka jo sab se bara makasad hota hai woh profit kamana hota hai. Is maqasad ko hasil karne ke liye traders mukhtalif strategies aur indicators ka istemal karte hain. Inhi indicators mein se ek aham indicator "Net Volume Indicator" hai. Aayiye, iski tafseel se samajhtay hain.
      Click image for larger version

Name:	images (76).png
Views:	15
Size:	17.2 کلوبائٹ
ID:	13031413

      Net Volume Indicator Kya Hai?

      Net Volume Indicator ek technical indicator hai jo kisi bhi asset ya currency pair ke volume ko analyse karta hai. Volume se murad hai kitna zyada trading activity ho rahi hai kisi specific time frame mein. Yeh indicator humein batata hai ke buyers aur sellers ka balance kya hai aur kis taraf zyada pressure hai.

      Net Volume Indicator Kaise Kaam Karta Hai?

      Net Volume Indicator ka formula simple hai. Yeh indicator volume ko positive aur negative segments mein divide karta hai. Jab market bullish hota hai aur prices upar jati hain, to yeh positive volume ko show karta hai. Aur jab market bearish hota hai aur prices niche girti hain, to yeh negative volume ko show karta hai. Is tara se, yeh indicator humein clear picture deta hai ke market mein kaun dominate kar raha hai – buyers ya sellers.

      Click image for larger version

Name:	images - 2024-07-07T050456.854.jpeg
Views:	13
Size:	50.4 کلوبائٹ
ID:	13031414
      Formula:

      Net Volume=Up Volume−Down Volume\text{Net Volume} = \text{Up Volume} - \text{Down Volume}Net Volume=Up Volume−Down Volume

      Net Volume Indicator Ka Use
      1. Trend Identification: Net Volume Indicator ka pehla aur sab se bara faida yeh hai ke yeh market trend ko identify karne mein madad karta hai. Jab indicator ki value positive hoti hai to iska matlab hai ke market bullish hai aur buyers dominate kar rahe hain. Aur jab indicator ki value negative hoti hai to iska matlab hai ke market bearish hai aur sellers dominate kar rahe hain.
      2. Volume Confirmation: Yeh indicator volume ko confirm karne ke liye bhi istemal hota hai. Agar price movement ke saath volume bhi increase ho rahi hai to iska matlab hai ke movement strong hai. Aur agar price movement ke saath volume decrease ho rahi hai to iska matlab hai ke movement weak hai aur reversal ka chance hai.
      3. Divergence: Net Volume Indicator ko divergence ko identify karne ke liye bhi istemal kiya ja sakta hai. Agar price new highs bana rahi hai lekin Net Volume Indicator uske saath nahi chal raha to iska matlab hai ke market mein weakness hai aur price gir sakti hai.

      Net Volume Indicator Ka Interpretation
      1. Positive Net Volume: Jab Net Volume Indicator ki value positive hoti hai to iska matlab hota hai ke buyers zyada hain aur market bullish hai. Yeh situation humein buying signal deti hai.
      2. Negative Net Volume: Jab Net Volume Indicator ki value negative hoti hai to iska matlab hota hai ke sellers zyada hain aur market bearish hai. Yeh situation humein selling signal deti hai.
      3. Zero Net Volume: Jab Net Volume Indicator ki value zero hoti hai to iska matlab hota hai ke buyers aur sellers ka balance hai aur market mein koi clear direction nahi hai.

      Example:

      Misal ke taur par, agar aap EUR/USD pair trade kar rahe hain aur aap dekhtay hain ke Net Volume Indicator ki value consistently positive hai, to aap yeh conclude kar sakte hain ke market bullish hai aur aapko buying opportunities dekhni chahiye. Aur agar Net Volume Indicator ki value consistently negative hai to aapko selling opportunities dekhni chahiye.

      Click image for larger version

Name:	images (77).png
Views:	13
Size:	9.8 کلوبائٹ
ID:	13031415
      Net Volume Indicator Ki Limitations

      Har indicator ki tarah, Net Volume Indicator ki bhi kuch limitations hain. Sab se pehli limitation yeh hai ke yeh indicator sirf volume ko measure karta hai aur price action ko nahi. Yeh indicator kisi bhi sudden market news ya events ko nahi samajh sakta jo price movement ko affect kar sakti hain.

      Dosri limitation yeh hai ke yeh indicator choti time frames pe zyada reliable nahi hota. Agar aap choti time frames pe trading kar rahe hain to aapko iske sath kisi aur indicator ka combination istemal karna chahiye.
      • #4 Collapse

        Forex Mein Net Volume Indicator:!:!:!

        Forex mein Net Volume Indicator aik technical indicator hai jo trading mein istemal hota hai taake traders ko market ki taqat aur mumkinah qeemat ki harkaton ke baare mein maloomat faraham ki ja sakein. Net Volume Indicator qeemat ke saath volume ko mila kar istemal karta hai taake yeh dekha ja sake ke kharidaroon ya farokht karne walon ki taqat zyada hai.


        Forex Mein Net Volume Indicator Ke Nukaat:!:!:!

        Net Volume Indicator ke baare mein kuch ahem nukat:
        1. Volume ka istemal: Yeh indicator trading volume ko analyze karta hai. Volume ka matlab hai ke kitni trades ek specific period mein hui hain.
        2. Net Volume Calculation: Net volume nikalne ke liye, positive volume (jab price increase hoti hai) aur negative volume (jab price decrease hoti hai) ko milaya jata hai. Positive aur negative volume ka difference net volume kehlata hai.
        3. Market Sentiment: Agar net volume positive ho, to yeh indicate karta hai ke market mein buying pressure zyada hai, aur agar negative ho, to selling pressure zyada hai.
        4. Trend Confirmation: Traders Net Volume Indicator ko istemal karte hain taake market trend ko confirm kar sakein. Agar price increase ho rahi ho aur net volume bhi positive ho, to yeh strong uptrend ko indicate karta hai. Isi tarah agar price decrease ho rahi ho aur net volume negative ho, to yeh strong downtrend ko indicate karta hai.

        Yeh indicator forex trading mein faidemand ho sakta hai, magar kisi bhi indicator ki tarah, isko bhi doosre indicators aur analysis ke sath mila kar istemal karna chahiye taake zyada accurate trading decisions liye ja sakein.
        • #5 Collapse

          • Forex Mein Net Volume Indicator:!:!:!

            Forex mein Net Volume Indicator aik technical indicator hai jo trading mein istemal hota hai taake traders ko market ki taqat aur mumkinah qeemat ki harkaton ke baare mein maloomat faraham ki ja sakein. Net Volume Indicator qeemat ke saath volume ko mila kar istemal karta hai taake yeh dekha ja sake ke kharidaroon ya farokht karne walon ki taqat zyada hai.


            Forex Mein Net Volume Indicator Ke Nukaat:!:!:!

            Net Volume Indicator ke baare mein kuch ahem nukat:
          • Volume ka istemal: Yeh indicator trading volume ko analyze karta hai. Volume ka matlab hai ke kitni trades ek specific period mein hui hain.
          • Net Volume Calculation: Net volume nikalne ke liye, positive volume (jab price increase hoti hai) aur negative volume (jab price decrease hoti hai) ko milaya jata hai. Positive aur negative volume ka difference net volume kehlata hai.
          • Market Sentiment: Agar net volume positive ho, to yeh indicate karta hai ke market mein buying pressure zyada hai, aur agar negative ho, to selling pressure zyada hai.
          • Trend Confirmation: Traders Net Volume Indicator ko istemal karte hain taake market trend ko confirm kar sakein. Agar price increase ho rahi ho aur net volume bhi positive ho, to yeh strong uptrend ko indicate karta hai. Isi tarah agar price decrease ho rahi ho aur net volume negative ho, to yeh strong downtrend ko indicate karta hai.
          • Yeh indicator forex trading mein faidemand ho sakta hai, magar kisi bhi indicator ki tarah, isko bhi doosre indicators aur analysis ke sath mila kar istemal karna chahiye taake zyada accurate trading decisions liye ja sakein.
          • #6 Collapse


            Lambi tafseel chahye Net Volume Indicator" on Fo

            The Net Volume Indicator (NVI) is a technical analysis tool used to assess the volume of trades in the Forex market. It's particularly useful for identifying trends and confirming price movements by focusing on the relationship between volume and price.
            Components of the Net Volume Indicator
            1. Volume: The amount of trading activity in a given period.
            2. Price: The currency pair's price at which trades are executed.
            3. Net Volume: The difference between the volume of buying and selling activity.
            Calculation of NVI


            The NVI is calculated based on the changes in volume. Here’s a simplified step-by-step approach:
            1. Determine Volume Change: Calculate the difference between the current period's volume and the previous period's volume.
            2. Determine Price Change: Calculate the percentage change in the currency pair's price.
            3. Calculate NVI:
              • If the current period's volume is less than the previous period's volume, NVI changes in accordance with the percentage change in price.
              • If the current period's volume is greater than or equal to the previous period's volume, NVI remains unchanged.

            The formula can be expressed as:

            NVI𝑡=NVI𝑡−1+(Δ𝑃𝑃𝑡−1×NVI𝑡−1)NVIt​=NVIt−1​+(Pt−1​ΔP​ ×NVIt−1​)
            • NVI𝑡NVIt​ = Net Volume Indicator at time 𝑡t
            • NVI𝑡−1NVIt−1​ = Net Volume Indicator at previous period 𝑡−1t−1
            • Δ𝑃ΔP = Change in price (current price - previous price)
            • 𝑃𝑡−1Pt−1​ = Previous period's price
            Interpretation of NVI
            1. Rising NVI: Indicates that more trading volume is coming in on up moves. It suggests a strengthening trend.
            2. Falling NVI: Indicates that more trading volume is coming in on down moves. It suggests a weakening trend.
            3. Divergence: When the NVI trend diverges from the price trend, it can signal potential reversals.
            Practical Application in Forex Trading
            1. Trend Confirmation: Traders use NVI to confirm the strength of a trend. A rising NVI in a bullish market confirms the uptrend, while a falling NVI in a bearish market confirms the downtrend.
            2. Divergence Signals: Traders look for divergences between the NVI and price. If the price is making new highs while the NVI is not, it may indicate a weakening trend.
            3. Entry and Exit Points: By analyzing the NVI in conjunction with other indicators, traders can identify potential entry and exit points in the market.
            Advantages and Limitations

            Advantages:
            • Trend Confirmation: Helps confirm the strength and sustainability of trends.
            • Volume Analysis: Provides insights into the underlying volume dynamics behind price movements.
            Limitations:
            • Lagging Indicator: Like many technical indicators, NVI can lag behind price movements.
            • False Signals: It can sometimes give false signals, especially in volatile or low-volume markets.
            Example Calculation


            Suppose we have the following data:
            • Previous NVI: 1000
            • Previous Price: 1.1500
            • Current Price: 1.1550
            • Previous Volume: 1200
            • Current Volume: 1100
            1. Calculate the percentage change in price: Δ𝑃=1.1550−1.1500=0.0050ΔP=1.1550−1.1500=0.0050 Percentage Change=(0.00501.1500)×100≈0.4348%Percentage Change=(1.15000.0050​)×100≈0.4348%
            2. Since the current volume (1100) is less than the previous volume (1200), we update the NVI: NVI𝑡=1000+(0.00501.1500×1000)NVIt​=1000+(1.15000.0 050​×1000) NVI𝑡≈1000+4.348≈1004.35NVIt​≈1000+4.348≈1004.35

            The updated NVI would be approximately 1004.35.

            Understanding and applying the Net Volume Indicator requires practice and should be used in combination with other technical analysis tools to make well-informed trading decisions.


            The Net Volume Indicator (NVI) is a valuable tool in technical analysis, particularly within the Forex market. Here’s a more detailed look at its components, calculation, interpretation, and practical applications:
            Components of the Net Volume Indicator
            1. Volume: The total number of units traded in a given period.
            2. Price: The market price at which the Forex pair is being traded.
            3. Net Volume: The net difference between buying and selling volumes.
            Calculation of NVI


            The NVI focuses on days when the volume decreases compared to the previous day. The rationale is that smart money (informed investors) typically trades on lower volume days, thus providing insights into market movements.
            Step-by-Step Calculation:
            1. Calculate Daily Volume Change: Determine if the current day’s volume is lower than the previous day’s volume.
            2. Determine Price Change: Calculate the percentage change in the Forex pair’s price from the previous day.
            3. Update NVI:
              • If the current day’s volume is less than the previous day’s, adjust the NVI by the percentage change in price.
              • If the current day’s volume is not less, the NVI remains unchanged.

            NVI𝑡=NVI𝑡−1+(Δ𝑃𝑃𝑡−1×NVI𝑡−1)NVIt​=NVIt−1​+(Pt−1​ΔP​ ×NVIt−1​)

            Where:
            • NVI𝑡NVIt​ is the NVI for the current period.
            • NVI𝑡−1NVIt−1​ is the NVI for the previous period.
            • Δ𝑃ΔP is the change in price (𝑃𝑡−𝑃𝑡−1Pt​−Pt−1​).
            • 𝑃𝑡−1Pt−1​ is the previous period’s price.
            Interpretation of NVI
            1. Rising NVI: Indicates more buying on low volume days, suggesting a bullish trend.
            2. Falling NVI: Indicates more selling on low volume days, suggesting a bearish trend.
            3. Divergence: A divergence between NVI and price movements may signal potential trend reversals.
            Practical Application in Forex Trading
            1. Trend Confirmation: Use NVI to confirm existing trends. A rising NVI in an uptrend or a falling NVI in a downtrend adds confidence to the trend’s strength.
            2. Divergence Analysis: Look for divergences between price and NVI to spot potential reversal points. For example, if the price makes higher highs while NVI makes lower highs, it might indicate a weakening uptrend.
            3. Entry and Exit Points: Combine NVI with other indicators (like moving averages or RSI) to refine entry and exit points for trades.
            Advantages and Limitations

            Advantages:
            • Trend Validation: Provides additional confirmation of trend strength based on volume changes.
            • Informed Trading: Helps identify where smart money is potentially entering or exiting the market.
            Limitations:
            • Lagging Indicator: Like most indicators, NVI can lag behind price action, making it less effective in real-time decision-making.
            • False Signals: In volatile or low-volume markets, NVI might give misleading signals.
            Example Calculation


            Suppose you have the following data:
            • Previous NVI: 1000
            • Previous Price: 1.1500
            • Current Price: 1.1550
            • Previous Volume: 1200
            • Current Volume: 1100
            1. Calculate Price Change: Δ𝑃=1.1550−1.1500=0.0050ΔP=1.1550−1.1500=0.0050 Percentage Change=(0.00501.1500)×100≈0.4348%Percentage Change=(1.15000.0050​)×100≈0.4348%
            2. Update NVI (since the current volume is less than the previous volume): NVI𝑡=1000+(0.00501.1500×1000)NVIt​=1000+(1.15000.0 050​×1000) NVI𝑡≈1000+4.348≈1004.35NVIt​≈1000+4.348≈1004.35

            The updated NVI is approximately 1004.35.

            Understanding and effectively applying the Net Volume Indicator involves continuous practice and should always be used in conjunction with other technical analysis tools to enhance trading decis

            • #7 Collapse

              • Forex Mein Net Volume Indicator:!:!:!

                Forex mein Net Volume Indicator aik technical indicator hai jo trading mein istemal hota hai taake traders ko market ki taqat aur mumkinah qeemat ki harkaton ke baare mein maloomat faraham ki ja sakein. Net Volume Indicator qeemat ke saath volume ko mila kar istemal karta hai taake yeh dekha ja sake ke kharidaroon ya farokht karne walon ki taqat zyada hai.

                ​​

                Forex Mein Net Volume Indicator Ke Nukaat:!:!:!

                Net Volume Indicator ke baare mein kuch ahem nukat:
              • Volume ka istemal: Yeh indicator trading volume ko analyze karta hai. Volume ka matlab hai ke kitni trades ek specific period mein hui hain.
              • Net Volume Calculation: Net volume nikalne ke liye, positive volume (jab price increase hoti hai) aur negative volume (jab price decrease hoti hai) ko milaya jata hai. Positive aur negative volume ka difference net volume kehlata hai.
              • Market Sentiment: Agar net volume positive ho, to yeh indicate karta hai ke market mein buying pressure zyada hai, aur agar negative ho, to selling pressure zyada hai.
              • Trend Confirmation: Traders Net Volume Indicator ko istemal karte hain taake market trend ko confirm kar sakein. Agar price increase ho rahi ho aur net volume bhi positive ho, to yeh strong uptrend ko indicate karta hai. Isi tarah agar price decrease ho rahi ho aur net volume negative ho, to yeh strong downtrend ko indicate karta hai.
              • Yeh indicator forex trading mein faidemand ho sakta hai, magar kisi bhi indicator ki tarah, isko bhi doosre indicators aur analysis ke sath mila kar istemal karna chahiye taake zyada accurate trading decisions liye ja sakein.
              • #8 Collapse


                Forex per Net Volume Indicator Ka taaruf


                Forex per Net Volume Indicator ka taaruf karta hai ki kitna volume market mein net buyers aur net sellers ke beech mein hai. Net volume indicator normal volume se alag hota hai kyunki wo buyers aur sellers ke transactions ka net effect dikhata hai. Is indicator se traders ko market sentiment aur price movement ka idea milta hai.


                Forex market mein Net Volume Indicator traders ko market mein volume ke flow ka ek deeper insight deta hai. Ye indicator buyers aur sellers ke transactions ka net effect dikhata hai, jisse market sentiment aur price movement ka analysis kiya ja sakta hai. Is indicator ki madad se traders volume patterns aur trend changes ko samajh sakte hain aur trading decisions better tarike se le sakte hain.


                Forex market mein Net Volume Indicator ka istemal karne se pehle, traders ko iske basic concepts ko samajhna zaroori hai. Net Volume Indicator market mein volume ke buyers aur sellers ke interactions ka net result deta hai. Iska calculation market orders ke basis par hota hai jo ki buy aur sell orders ko consider karta hai. Is indicator se traders market sentiment aur trend direction ka pata laga sakte hain.

                Net Volume Indicator ka use karne ke liye kuch important points hain:
                1. Calculation: Ye indicator buyers aur sellers ke transactions ka net effect calculate karta hai, jo ki overall volume trends ko highlight karta hai.
                2. Interpretation: Is indicator ke positive values indicate buying pressure aur negative values indicate selling pressure. Isse traders sentiment ke changes aur price movements ko analyze kar sakte hain.
                3. Usage: Net Volume Indicator ko dusre technical indicators ke saath combine karke use kiya ja sakta hai, jaise ki price action analysis ya trend following indicators ke saath.
                4. Risk Management: Is indicator ki madad se traders apne trading strategies ko refine kar sakte hain aur risk management ko improve kar sakte hain, kyunki volume patterns ko samajhne se trading opportunities aur risks ko better identify kiya ja sakta hai.

                Is tarah se, Net Volume Indicator Forex traders ke liye ek important tool hai jo market dynamics ko samajhne aur trading decisions ko improve karne mein madad karta hai.

                Forex per Net Volume Indicator Ki aqsam


                Forex market mein Net Volume Indicator ki kuch aam aqsam hain jo traders istemal karte hain:
                1. On-Balance Volume (OBV): OBV indicator market volume ko analyze karta hai, jahan par har ek trading session mein net volume ko add ya subtract kiya jata hai. Agar price upar ja raha hai aur OBV bhi upar ja raha hai, toh yeh bullish signal samjha jata hai.
                2. Accumulation/Distribution Line: Yeh indicator volume aur price ke relation ko measure karta hai. Agar price upar ja raha hai aur Accumulation/Distribution Line bhi upar ja raha hai, toh yeh buying pressure ko indicate karta hai.
                3. Chaikin Money Flow (CMF): CMF volume aur price ke bich ki flow ko measure karta hai. Yeh indicator on-balance volume (OBV) se inspire hua hai, lekin isme price ko bhi consider kiya jata hai.
                4. Volume-Weighted Average Price (VWAP): VWAP indicator average price calculate karta hai based on trading volume ek specific period ke liye. Yeh indicator institutional traders aur large orders ke analysis mein popular hai.
                5. Money Flow Index (MFI): MFI volume aur price ke relation ko use karta hai, jo ki oversold aur overbought conditions ko detect karne mein madad karta hai.

                In indicators ki madad se traders volume patterns, market sentiment aur price movements ka analysis karte hain aur trading decisions ko refine karte hain. Har ek indicator apne unique tareeke se volume ke aspects ko represent karta hai aur traders ko alag-alag trading situations mein madad deta hai.


                Forex market mein Net Volume Indicator ke aur bhi kuch aqsam hain jo traders istemal karte hain, jinmein se kuch mahatvapurn hain:
                1. Volume Oscillators: Ye indicators volume changes ko oscillate karte hain, jaise ki Chaikin Oscillator ya Volume Oscillator. In indicators ki madad se traders volume trends aur momentum ko samajh sakte hain.
                2. Volume Rate of Change (VROC): VROC indicator volume ki percentage change ko measure karta hai, jo ki price movement ke saath compare kiya jata hai. Isse traders short-term volume trends aur price movements ko analyze karte hain.
                3. Volume Moving Average (VMA): VMA indicator moving average ka istemal karta hai, lekin volume data par. Isse traders market mein volume ke trends aur changes ko smooth manner mein dekh sakte hain.
                4. Force Index: Force Index volume aur price ke bich ke relationship ko measure karta hai, jo ki short-term price movements ke liye useful hota hai. Is indicator mein volume ki strength aur price ka relation dekha jata hai.

                In indicators ka istemal karke traders volume data ko analyze karte hain aur market ke movement ke patterns ko samajhte hain. Har ek indicator apne unique tareeke se volume ke aspects ko highlight karta hai aur traders ko trading strategies ko develop karne mein madad deta hai. Jaise ki har technical indicator, Net Volume Indicators bhi market analysis ka ek important hissa hote hain jo traders ko market sentiment aur trend direction ko samajhne mein madad karte hain.


                Thanks


                • #9 Collapse

                  **Forex Par "Net Volume Indicator" Ka Istemal**
                  Forex trading mein "Net Volume Indicator" aik ahem tool hai jo traders ko market ki liquidity aur price movements ka ek deeper insight deta hai. Yeh indicator volume data par based hota hai jo keh buy aur sell orders ke net difference ko darshata hai. Isse traders ko market sentiment aur price trends ko samajhne mein madad milti hai.

                  **Kaise Kaam Karta Hai Net Volume Indicator?**

                  Net Volume Indicator asal mein ek cumulative indicator hai jo volume ke positive aur negative values ko combine karta hai. Yeh indicator typically histogram form mein hota hai jisme bars ki height volume ke net difference ko darshati hai. Agar net volume positive hai, to yeh indicate karta hai keh zyada buy orders hain compared to sell orders, aur agar negative hai, to yeh sell orders ki zyada raftar ko point out karta hai.

                  **Net Volume Indicator Ke Fayde**

                  1. **Market Sentiment Ka Pata:** Is indicator se traders ko market sentiment ka pata chalta hai. Agar net volume positive hai, to bullish sentiment hai, jabke negative net volume bearish sentiment indicate karta hai.

                  2. **Price Movements Ki Prediction:** Volume indicators, jaise keh net volume, price movements ko predict karne mein madad dete hain. High volume spikes ya changes price trends ki possibility ko highlight karte hain.

                  3. **Trading Decisions Mein Madad:** Traders is indicator ka istemal karke trading decisions ko refine karte hain. Volume ki analysis se entry aur exit points tayyar karne mein asani hoti hai.

                  **Conclusion**

                  "Net Volume Indicator" forex trading mein ek mukhtasar lekin powerful tool hai jo market ke dynamics ko samajhne mein aur trading strategies ko optimize karne mein madad deta hai. Iske istemal se traders apne analysis ko enhance kar sakte hain aur better trading decisions le sakte hain. Is liye har trader ko is indicator ke istemal ki samajh honi chahiye taki woh market ke movements ko sahi tarah se interpret kar sake aur profitable trades kar sake.
                  • #10 Collapse

                    **Forex Mein "Net Volume Indicator":**
                    Forex trading mein technical indicators ki upyogita ka ek ahem hissa hai aur "Net Volume Indicator" isme ek mahatvapurn sthan rakhta hai. Yeh indicator traders ko market sentiment aur price movements ko samajhne mein madad karta hai, jo ki trading decisions ke liye crucial hota hai.

                    **Net Volume Indicator Kya Hai?**

                    Net Volume Indicator market ke buying aur selling activity ko measure karta hai. Yeh volume data ka ek aggregation hai jo specific time period ke dauran accumulate hota hai. Is indicator mein buying volume aur selling volume ko compare kiya jata hai. Agar buying volume selling volume se zyada hai, toh net volume positive hoga aur yeh bullish sentiment indicate karega. Jabki agar selling volume buying volume se zyada hai, toh net volume negative hoga aur yeh bearish sentiment darshayega.

                    **Trading Strategy:**

                    Net Volume Indicator ko interpret karte hue traders market ke trend aur reversals ko predict karne ki koshish karte hain. Agar net volume positive hai aur price bhi upar ja rahi hai, toh yeh ek confirmation ho sakta hai ki uptrend jaari hai aur traders long positions consider kar sakte hain. Jabki agar net volume negative hai aur price bhi neeche ja rahi hai, toh yeh ek downtrend ke indication ho sakta hai aur traders short positions consider kar sakte hain.

                    **Technical Analysis Mein Istemal:**

                    Net Volume Indicator ko aam taur par price charts ke saath plot kiya jata hai. Isse traders volume trends aur market direction ke saath connect kar sakte hain. Yeh indicator dusre volume-based indicators ke saath bhi combine kiya ja sakta hai jaise ki Volume Oscillator ya Volume Weighted Average Price (VWAP) for further confirmation and analysis.

                    **Conclusion:**

                    Net Volume Indicator forex traders ke liye ek valuable tool hai jo unhe market ke undercurrents ko samajhne mein madad karta hai. Iske istemal se traders apne trading decisions ko validate kar sakte hain aur better market understanding develop kar sakte hain. Zaroori hai ki har ek indicator ki tarah, Net Volume Indicator ko bhi sahi tarike se interpret kiya jaye aur dusre technical aur fundamental factors ke saath consider kiya jaye trading strategy banate waqt.

                    **Agla Kadam:**

                    Agar aap ek forex trader hain ya trading skills ko improve karna chahte hain, toh Net Volume Indicator jaise technical tools ko samajhna aur effectively use karna zaroori hai. Practice aur experience ke saath, aap trading mein confidence build karke aur consistent profitability achieve kar sakte hain. Happy trading!
                    • #11 Collapse

                      Net Volume Indicator in Forex: Ek Mukhtasir Jaiza


                      Muqaddama

                      Forex trading mein volume indicators ka bohot ahmiyat hoti hai kyunki ye market ke movement aur trend ko samajhne mein madadgar hote hain. Net Volume Indicator (NVI) un indicators mein se ek hai jo volume changes aur price movements ke darmiyan relationship ko measure karta hai. Is article mein hum Net Volume Indicator ka briefly jaiza leingay aur iske istemaal ka tareeqa samjhenge.

                      Net Volume Indicator (NVI) Kya Hai?

                      Net Volume Indicator ek technical analysis tool hai jo price aur volume data ka istimaal karke market trends ko analyze karta hai. NVI ka main focus volume changes par hota hai aur ye market ke bullish ya bearish trends ko identify karne mein madadgar hota hai.

                      Net Volume Indicator Formula

                      Net Volume Indicator ko calculate karne ka formula kuch is tarah hai:

                      NVI=Previous NVI+(Current Volume−Previous VolumePrevious Volume)×Current NVI\text{NVI} = \text{Previous NVI} + \left( \frac{\text{Current Volume} - \text{Previous Volume}}{\text{Previous Volume}} \right) \times \text{Current NVI}NVI=Previous NVI+(Previous VolumeCurrent Volume−Previous Volume​)×Current NVI

                      Jahan:
                      • NVI: Net Volume Indicator
                      • Current Volume: Maujooda trading volume
                      • Previous Volume: Pechli trading volume
                      • Current NVI: Maujooda Net Volume Indicator value
                      • Previous NVI: Pechli Net Volume Indicator value

                      Net Volume Indicator Ka Istemaal
                      1. Trend Identification: NVI ko use karke aap market ke overall trend ko identify kar sakte hain. Agar NVI value increase ho rahi hai, toh ye indicate karta hai ke market bullish hai. Aur agar NVI value decrease ho rahi hai, toh market bearish ho sakta hai.
                      2. Volume Analysis: NVI volume changes ko analyze karne mein madad karta hai. Agar volume increase ho raha hai aur NVI bhi increase ho raha hai, toh ye strong bullish signal ho sakta hai. Aur agar volume decrease ho raha hai aur NVI bhi decrease ho raha hai, toh ye strong bearish signal ho sakta hai.
                      3. Divergence Detection: NVI aur price movements ke darmiyan divergence ko detect karne ke liye bhi use kiya jata hai. Agar price increasing ho magar NVI decreasing ho, toh ye potential trend reversal ka signal ho sakta hai.

                      Net Volume Indicator Ki Limitations
                      1. False Signals: Kabhi kabhi NVI false signals generate kar sakta hai, khas tor par choppy ya sideways markets mein.
                      2. Data Dependency: NVI volume data par heavily depend karta hai. Agar volume data accurate na ho toh NVI ki accuracy bhi compromise ho sakti hai.
                      3. Standalone Use: NVI ko akela use karna thoda risky ho sakta hai. Isko douseray indicators ke saath combine karna behtareen strategy hoti hai.

                      Conclusion

                      Net Volume Indicator ek valuable tool hai jo Forex trading mein market trends aur volume changes ko analyze karne mein madad karta hai. Is indicator ko sahi tarah se use karke aap apni trading strategies ko enhance kar sakte hain. Magar, isko akela rely nahi karna chahiye. Isko douseray indicators ke saath combine karke aap better trading decisions le sakte hain aur apni profitability ko increase kar sakte hain. Har trader ke liye zaroori hai ke wo NVI ke concept ko achi tarah samjhe aur practice ke zariye iski functionality ko improve kare.
                      • <a href="https://www.instaforex.org/ru/?x=ruforum">InstaForex</a>
                      • #12 Collapse

                        Introduction to Net Volume Indicator

                        Net Volume Indicator (NVI) aik technical analysis tool hai jo volume aur price movement ka comparison karta hai. Forex trading mein yeh indicator market trend ki strength aur direction ko identify karne ke liye use hota hai.

                        How Net Volume Indicator Works

                        NVI ka calculation simple hai. Yeh indicator rising aur falling volume ko differentiate karta hai aur unki cumulative impact ko track karta hai. Agar volume previous period se zyada ho, toh current period ka volume subtract hota hai. Agar volume kam ho, toh add hota hai.

                        Calculation Method
                        1. Initial Value: Pehla step hai initial NVI value ko set karna, jo mostly zero hoti hai.
                        2. Volume Increase: Agar current period ka volume previous period se zyada hai, toh current NVI value mein kuch nahi badalti.
                        3. Volume Decrease: Agar current period ka volume previous period se kam hai, toh current NVI value mein price change ko add karte hain.

                        Formula: NVI(𝑖)=NVI(𝑖−1)+Price Change(𝑖)NVI(i)=NVI(i−1)+Price Change(i)

                        Interpretation of Net Volume Indicator

                        NVI ka use karke traders ye samajh sakte hain ke low-volume days par price changes ka kya impact hai. Yeh indicator bullish aur bearish market trends ko identify karne mein madad karta hai:
                        1. Bullish Market: Agar NVI upar jata hai, aur price bhi increase hoti hai, toh yeh bullish market ko indicate karta hai.
                        2. Bearish Market: Agar NVI neeche jata hai, aur price bhi decrease hoti hai, toh yeh bearish market ko indicate karta hai.

                        Application in Forex Trading

                        Forex trading mein NVI ko use karne ke kai tareeqe hain:
                        1. Trend Confirmation: NVI ko price movements ke sath compare karke trends confirm kiye ja sakte hain.
                        2. Divergences: Price aur NVI ke beech divergences ko identify karke potential trend reversals ka pata lagaya ja sakta hai.
                        3. Entry and Exit Points: NVI ke signals ko use karke suitable entry aur exit points identify kiye ja sakte hain.

                        Advantages of Net Volume Indicator
                        1. Simplicity: NVI ka calculation aur interpretation simple hai.
                        2. Trend Identification: Yeh indicator effectively market trends ko identify karta hai.
                        3. Volume Analysis: NVI volume changes ko analyze karke market behavior ko samajhne mein madad karta hai.

                        Limitations of Net Volume Indicator
                        1. Lagging Indicator: NVI mostly lagging indicator hai, jo past data pe depend karta hai.
                        2. Volume Dependency: Forex market mein volume data har broker ke sath vary karta hai, jo NVI ke accuracy ko affect kar sakta hai.
                        3. Market Noise: Short-term fluctuations aur market noise ke wajah se misleading signals mil sakte hain.

                        Conclusion

                        Net Volume Indicator (NVI) forex trading mein ek valuable tool hai jo volume aur price movement ke beech relationship ko analyze karta hai. Isko use karke traders market trends, divergences, aur suitable entry/exit points identify kar sakte hain. Halanki, NVI ko dusre indicators aur analysis techniques ke sath combine karna chahiye taake zyada accurate aur reliable trading decisions liye ja sakein.......

                        اب آن لائن

                        Working...
                        X