Bullish Meeting Line Candlestick Pattern.
X
  • وقت
  • دکھائیں
Clear All
new posts
  • #1 Collapse

    Bullish Meeting Line Candlestick Pattern.
    Bullish Meeting Line Candlestick Pattern.

    Introduction.

    Bullish Meeting Line Candlestick Pattern aik technical analysis tool hai jo stock market mein bullish reversal ko indicate karta hai. Ye pattern do din ka hota hai aur is ka aksar matlub hota hai ke market downtrend se uptrend ki taraf janay wala hai.

    Definition.

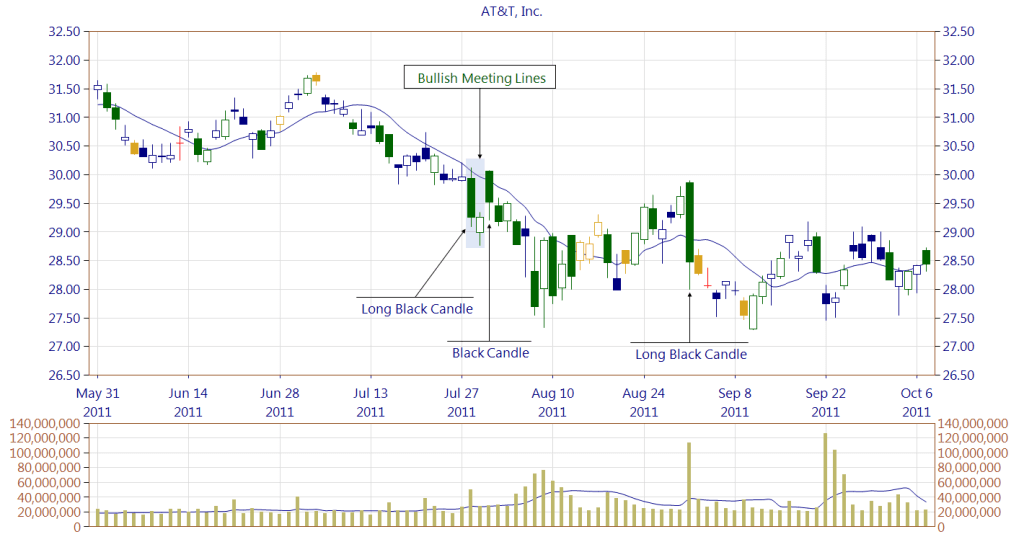
    Bullish Meeting Line Candlestick Pattern tab banta hai jab ek bearish (negative) candlestick ke baad ek bullish (positive) candlestick aati hai. Pehli candlestick market ka girawat dikhati hai aur dusri candlestick market ki wapas upar janay ki koshish dikhati hai. Ye pattern tab complete hota hai jab dusri candlestick pehli candlestick ke close ke barabar ya is ke qareeb close hoti hai.

    Click image for larger version

Name:	bullish-meeting-lines-candle.jpg
Views:	38
Size:	4.6 کلوبائٹ
ID:	13031257

    Structure of Bullish Meeting Line.
    • First Candlestick: Pehli candlestick bearish hoti hai jo ke market ki girawat ko dikhati hai. Is ka color aksar lal ya kala hota hai, jo negative trend ko show karta hai.
    • Second Candlestick: Dusri candlestick bullish hoti hai jo market ki taraf se recovery ko dikhati hai. Ye candlestick pehli candlestick ke close ke qareeb close hoti hai, lekin iska color sabz ya safed hota hai jo positive trend ko show karta hai.

    Significance.

    Ye pattern significant is liye hota hai kyun ke ye market ke sentiment mein tabdili ko dikhata hai. Jab dusri candlestick pehli candlestick ke close ke barabar close hoti hai, to ye batata hai ke buyers ne sellers ka pressure khatam kar diya hai aur ab market upar janay ke chances zyada hain.

    How to Identify.

    Bullish Meeting Line Candlestick Pattern ko identify karne ke liye aapko ye dekhna hoga.
    1. Downtrend: Pehle market mein downtrend hona chahiye.
    2. Bearish Candlestick: Pehli candlestick bearish honi chahiye.
    3. Bullish Candlestick: Dusri candlestick bullish honi chahiye jo pehli candlestick ke close ke qareeb close hoti hai.

    Click image for larger version

Name:	5xZk9qG.jpg
Views:	25
Size:	63.8 کلوبائٹ
ID:	13031258

    Example.

    Agar aik stock ka price pehle 100 rupees tha aur gir kar 90 rupees per agaya, aur agle din wapas barh kar 90 rupees per close hota hai, to ye Bullish Meeting Line Pattern ban sakta hai. Pehli din bearish candlestick banegi aur agle din bullish candlestick banegi jo pehli candlestick ke close ke barabar ya is ke qareeb close hogi.

    Trading Strategy.

    Bullish Meeting Line Pattern dekh kar traders aksar buy ka decision lete hain, kyun ke ye pattern indicate karta hai ke market ab upar ja sakti hai. Lekin, ye zaroori hai ke aap doosre technical indicators aur market conditions ka bhi analysis karen pehle ke koi final decision len.
  • <a href="https://www.instaforex.org/ru/?x=ruforum">InstaForex</a>
  • #2 Collapse

    Bullish Meeting Line Candlestick Pattern.


    Bullish Meeting Line Candlestick Pattern ek bullish reversal pattern hai jo downtrend ke dauran dekha jaata hai. Ye pattern do consecutive candlesticks se banta hai.

    1.Pehla Candle.

    Ek lambi bearish (red/black) candle hoti hai jo downtrend ko represent karti hai.

    2.Dusra Candle.

    Ek bullish (green/white) candle hoti hai jo pehle candle ke close ke barabar ya thoda sa neeche open hoti hai, lekin uska close pehle candle ke close ke barabar ya thoda sa upar hota hai.


    Ye pattern signal karta hai ke selling pressure kam ho raha hai aur buyers market mein wapas aa rahe hain, jo ek potential trend reversal ka indication hai.

    Agar aap ko aur detail chahiye ya koi specific example chahiye toh zaroor batayein.


    Click image for larger version

Name:	download (94).png
Views:	21
Size:	4.9 کلوبائٹ
ID:	13031298


    Bullish Meeting Line Candlestick Pattern ke istmal.


    Bullish Meeting Line Candlestick Pattern ka istemal karne ke liye kuch key points hain jo traders ko dhyan mein rakhne chahiye.


    1.Context ko Samajhna.


    Ye pattern tabhi reliable hota hai jab ye downtrend ke baad form ho. Agar ye sideways market ya uptrend ke dauran dekha jaye toh iska significance kam ho sakta hai.


    2.Confirmation ka Intazar.


    Jab pattern form hota hai, traders ko confirmation candle ka intazar karna chahiye. Confirmation tab milta hai jab agle ek ya do candles bhi bullish ho aur higher close dikhayein.


    3.Volume ka Dhyan Rakhna.


    High volume pe form hone wale patterns zyada reliable hote hain. Agar dusri bullish candle high volume ke saath close hoti hai, toh iska matlab hai ke buyers market mein strong hain.


    4.Support aur Resistance Levels.


    Ye pattern support levels ke aas paas form ho toh zyada strong mana jata hai. Traders ko dekhna chahiye ke kya pattern kisi significant support level ke paas form ho raha hai.


    5.Stop Loss aur Target Setting.


    Jaise hi pattern confirm ho jaye, traders apni position enter kar sakte hain. Stop loss pehli bearish candle ke low ke neeche set karna chahiye aur target previous resistance levels ya Fibonacci retracement levels pe set kiya ja sakta hai.


    6.Risk Management.


    Proper risk management techniques ka istemal karna zaroori hai. Position sizing aur risk-to-reward ratio ko dhyan mein rakhte hue trade lena chahiye.
    ​​​​

    Bullish Meeting Line Candlestick Pattern ke tips.

    Bullish Meeting Line Candlestick Pattern ko effectively use karne ke liye kuch tips hain jo aapke trading decision ko enhance kar sakti hain:


    1.Trend Identification.


    Ensure ke ye pattern downtrend ke baad hi form ho raha ho. Trend ko identify karna zaroori hai kyunki ye pattern reversal indicate karta hai.


    2.Volume Analysis.


    Pattern formation ke waqt volume ko observe karein. High volume ke saath pattern ka formation zyada reliable signal deta hai.


    3.Confirmation Candle.


    Pattern ke baad ek bullish candle ka close hona confirmation ke liye zaroori hai. Ye confirmation candle higher close aur preferably higher volume ke saath honi chahiye.


    4.Support Levels.


    Support levels par pattern ka formation strong indication hota hai. Agar pattern kisi significant support level pe form ho raha hai toh reversal ke chances zyada hote hain.


    5.Risk Management.


    Proper risk management strategies ka istemal karein. Stop loss pehli bearish candle ke low ke neeche set karein aur risk-to-reward ratio ko maintain karein.


    6.Multiple Timeframes.


    Higher timeframe charts pe pattern ka analysis karein. Higher timeframes pe patterns zyada reliable hote hain aur false signals kam milte hain.


    7.Combine with Other Indicators.


    Pattern ko doosre technical indicators ke saath combine karke use karein. Moving averages, RSI, MACD, etc. ka use karke pattern ki confirmation aur accuracy badha sakte hain.


    8.Stay Updated with News.


    Market news aur economic events ka dhyan rakhein kyunki ye price movements ko influence kar sakte hain. Koi major news event ke baad pattern form hota hai toh uska impact dekhna zaroori hai.


    9.Backtesting.


    Historical data pe pattern ka backtesting karein. Isse aapko pattern ki historical performance aur reliability ka idea milega.


    10.Avoid Overtrading.


    Har bullish meeting line pattern ko trade na karein. Sirf high probability setups pe focus karein aur overtrading se bachein.


    Click image for larger version

Name:	download (86).jpeg
Views:	33
Size:	13.0 کلوبائٹ
ID:	13031297


    Summary.


    Ye tips aapko Bullish Meeting Line Candlestick Pattern ko effectively use karne aur profitable trading decisions lene mein madad kar sakti hain.
    • #3 Collapse

      what is bullish meeting line pattern?

      forex market mein bullish meeting line candlestick pattern aik reversal candlestick pattern hota hey es kesam kay pattern mein pehle line aik black candlestick pattern hota hey jo keh forex market mein aik long line kay tor par he zahair hote hey dosree candlestick bhe aik long line kay tor par he nazar atte hey laken forex market mein candlestick ke body white rang ke hote hey dono candlestick aik he level pa close ho jate hein agerchay pattern ke shape simple hote hey lake yeh forex market mein bohut he kam dekhay dayta hey


      Importance of bullish meeting line candlestick pattern

      bullish meeting line candlestick pattern bullish piercing line candlestick pattern say melta julta pattern hota hey bullish meeting line candlestick pattern kay ley piercing ke pehle candlestick tak jana hota hey tahum bullish meeting line kay ley price ko phle candlestick ke body tak nahi pohnchaya ja sakta hey yeh forex market mein aik zyada kabel e aitmad trend reversal signal he day sakta hey forex market mein confirmation aik white candlestick say he ho sakte hey jes ka oper ke taraf gap ya close candlestick he ho sakte hey

      Understanding bullish meeting line candlestick pattern

      forex market mein bullish meeting line candlestick pattern 2 candlestick pattern hota hey es mein forex market ka down trend aik kesam kay reversal signal he day sakta hey laken forex market ke confirmation ke zaroorat hote hey jes kesam kay pattern mein probability kay chances zyada hotay hein on mein he movement kar jate hey
      market mein pehle candlestick bearish ke hote hey jo keh market average candlestick patter ke probability ko he inddicate kar sakte hy dosree candlestick pehle candlestick kay lower par he close ho jate hey
      Last edited by ; 06-07-2024, 10:43 PM.
      bhali kay badlay bhali
      • #4 Collapse

        Bullish Meeting Lines pattern aik candlestick pattern hai jo stock market aur forex trading mein use hota hai. Yeh pattern aksar market ke downtrend ya bearish trend ke baad dekha jata hai aur yeh signify karta hai ke market mein reversal ya trend ka badalna shuru ho sakta hai. Is pattern mein do candlesticks hoti hain; pehli bearish aur doosri bullish. Pehli candlestick ka closing price doosri candlestick ke opening price ke barabar hota hai ya uske qareeb hota hai.Bullish Meeting Lines pattern aik powerful reversal signal ho sakta hai agar sahi tareeqe se pehchana aur use kiya jaye. Yeh pattern market ke sentiment ko samajhne mein madad deta hai aur potential upward movement ka indication deta hai. Lekin hamesha yaad rakhein ke kisi bhi trading strategy ko use karte waqt proper research aur risk management zaroori hai taake profitable trading ki ja sake aur losses ko minimize kiya ja sakta hai.


        Click image for larger version

Name:	images (70).jpeg
Views:	21
Size:	71.7 کلوبائٹ
ID:	13031341


        Pattern ki Pehchan

        Is pattern ko pehchanne ke liye sabse pehle dekhna hota hai ke market downtrend mein hai. Pehli candlestick bearish hoti hai, jo yeh batati hai ke market abhi bhi neeche ja raha hai. Doosri candlestick bullish hoti hai aur iski closing price pehli candlestick ki closing price ke qareeb hoti hai. Yeh indicate karta hai ke sellers ka pressure kam ho raha hai aur buyers market mein interest le rahe hain.

        Psychology aur Market Sentiment

        Is pattern ke peechay psychology yeh hoti hai ke jab market neeche ja raha hota hai, to investors aur traders mein bearish sentiment hota hai. Lekin jab doosri bullish candlestick banti hai aur pehli candlestick ke closing price ke qareeb close karti hai, to yeh buyers ka interest aur confidence dikhata hai. Yeh market mein ek potential reversal ka signal hota hai jahan se market upward movement shuru kar sakta hai.

        Trading Strategy & Confirmation aur Indicators


        Bullish Meeting Lines pattern ko trading strategy mein istimaal karne ke liye traders aksar yeh karte hain ke jab yeh pattern form hota hai, to wo apni buy positions open karte hain. Entry point usually doosri candlestick ke close par ya uske baad hota hai. Stop loss placement ke liye traders aksar pehli candlestick ke low point ko use karte hain taake agar market reverse ho jaye to unka loss limited rahe. Profit target ke liye traders resistance levels ya recent highs ko dekhte hain.Trading decisions ko mazid mazboot banane ke liye traders dusre indicators ka bhi sahara lete hain jaise ke RSI (Relative Strength Index) aur MACD (Moving Average Convergence Divergence). Agar yeh indicators bhi bullish signal de rahe hon to Bullish Meeting Lines pattern ke signals ko mazid confirmation mil jati hai. Isse traders ke chances barh jate hain ke wo profitable trades kar sakein.

        Click image for larger version

Name:	images (71).jpeg
Views:	22
Size:	34.6 کلوبائٹ
ID:	13031340


        Risk management har trading strategy ka aham hissa hai. Bullish Meeting Lines pattern ke saath trading karte waqt bhi yeh zaroori hai ke traders apne risk ko manage karein. Isme position sizing, stop loss aur profit targets ka istimaal zaroori hota hai. Trading mein hamesha risk hota hai, lekin proper risk management se is risk ko minimize kiya ja sakta hai.
        • #5 Collapse

          ### Bullish Meeting Line Candlestick Pattern: Forex Trading Mein Ek Detailed Guide

          Forex trading aur stock market mein technical analysis bohot ahmiyat rakhta hai. Candlestick patterns, technical analysis ka ek ahem hissa hain jo traders ko market ke movements aur trends ko samajhne mein madadgar hote hain. Aaj hum ek aise unique aur powerful pattern ke baare mein baat karenge jo kai traders ke liye kaafi madadgar sabit hota hai - "Bullish Meeting Line Candlestick Pattern". Is post mein hum dekhenge ke Bullish Meeting Line Pattern kya hota hai, isse kaise identify kiya jata hai, aur is pattern ka trading mein kya significance hai.

          #### Bullish Meeting Line Candlestick Pattern Kya Hai?

          Bullish Meeting Line Candlestick Pattern ek bullish reversal pattern hai jo aksar downtrend ke baad form hota hai. Yeh pattern do candles par mushtamil hota hai:

          1. **Pehli Candle**: Yeh bearish (red) candle hoti hai jo downtrend ko represent karti hai.
          2. **Dusri Candle**: Yeh bullish (green) candle hoti hai jo pehli candle ke close ke barabar ya uske kareeb close hoti hai. Yeh bullish candle pehli bearish candle ke closing price ke aas-paas close hone se meeting line banata hai.

          Yeh pattern yeh signal deta hai ke market ne bottom touch kar liya hai aur ab uptrend shuru hone wala hai.

          #### Bullish Meeting Line Candlestick Pattern Ko Kaise Identify Kiya Jaye?

          Is pattern ko identify karne ke liye kuch khas cheezon ka dhyan rakhna hota hai:

          1. **Downtrend Ki Presence**: Bullish Meeting Line Pattern aksar downtrend ke baad form hota hai. To sabse pehle dekhna hoga ke market downtrend mein hai ya nahi.
          2. **Pehli Bearish Candle**: Pehli candle bearish (red) honi chahiye jo downtrend ko continue karti nazar aaye.
          3. **Dusri Bullish Candle**: Dusri candle bullish (green) honi chahiye jo pehli candle ke close ke barabar ya uske kareeb close ho.

          #### Bullish Meeting Line Candlestick Pattern Ka Forex Trading Mein Significance

          Bullish Meeting Line Candlestick Pattern ka forex trading mein kaafi significance hai. Is pattern ka sahi use karne se traders ko market ke potential reversals ko pehchanne mein madad milti hai. Kuch khas significance points kuch is tarah se hain:

          1. **Trend Reversal**: Bullish Meeting Line Pattern market ke trend reversal ko indicate karta hai. Downtrend ke baad yeh pattern form hota hai jo yeh show karta hai ke market ab uptrend ki taraf jaane wali hai.
          2. **Buyer Strength**: Yeh pattern buyers ki strength ko bhi reflect karta hai. Pehli bearish candle ke baad, bullish candle buyers ki strength ko show karti hai jo market ko upar le jaane ki koshish karte hain.
          3. **Support Level**: Bullish Meeting Line Pattern ek strong support level ko indicate karta hai jahan se market reversal kar sakti hai.

          #### Bullish Meeting Line Candlestick Pattern Ka Use

          Is pattern ko effectively use karne ke liye kuch important points ka khayal rakhna zaroori hai:

          1. **Confirmations**: Bullish Meeting Line Pattern ko doosre technical indicators ke sath combine karke use karein. Jaise ke RSI (Relative Strength Index), MACD (Moving Average Convergence Divergence), aur volume indicators, taake aapko ek confirm signal mil sake.
          2. **Proper Analysis**: Sirf ek pattern par depend na karein. Market ka proper analysis karein aur dekhein ke kya baki factors bhi reversal ko support karte hain.
          3. **Trading Plan**: Apna trading plan ready rakhein. Entry aur exit points define karein taake aap disciplined trading kar sakein.

          #### Bullish Meeting Line Candlestick Pattern Ka Faida

          Is pattern ka sabse bara faida yeh hai ke yeh market ke potential reversals ko pehchaanne mein madad karta hai. Is se traders ko market ke movements ko samajhne aur sahi waqt par trading decisions lene mein asani hoti hai. Yeh pattern short-term aur long-term dono traders ke liye faidemand hota hai.

          1. **High Reward-to-Risk Ratio**: Bullish Meeting Line Pattern high reward-to-risk ratio offer karta hai. Correctly identified pattern ka use karke, traders apne profits ko maximize kar sakte hain aur risk ko minimize.
          2. **Precise Entry and Exit Points**: Yeh pattern traders ko precise entry aur exit points provide karta hai. Fibonacci levels ka use karke, traders easily apne trades ko plan kar sakte hain.

          #### Conclusion

          Bullish Meeting Line Candlestick Pattern forex trading aur stock market mein ek powerful tool hai jo potential reversals ko predict karne mein madad karta hai. Is pattern ko sahi tareeke se use karke, traders apni trading strategies ko better bana sakte hain aur market ke movements ka faida utha sakte hain. Technical analysis ke is pattern ko apne trading toolkit mein shamil karke, aap apni trading journey ko successful bana sakte hain.

          Bullish Meeting Line Pattern ki understanding aur iske sahi istamal se, aap apni trading skills ko next level par le ja sakte hain aur consistent profits generate kar sakte hain.
           
          • #6 Collapse

            Bullish Meeting Line Candlestick Pattern: Forex Trading ka Ek Mahir Tool

            Forex trading mein candlestick patterns ki samajh bohot zaroori hai. In patterns mein se ek important pattern hai "Bullish Meeting Line". Is article mein hum is pattern ke baare mein detail se baat karenge.

            1. Introduction to Candlestick Patterns

            Forex trading mein candlestick patterns ka istemal price action ko analyze karne ke liye hota hai. Candlestick patterns market sentiment aur price movement ko interpret karne mein madadgar sabit ho sakte hain.

            2. What is the Bullish Meeting Line Pattern?

            Bullish Meeting Line ek bullish reversal pattern hai jo do consecutive candles se form hota hai. Yeh pattern bearish trend ke baad bullish trend ka indication deta hai.

            3. Components of Bullish Meeting Line Pattern

            Bullish Meeting Line pattern mein do main components hote hain:
            • Bearish Candle: Pehla candle bearish trend ko represent karta hai.
            • Bullish Candle: Dusra candle pehle candle ke neeche ek gap ke saath open hota hai aur bullish trend ko represent karta hai.

            4. Characteristics of Bullish Meeting Line

            Bullish Meeting Line pattern ki kuch key characteristics include:
            • Reversal Signal: Yeh pattern market ka reversal signal provide karta hai jab bearish trend se bullish trend mein change hota hai.
            • Gap Requirement: Pehle candle ke neeche ek gap hona zaroori hai jo doosre candle ke open se pehle ho.

            5. How to Identify Bullish Meeting Line

            Bullish Meeting Line pattern ko identify karne ke liye traders ko doosre candle ka open pehle candle ke close ke near dekhna hota hai. Iska matlab hai ki bullish candle bearish candle ke neeche open hona chahiye aur ideally pehle candle ke neeche ek gap hona chahiye.

            6. Psychological Interpretation

            Bullish Meeting Line pattern ka psychological interpretation yeh hai ki jab traders ko yeh pattern dekhne ko milta hai, toh unki confidence market mein bullish move hone ki taraf badhti hai. Yeh pattern market sentiment ko positive karta hai.

            7. Importance in Forex Trading

            Forex trading mein Bullish Meeting Line pattern ka istemal trend reversals ko identify karne aur entry points determine karne ke liye hota hai. Is pattern ki accuracy aur reliability traders ke liye kaafi crucial ho sakti hai.

            8. Bullish Meeting Line Strategy

            Bullish Meeting Line pattern ka trading strategy include karta hai:
            • Entry Point: Bullish candle ke close ke above entry point set kiya jata hai.
            • Stop Loss: Bearish candle ke low ke below stop loss set kiya jata hai.
            • Take Profit: Target ko set karte waqt recent highs ko consider kiya jata hai.

            9. Risk Management

            Har trade mein proper risk management zaroori hai. Bullish Meeting Line pattern ki trading mein stop loss ka placement crucial hota hai taki losses minimize kiye ja sakein.

            10. Example of Bullish Meeting Line in Real Market

            Real market mein Bullish Meeting Line pattern ka example dekh kar traders ko iska practical understanding hoti hai. Example ke through traders ko yeh samajhne mein madad milti hai ki kaise yeh pattern actual market conditions mein apply hota hai.

            11. How to Trade Using Bullish Meeting Line

            Bullish Meeting Line pattern ka istemal karne se pehle traders ko confirmation ka wait karna chahiye. Confirmation ke liye candle close ka wait kiya jata hai taki false signals se bacha ja sake.

            12. Timeframes Suitable for Bullish Meeting Line

            Bullish Meeting Line pattern alag-alag timeframes mein effective ho sakta hai, lekin generally higher timeframes jaise ki daily charts ya weekly charts preferred hote hain. Higher timeframes mein yeh pattern ki reliability zyada hoti hai.

            13. Limitations of Bullish Meeting Line

            Bullish Meeting Line pattern ki limitations bhi hain jo traders ko samajhna zaroori hai:
            • False Signals: Choppy markets mein ya market noise mein yeh pattern false signals generate kar sakta hai.
            • Confirmation Delay: Sometimes confirmation candle ke wait mein time lag ho sakta hai jisse ki entry point miss ho sakta hai.

            14. Combining with Other Indicators

            Bullish Meeting Line pattern ko confirm karne ke liye traders doosre technical indicators jaise ki moving averages, RSI (Relative Strength Index), ya MACD (Moving Average Convergence Divergence) ka istemal karte hain. Isse pattern ki accuracy improve hoti hai.

            15. Backtesting Bullish Meeting Line

            Bullish Meeting Line pattern ko test karne ke liye traders historical data par backtesting karte hain. Isse past performance ka analysis hota hai jo future predictions ke liye useful hota hai.

            16. Common Mistakes to Avoid

            Bullish Meeting Line pattern ki trading mein common mistakes include kar sakte hain:
            • Overtrading: Multiple signals par trade karne se bachein.
            • Ignoring Confirmation: Candle close ka confirmation ignore na karein.

            17. Conclusion on Bullish Meeting Line

            Bullish Meeting Line candlestick pattern ek powerful tool hai jo forex traders ke liye trend reversals ko identify karne mein madad karta hai. Is pattern ki proper understanding aur disciplined approach ke saath traders ko successful trading mein help milti hai.

            18. Learning and Practicing the Pattern

            Bullish Meeting Line pattern ko samajhne ke liye patience aur practice zaroori hai. Traders ko is pattern ko real market conditions mein apply karke experience gain karna chahiye.

            19. Final Thoughts

            Bullish Meeting Line pattern forex trading mein ek valuable tool hai jo traders ko market trends aur reversals ke understanding mein madad deta hai. Is pattern ko samajhne aur usko effectively use karne se traders apni trading strategies ko improve kar sakte hain aur consistent profits earn kar sakte hain.

            Is article se ummeed hai ki aapko Bullish Meeting Line candlestick pattern ke baare mein detailed understanding ho gayi hogi aur aap ise apne trading journey mein incorporate karke apni trading skills ko enhance kar payenge. Happy trading!
            • #7 Collapse

              Bullish Meeting Line Pattern In Forex

              Forex trading mein candlestick patterns bohat important hote hain, jo traders ko market ki direction aur potential reversals samajhne mein madad dete hain. In patterns mein se ek "Bullish Meeting Line" pattern hai, jo bullish reversal ka indicator hota hai.
              Click image for larger version

Name:	images (3).jpeg
Views:	18
Size:	17.4 کلوبائٹ
ID:	13033137
              Bullish Meeting Line Pattern Kya Hai?
              Bullish Meeting Line candlestick pattern do candlesticks ka combination hota hai jo downtrend ke baad appear hoti hain. Pehla candlestick bearish hota hai, jo market ke girawat ko dikhata hai, jabke doosra candlestick bullish hota hai, jo market mein reversal ka indication deta hai. Is pattern ki khas baat yeh hai ke doosra candlestick pehle candlestick ke close price ke barabar ya bohot qareeb close hota hai.
              Pehle candlestick ka body red ya black hota hai, jo market ke bearish trend ko indicate karta hai. Jabke doosra candlestick ka body green ya white hota hai, jo bullish sentiment ko dikhata hai. Yeh pattern tab aur zyada significant hota hai jab doosra candlestick pehle candlestick ke close price ke upar open ho aur high volume ke saath close ho. Iska matlab yeh hota hai ke buyers market mein enter ho chuke hain aur price ko upar push kar rahe hain.

              Pattern Ka Structure Aur Formation
              Bullish Meeting Line pattern do components par mabni hota hai.

              1. Bearish Candlestick
              Yeh pehla candlestick hota hai jo downtrend ka continuation show karta hai. Iska body lamba hota hai aur yeh lower close ko represent karta hai.

              2. Bullish Candlestick
              Doosra candlestick jo bullish nature ka hota hai. Yeh pehla candlestick ke close price ke qareeb ya barabar open hota hai aur high close ke saath end hota hai.
              Yeh pattern tab form hota hai jab market mein downtrend ho aur achanak se buyers enter ho kar price ko upper levels par le jayein. Yeh reversal ka strong signal hota hai aur trend ki direction mein tabdeeli ko indicate karta hai.

              Pattern Ki Importance Aur Interpretation
              Bullish Meeting Line candlestick pattern ki bohot zyada importance hai kyun ke yeh market ke sentiment ka strong indicator hota hai. Jab yeh pattern form hota hai, toh yeh is baat ka ishara hota hai ke sellers ab exhausted ho chuke hain aur buyers ne control apne haath mein le liya hai. Is pattern ko use karke traders potential reversal points identify kar sakte hain aur profitable trades execute kar sakte hain.
              Is pattern ko confirm karne ke liye kuch additional indicators ka use bhi kiya ja sakta hai jaise ke Relative Strength Index (RSI), Moving Averages, aur Volume Analysis. Yeh sab tools mil kar pattern ki validity ko aur zyada strengthen karte hain.

              Pattern Ki Practical Application
              Bullish Meeting Line pattern ko practically use karne ke liye kuch steps follow kiye ja sakte hain.
              1. Trend Analysis
              Pehle overall market trend ko analyze karein. Yeh pattern sirf downtrend ke baad hi significant hota hai.

              2. Pattern Identification
              Downtrend ke baad do consecutive candlesticks ko observe karein. Pehla candlestick bearish aur doosra bullish hona chahiye, jahan doosra candlestick pehle ke close price ke qareeb close hota hai.

              3. Volume Analysis
              Pattern ki confirmation ke liye volume ko check karein. Doosra candlestick high volume ke saath close hona chahiye.

              4. Entry and Exit Points
              Pattern ke confirm hone ke baad entry point identify karein. Best entry point doosra candlestick ke close hone par hota hai. Stop-loss pehla candlestick ke low ke neeche set karein aur profit target previous resistance levels par place karein.

              Note
              Forex trading mein Bullish Meeting Line candlestick pattern ek valuable tool hai jo traders ko market ke potential reversals ko identify karne mein madad deta hai. Yeh pattern do candlesticks ka combination hota hai jo downtrend ke baad bullish reversal ka strong signal hota hai. Is pattern ko effectively use karne ke liye trend analysis, pattern identification, volume analysis aur proper entry-exit points ka use zaroori hai.
              Yeh pattern traders ko market ke sentiment ko samajhne mein madad karta hai aur profitable trading opportunities provide karta hai. Agar traders is pattern ko sahi tareeqe se use karein aur additional indicators ke saath combine karein, toh yeh unke trading decisions ko aur zyada accurate aur profitable bana sakta hai. Forex trading mein candlestick patterns ka deep understanding hona bohot zaroori hai aur Bullish Meeting Line pattern unmein se ek hai jo market ke bullish reversal ka clear signal provide karta hai.
              • #8 Collapse

                ### Bullish Meeting Line Candlestick Pattern
                Bullish meeting line candlestick pattern forex trading mein ek bullish reversal pattern hai jo traders ko potential uptrend ke signals provide karta hai.

                **Bullish Meeting Line Pattern Ka Structure:**

                1. **Candlestick Shapes:**
                - Bullish meeting line pattern do consecutive candles se form hota hai:
                - Pehla candle bearish (red) hota hai jo market mein selling pressure ko indicate karta hai.
                - Dusra candle green (bullish) hota hai jo pehle candle ke neeche open hota hai lekin uske close ke near ya usse above close karta hai.

                2. **Location:**
                - Bullish meeting line pattern typically downtrend ke baad form hota hai aur significant support level ke near develop hota hai.

                3. **Psychology:**
                - Pehla bearish candle indicate karta hai ke selling pressure market mein dominant hai.
                - Dusra bullish candle show karta hai ke buyers ne control le liya hai aur price reversal ke possibilities hain.

                **Bullish Meeting Line Pattern Ka Trading Strategy:**

                1. **Identify the Pattern:**
                - Pehle traders ko bullish meeting line pattern correctly identify karna zaroori hai. Yeh pattern do consecutive candles se form hota hai jahan pehla candle bearish aur dusra candle bullish hota hai.

                2. **Confirmation:**
                - Pattern ko confirm karne ke liye traders wait karte hain jab dusra candle pehle candle ke upper range ke andar close karta hai.

                3. **Entry Point:**
                - Entry point typically dusre candle ke high ke breakout par place kia jata hai. Jab price dusre candle ke high par move karta hai, traders long position lete hain.

                4. **Stop Loss:**
                - Stop loss ko pattern ke low ke neeche set karna zaroori hai taake risk ko minimize kiya ja sake.

                5. **Take Profit:**
                - Take profit target ko recent swing high, resistance level, ya Fibonacci extension levels ke mutabiq set kiya ja sakta hai. Isse profit maximization possible hoti hai.

                **Bullish Meeting Line Pattern Ka Example:**

                Agar GBP/USD pair pe bullish meeting line pattern form ho raha hai aur dusra candle pehle candle ke upper range ke andar close karta hai, to trader long position le sakta hai. Stop loss ko pattern ke low ke neeche place kare aur take profit ko recent resistance level par set kare.

                **Conclusion:**

                Bullish meeting line pattern forex trading mein important bullish reversal pattern hai jo traders ko price reversals aur uptrend ke potential signals provide karta hai. Ismein proper identification, confirmation aur risk management ke sath, traders consistent profitability achieve kar sakte hain. Lekin hamesha yaad rahe ke market conditions change ho sakte hain, isliye additional technical indicators aur market analysis bhi consider karna zaroori hai. Is tarah aapki trading strategy balanced aur effective hogi.
                   
                • #9 Collapse

                  **Bullish Meeting Line Candlestick Pattern: Ek Tafseeli Jaiza**
                  Bullish meeting line candlestick pattern forex aur stock market mein ek bullish reversal pattern hai jo trend change indicate karta hai. Is pattern ki recognition traders ke liye zaroori hai taaki woh market movements ko sahi tarah se samajh sakein aur profitable trading decisions le sakein.

                  **Bullish Meeting Line Candlestick Pattern Kya Hai?**

                  Bullish meeting line pattern do candlesticks se form hota hai, typically downtrend ke baad. Pehle candlestick ek downward trend ke baad form hoti hai jo bearish hoti hai. Dusri candlestick bhi downward open hoti hai lekin uski closing price pehli candlestick ki close ke above hoti hai, creating a bullish reversal signal.

                  **Bullish Meeting Line Pattern Ki Key Characteristics:**

                  1. **Pehli Candlestick:** Pehli candlestick ek downward trend ko represent karti hai jismein sellers dominate karte hain. Is candlestick ka body usually lamba hota hai.

                  2. **Dusri Candlestick:** Dusri candlestick bhi downward open hoti hai lekin iska close pehli candlestick ki close ke above hota hai. Iski body typically pehli candlestick ke body ke andar hoti hai.

                  3. **Volume:** Bullish meeting line pattern ke formation ke time par volume ko bhi observe kiya jaata hai. Agar dusri candlestick ke sath volume increase hota hai, toh bullish reversal signal ko confirm kiya ja sakta hai.

                  **Bullish Meeting Line Pattern Ka Interpretation:**

                  Bullish meeting line pattern bullish reversal signal provide karta hai jab market ek downtrend ke baad stabilize hone lagta hai aur buyers ka dominance dikhai deta hai. Is pattern ke baad traders next price movements ke liye anticipate karte hain. Agar dusri candlestick ke close ke neeche next candlestick bhi bullish move show karta hai, toh isse bullish trend continuation confirm hoti hai.

                  **Bullish Meeting Line Pattern Ka Importance:**

                  Bullish meeting line pattern traders ke liye useful tool hai trend reversals ko identify karne mein. Isko recognize karke traders apne trading strategies ko refine kar sakte hain aur potential entry aur exit points determine kar sakte hain. Is pattern ke saath other technical indicators aur price action patterns ka combination karke traders better decision making kar sakte hain.

                  **Conclusion:**

                  Bullish meeting line candlestick pattern ek powerful bullish reversal signal hai jo traders ko market trends ke changes ko identify karne mein madad deta hai. Iski sahi recognition aur interpretation se traders apni trading accuracy ko improve kar sakte hain aur profitable trades execute kar sakte hain. However, is pattern ki confirmation ke liye aur technical analysis ka istemal karke traders ko thorough market analysis karna chahiye.
                   
                  • #10 Collapse

                    **Bullish Meeting Line Candlestick Pattern**
                    Bullish meeting line candlestick pattern forex trading mein ek important price action pattern hai jo ke trend reversal ya continuation ko indicate karta hai. Is pattern ko identify karne ke liye traders ko candlestick charts par nazar rakhni hoti hai, jahan par do consecutive candles ki formation dekhi jaati hai.

                    Bullish meeting line pattern typically downtrend ke baad dikhai deta hai. Is pattern mein do consecutive candles hote hain: pehli candlestick bearish (downward) hoti hai aur doosri candlestick bullish (upward) hoti hai. Dono candlesticks ke bodies ek doosre se overlap karti hain, matlab ke unki opening aur closing prices qareeb qareeb ek jaise hoti hain.

                    Bullish meeting line pattern ki key characteristics aur steps include karte hue, is pattern ko identify kiya jata hai:

                    1. **Pehli Candlestick (Bearish):** Bullish meeting line pattern ke pehli candlestick typically ek downtrend ke baad dikhai deti hai. Is candlestick ki body lambi hoti hai aur lower end par close hoti hai.

                    2. **Doosri Candlestick (Bullish):** Bullish meeting line pattern ke doosri candlestick bullish hoti hai. Is candlestick ki body pehli candlestick ke body ke neeche overlap karti hai, lekin is ki closing price pehli candlestick ke closing price ke qareeb hoti hai.

                    Bullish meeting line pattern ka interpretation bullish trend reversal ya continuation ka signal provide karta hai. Traders is pattern ko confirm karne ke liye doosri technical indicators aur price action signals bhi consider karte hain. Agar bullish meeting line pattern ek strong support level ke qareeb form hota hai, to is se bullish reversal ka potential aur bhi strong ho sakta hai.

                    Is pattern ka buy signal tab consider kiya jaata hai jab doosri candlestick ke close ke baad price action ke saath confirmation milta hai. Traders typically next few candles ke price action ko observe karte hain taake confirm karen ke bullish meeting line pattern ke signals sahi hain.

                    Bullish meeting line pattern ka istemal kar ke traders apne trading decisions ko refine karte hain. Agar ek strong support level ke near ek bullish meeting line pattern dikhai de raha hai, to traders is se potential long positions ke liye prepare ho jate hain. Lekin, is pattern ke confirmation ke liye doosri technical analysis techniques ka bhi istemal kiya jata hai taake false signals ko minimize kiya ja sake.

                    Bullish meeting line pattern ka istemal karne se pehle, traders ko is ki characteristics ko acche se samajhna zaroori hai aur historical data par backtesting karna chahiye. Is tarah se, traders apni strategy ko refine kar sakte hain aur market ke movements ko predict karne mein behtar ho sakte hain.

                    Aakhir mein, bullish meeting line pattern ek powerful tool hai jo ke traders ko trend reversal aur continuation ke signals ko identify karne mein madad deta hai. Is liye, market analysis mein is pattern ka istemal zaroori hai taake traders consistent aur successful trading outcomes achieve kar sakein.
                    • #11 Collapse

                      **Bullish Meeting Line Candlestick Pattern**
                      Bullish Meeting Line ek mumtaz candlestick pattern hai jo uptrend ki nishandahi karta hai. Yeh pattern do candlesticks se banta hai aur uptrend ke badalne ka zahir karta hai. Is pattern ko samajhna traders ke liye zaroori hai kyunki isse prices ka trend change samajhne mein madad milti hai.

                      **Kaise pehchane Bullish Meeting Line?**

                      Bullish Meeting Line pattern ko pehchanna asan hai. Ismein do candlesticks hote hain:
                      1. Pehla candlestick: Yeh downtrend ke baad nikalta hai aur red (bearish) candle hota hai.
                      2. Dusra candlestick: Yeh pehle candlestick ke just baad nikalta hai aur iska color green (bullish) hota hai.

                      **Bullish Meeting Line ka matlab kya hai?**

                      Jab pehla candlestick bearish hota hai aur dusra candlestick iske just baad bullish hota hai aur dono ka range overlapping hota hai, to yeh bullish meeting line pattern banata hai. Iska matlab hota hai ki sellers ki control decrease ho rahi hai aur buyers ka dominance shuru ho raha hai.

                      **Is pattern ki importance kya hai?**

                      Bullish Meeting Line pattern ki pehchan karne se traders ko pata chalta hai ki market ke sentiment mein badlav ane wala hai. Yeh uptrend ke signals provide karta hai aur isse traders ko entry points identify karne mein madad milti hai.

                      **Trading mein Bullish Meeting Line ka istemal:**

                      1. **Entry point ke liye:** Jab Bullish Meeting Line pattern form hota hai, traders ko long position enter karne ka mauka milta hai.

                      2. **Stop loss:** Entry point ke neeche stop loss place kiya ja sakta hai taaki agar market trend reverse hota hai to nuksan se bacha ja sake.

                      3. **Target:** Price targets ko set karne ke liye previous highs ko consider kiya ja sakta hai ya technical analysis ke through levels identify kiye ja sakte hain.

                      **Conclusion**

                      Bullish Meeting Line pattern ek powerful tool hai jo traders ko trend reversal ke signals provide karta hai. Is pattern ko samajhne ke liye practice aur market ka understanding zaroori hai. Isse traders apne trading strategies ko improve kar sakte hain aur better decisions lene mein saksham ho sakte hain.
                         
                      • #12 Collapse

                        **Bullish Meeting Line Candlestick Pattern**
                        Bullish Meeting Line candlestick pattern ek bullish reversal pattern hai jo forex aur stock trading mein use hota hai. Yeh pattern market ke downtrend ke baad appear hota hai aur potential trend reversal ko indicate karta hai. Is pattern ka formation aur characteristics specific hote hain jo traders ko price action aur market sentiment ko samajhne mein madad karte hain.

                        **Characteristics of Bullish Meeting Line Pattern:**

                        1. **Downtrend Presence:** Pattern ka formation tab hota hai jab market downtrend mein hoti hai. Yeh pattern market ke bearish sentiment aur selling pressure ke baad bullish reversal ka signal deta hai.

                        2. **Two Candles:** Pattern do candles par based hota hai:
                        - **First Candle:** Pehli candle ek bearish candle hoti hai jo downtrend ko continue karti hai. Iska body long hota hai aur closing price lower hota hai.
                        - **Second Candle:** Dusri candle ek bullish candle hoti hai jo pehli candle ke closing price ke level ya uske aas-paas close hoti hai. Iska opening price pehli candle ke closing price ke neeche hota hai, lekin yeh price ko upar push karti hai aur approximately pehli candle ke closing price ke barabar close hoti hai.

                        3. **Closing Prices Meeting:** Pattern ka main characteristic yeh hai ke dono candles ke closing prices same ya bahut nazdeek hote hain. Yeh market mein strong buying pressure aur potential trend reversal ko indicate karta hai.

                        **Significance of Bullish Meeting Line Pattern:**

                        - **Bullish Reversal Signal:** Pattern ka formation market ke bearish sentiment ke baad bullish reversal ka strong signal deta hai. Yeh indicate karta hai ke sellers ke baad buyers ne control le liya hai aur price ko upar push karne mein successful hue hain.
                        - **Confirmation:** Pattern ko confirm karne ke liye additional technical indicators jaise volume, moving averages, aur support levels ka use karna chahiye. Confirmation se pattern ki reliability increase hoti hai.
                        - **Entry Point:** Pattern ke confirmation ke baad bullish trade enter kar sakte hain. Entry point dusri candle ke closing price ke baad ho sakta hai jab market bullish trend shuru karti hai.

                        **Example:**

                        Agar EUR/USD pair ek downtrend mein hai aur pehli bearish candle 1.1000 par close hoti hai, phir dusri bullish candle 1.0950 par open hoti hai aur 1.1000 par close hoti hai, toh yeh Bullish Meeting Line pattern indicate karta hai. Yeh pattern buyers ke strong presence aur potential trend reversal ko show karta hai. Confirmation ke baad aap bullish trade enter kar sakte hain.

                        **Trading Strategy:**

                        1. **Entry:** Pattern ke confirmation ke baad bullish trade enter karen. Confirmation ke liye next candle ka positive close hona zaroori hai.
                        2. **Stop-Loss:** Stop-loss order ko pattern ke lowest point ke neeche place karen taake potential losses ko limit kiya ja sake.
                        3. **Take-Profit:** Take-profit target ko recent resistance levels ya fixed risk/reward ratio ke base par set karen.

                        **Conclusion:**

                        Bullish Meeting Line candlestick pattern ek reliable bullish reversal pattern hai jo market ke downtrend ke baad bullish sentiment aur potential trend reversal ko indicate karta hai. Is pattern ko sahi tarike se identify karne aur additional confirmation ke sath trade karne se traders market ke bullish moves ko effectively capture kar sakte hain aur profitable trades le sakte hain. Proper risk management ke sath, yeh pattern trading strategies ko enhance karne mein madadgar hota hai.
                         
                        • #13 Collapse

                          Bullish Meeting Line ek bullish reversal candlestick pattern hai jo traders ko market ki direction change hone ka signal deta hai. Yeh pattern technical analysis mein istimaal hota hai aur do consecutive candlesticks par mabni hota hai.

                          Pattern Ki Pehchaan

                          Bullish Meeting Line pattern tab banta hai jab pehli candle bearish ho aur doosri candle bullish ho. Dono candles ki closing price almost barabar hoti hai, lekin pehli candle ki closing price low hoti hai aur doosri candle ki closing price high hoti hai. Yani ki yeh pattern market mein momentum shift ko darshata hai.

                          Click image for larger version

Name:	images (40).png
Views:	13
Size:	1.4 کلوبائٹ
ID:	13066154
                          Components
                          1. Bearish Candle: Pehli candle bearish hoti hai, jiska matlab hai ke market mein selling pressure hai.
                          2. Bullish Candle: Doosri candle bullish hoti hai, jo indicate karti hai ke market mein buying interest hai.

                          Kaam Kaise Karta Hai

                          Bullish Meeting Line pattern tab kaam karta hai jab market downtrend mein ho aur yeh pattern banne ke baad reversal hota hai. Pehli bearish candle indicate karti hai ke sellers dominate kar rahe hain, magar doosri bullish candle indicate karti hai ke buyers wapas aa gaye hain aur market ki direction change ho sakti hai.

                          Signal ki Mazbooti

                          Yeh pattern tab zyada mazboot hota hai jab:
                          • Volume: Doosri candle mein high volume ho, jo buying interest ko confirm karta hai.
                          • Support Level: Pattern support level par form ho, jo indicate kare ke buyers ne ek strong support area pe price ko hold kar liya hai.

                          Example

                          Agar hum ek chart dekhain jahan pehli bearish candle ki closing price $50 ho aur doosri bullish candle bhi $50 pe close ho, to yeh Bullish Meeting Line pattern ban gaya. Yeh indicate karta hai ke market downtrend se bullish reversal ki taraf move karne wala hai.

                          Strategy

                          Traders Bullish Meeting Line pattern ko istimaal karte hain trend reversal ko pehchanne ke liye aur uske baad entry points identify karte hain. Ek common strategy yeh hai ke:
                          1. Entry Point: Doosri bullish candle ki closing ke baad next candle ke start par buy position kholi jaye.
                          2. Stop Loss: Pehli bearish candle ki low ke niche stop loss set kiya jaye.
                          3. Profit Target: Pehle resistance level ya previous high tak profit target set kiya jaye.

                          Click image for larger version

Name:	images (82).jpeg
Views:	9
Size:	71.7 کلوبائٹ
ID:	13066155
                          Limitations

                          Bullish Meeting Line pattern ko identify karna aur trade karna mushkil ho sakta hai kyun ke:
                          • False Signals: Kabhi kabhi yeh pattern false signals bhi de sakta hai.
                          • Market Conditions: Yeh pattern har market condition mein kaam nahi karta, khas tor par jab market highly volatile ho.
                          Bullish Meeting Line pattern ek effective tool hai traders ke liye jo trend reversals ko identify karna chahte hain. Is pattern ko sahi tarike se identify aur trade karna zaroori hai taake profitable trades kiye ja sakein.
                          • #14 Collapse

                            **Bullish Meeting Line Candlestick Pattern**
                            Bullish meeting line candlestick pattern forex trading aur stock markets mein ek significant bullish reversal signal hai. Yeh pattern downtrend ke baad form hota hai aur market ke potential reversal points ko indicate karta hai. Is post mein hum bullish meeting line candlestick pattern ki khasiyat, iski identification aur trading strategy ko detail se samjhenge.

                            **Bullish Meeting Line Pattern Kya Hai?**

                            Bullish meeting line pattern ek two-candlestick pattern hai jo bearish trend ke baad form hota hai. Is pattern mein pehli candle ek strong bearish candle hoti hai jo downtrend ko continue karti hai, jabke doosri candle ek bullish candle hoti hai jo previous candle ke close price ke nazdeek close hoti hai. Yeh pattern market mein reversal aur bullish sentiment ke signals provide karta hai.

                            **Bullish Meeting Line Pattern Ki Characteristics:**

                            1. **Bearish Candle (First Candle):** Pehli candle typically large body aur lower shadow ke sath bearish hoti hai, jo downtrend ko signify karti hai. Is candle ki body market ke negative sentiment ko reflect karti hai.

                            2. **Bullish Candle (Second Candle):** Doosri candle ek bullish candle hoti hai jo pehli candle ke close ke nazdeek close hoti hai. Yeh candle usually small body ke sath hoti hai aur pehli candle ke close ke paas hoti hai. Doosri candle ka appearance indicate karta hai ke buyers market mein enter ho rahe hain aur selling pressure kam ho raha hai.

                            **Bullish Meeting Line Pattern Ka Istemaal:**

                            1. **Pattern Identification:** Sabse pehle, aapko bullish meeting line pattern ko identify karna hota hai. Iske liye, aapko bearish trend ke baad ek large bearish candle aur uske baad ek small bullish candle dekhni hoti hai jo pehli candle ke close ke nazdeek ho. Pattern ki confirmation ke liye aapko iske completion ke baad additional signals ka wait karna chahiye.

                            2. **Entry Point:** Entry point usually second candle ke close ke baad hota hai, jab price bullish momentum show karti hai. Jab pattern complete hota hai aur next candle bullish hoti hai, to buy order place karna chahiye.

                            3. **Stop Loss Placement:** Stop loss ko pehli candle ke low ke neeche set kiya jata hai. Yeh stop loss level aapko false breakouts aur unexpected market movements se bachata hai.

                            4. **Take Profit Levels:** Take profit levels ko previous resistance levels ya specific risk-reward ratio ke basis par set kiya jata hai. Yeh levels aapko profits lock karne mein madad karte hain aur trade exit ko strategically plan karte hain.

                            5. **Confirmation Tools:** Bullish meeting line pattern ki confirmation ke liye aap additional technical indicators jaise RSI (Relative Strength Index) ya MACD (Moving Average Convergence Divergence) ka use kar sakte hain. Yeh indicators pattern ke signals ko confirm karte hain aur trading decisions ko enhance karte hain.

                            **Bullish Meeting Line Pattern Ki Ahmiyat:**

                            1. **Bullish Reversal Signal:** Bullish meeting line pattern downtrend ke baad market ke reversal ka strong signal provide karta hai. Yeh pattern buyers ke entry aur selling pressure ke reduction ko indicate karta hai.

                            2. **High Probability:** Is pattern ka use karke traders high probability trading setups create kar sakte hain. Pattern ke signals aur additional confirmation tools trading decisions ko accurate aur reliable banate hain.

                            3. **Simplicity:** Bullish meeting line pattern ko identify aur use karna relatively simple hai. Yeh pattern beginners aur experienced traders dono ke liye valuable hota hai aur trading strategies ko enhance karta hai.

                            **Conclusion:**

                            Bullish meeting line candlestick pattern forex trading mein ek effective bullish reversal signal hai jo downtrend ke baad market ke potential reversal points ko indicate karta hai. Is pattern ko identify karne, entry aur exit points set karne, aur stop loss placement se aap apni trading strategy ko enhance kar sakte hain. Pattern ke additional confirmation tools ka use karke aap apne trading decisions ko accurate aur reliable bana sakte hain aur profitable trading opportunities ko maximize kar sakte hain.
                             
                            • <a href="https://www.instaforex.org/ru/?x=ruforum">InstaForex</a>
                            • #15 Collapse

                              Introduction of Bullish Meeting Line .

                              Mein Umeed karta ho ap sab khareyat say ho gay ho gay aj me ap ko Bullish meeting line candlestick pattern forex trading aur stock markets mein ek significant bullish reversal signal hai. Yeh pattern downtrend ke baad form hota hai aur market ke potential reversal points ko indicate karta hai. Is post mein hum bullish meeting line candlestick pattern ki khasiyat, iski identification aur trading strategy ko detail se samjhenge.

                              Bullish Meeting Line Pattern Kya Hay.

                              Bullish meeting line pattern ek two-candlestick pattern hai jo bearish trend ke baad form hota hai. Is pattern mein pehli candle ek strong bearish candle hoti hai jo downtrend ko continue karti hai, jabke doosri candle ek bullish candle hoti hai jo previous candle ke close price ke nazdeek close hoti hai. Yeh pattern market mein reversal aur bullish sentiment ke signals provide karta hay.

                              Bullish Meeting Line Pattern Ki Characteristics.

                              Bearish Candle (First Candle)

                              Pehli candle typically large body aur lower shadow ke sath bearish hoti hai, jo downtrend ko signify karti hai. Is candle ki body market ke negative sentiment ko reflect karti hay.


                              Click image for larger version  Name:	types-of-price-gaps-1.jpg Views:	26 Size:	110.6 KB ID:	13066918

                              Bullish Candle (Second Candle).

                              Doosri candle ek bullish candle hoti hai jo pehli candle ke close ke nazdeek close hoti hai. Yeh candle usually small body ke sath hoti hai aur pehli candle ke close ke paas hoti hai. Doosri candle ka appearance indicate karta hai ke buyers market mein enter ho rahe hain aur selling pressure kam ho raha ha.

                              Bullish Meeting Line Pattern Ka Istemaal.

                              Pattern Identification.

                              Sabse pehle, aapko bullish meeting line pattern ko identify karna hota hai. Iske liye, aapko bearish trend ke baad ek large bearish candle aur uske baad ek small bullish candle dekhni hoti hai jo pehli candle ke close ke nazdeek ho. Pattern ki confirmation ke liye aapko iske completion ke baad additional signals ka wait karna chahiye.

                              Entry Point.

                              Entry point usually second candle ke close ke baad hota hai, jab price bullish momentum show karti hai. Jab pattern complete hota hai aur next candle bullish hoti hai, to buy order place karna chahiye.

                              Stop Loss Placement.

                              Stop loss ko pehli candle ke low ke neeche set kiya jata hai. Yeh stop loss level aapko false breakouts aur unexpected market movements se bachata hay.

                              Take Profit Levels.

                              Take profit levels ko previous resistance levels ya specific risk-reward ratio ke basis par set kiya jata hai. Yeh levels aapko profits lock karne mein madad karte hain aur trade exit ko strategically plan karte hay.

                              Confirmation Tools.

                              Bullish meeting line pattern ki confirmation ke liye aap additional technical indicators jaise RSI (Relative Strength Index) ya MACD (Moving Average Convergence Divergence) ka use kar sakte hain. Yeh indicators pattern ke signals ko confirm karte hain aur trading decisions ko enhance karte hay

                              Bullish Meeting Line Pattern Ki Ahmiyat.

                              Bullish Reversal Signal.

                              Bullish meeting line pattern downtrend ke baad market ke reversal ka strong signal provide karta hai. Yeh pattern buyers ke entry aur selling pressure ke reduction ko indicate karta hai.

                              High Probability.

                              Is pattern ka use karke traders high probability trading setups create kar sakte hain. Pattern ke signals aur additional confirmation tools trading decisions ko accurate aur reliable banate hay..
                               
                              Last edited by ; 07-08-2024, 10:21 AM.

                              اب آن لائن

                              avatar Ayn
                              Working...
                              X