Dragonfly Doji Candlestick Pattern In forex.
X
  • وقت
  • دکھائیں
Clear All
new posts
  • #1 Collapse

    Dragonfly Doji Candlestick Pattern In forex.
    Definition

    Assalamu alaikum bhai mere kaise hain main ummid hai mujhe mere bhai pure X per Jo kam kar rahe hain Meri bahan hai jo flex per kam kar rahi hain vah bilkul kariye ke sath hongi main ek Dragon play duje candle ke bare mein Aaj baat karunga

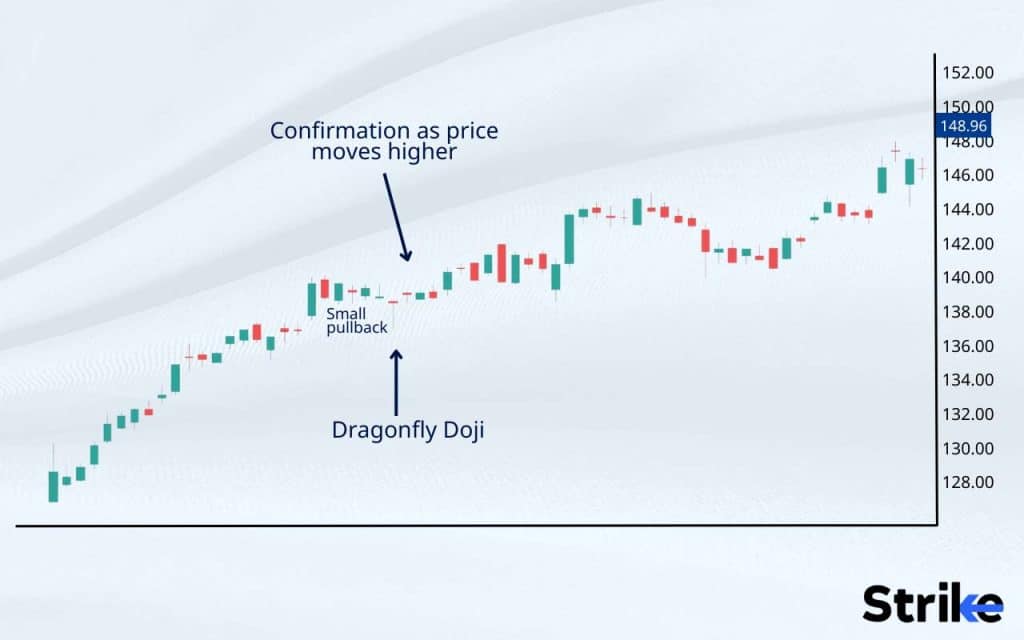
    Dragonfly Doji Candlestick Pattern ek aisa chart pattern hai jo trader ke liye bohat ahem hai. Yeh pattern bull trend ke pehle ya bear trend ke baad nazar aata hai. Is a pattern ki tashreeh neechay di gai hai


    explanation


    Is pattern mein ek one candle hota hai jo doji shape ka hota hai. Iska open, high aur close price almost same hote hain. Lekin iske neechay wali shadow lambi hoti hai jis se ye dragonfly ki shape banata hai. Iski body kafi chhoti hoti hai ya phir bilkul nahi hoti.


    What is a Bullish Dragonfly Doji Candlestick Pattern?

    Agar yeh pattern bearish trend ke baad nazar aaye k yeh bullish reversal signal hai. Je se ye maloom hota hai ke bear trend khatam hone wala hai aur ab market mein bull ka dominance hoga. There is a situation where traders buy karna chahiye.

    How does the Bearish Dragonfly Doji Candlestick Pattern work?

    Agar yeh pattern bullish trend ke pehle nazar aaye ke yeh bearish reversal signal hai. Je se ye maloom hota hai ke bull trend khatam hone wala hai aur ab market mein bear ka dominance hoga. There is a situation of mein traders who sell karna chahiye.


    Advantages of the Dragonfly Doji Candlestick Pattern

    Trend Reversal Signal:

    Dragonfly Doji Candlestick Pattern bear trend ke baad ya bull trend ke pehle nazar aata hai. Je se ye maloom hota hai ke trend khatam hone wala hai aur market mein trend reversal hone wala hai.

    High Probability Trade:

    Is pattern to signals par amal karne se trader ko high probability trade karne ka mauqa milta hai. It is a trader to chance to increase profit ho jate hain.

    Easy to identify:

    Dragonfly Doji Candlestick Pattern ko identify karna bohat asan hai. Is pattern mein one candle hota hai jo doji shape ka hota hai aur iski shape dragonfly ki tarah hoti hai.
    Useful in several time periods:
    Is the pattern ko multiple time frames, I use kiya ja sakta hai. Je se ye maloom ho sakta hai ke long term trend kya hai aur short term trend kya hai.

    It helps in risk management:

    Is pattern ke signals par amal karne se trader apni trading strategy ko improve kar sakta hai. Is a businessman apni position ko drive karne mein madad milti hai aur risk ko kam karne mein bhi madad milti hai.

    The actual result is:

    Dragonfly Doji Candlestick Pattern ek aham chart pattern hai jo trader ke liye bohat faydemand hai. Is pattern ko identify karna asan hai aur iske signals par amal kar ke trader apni trading strategy ko improve kar sakta hai. Is pattern to trader signals ko trend reversal signal milta hai aur high probability trade ka mauqa milta hai. Is a pattern ko multiple time frames i use kiya ja sakta hai aur is a trader ki risk management skills bhi improve ho sakti hain.
  • <a href="https://www.instaforex.org/ru/?x=ruforum">InstaForex</a>
  • #2 Collapse

    Dragonfly Doji Candlestick Pattern in Forex
    1. Dragonfly Doji Candlestick Pattern Kia Hai?

    Dragonfly Doji ek khas candlestick pattern hai jo forex trading mein use hota hai. Yeh pattern tab banta hai jab ek currency pair ka open, high, aur close price same hota hai. Yeh ek important signal hota hai jo traders ko market ke possible reversal ke bare mein batata hai. Yeh pattern, Japanese candlestick charting ke fundamental parts mein se ek hai aur isse market ke behavior aur sentiment ko samajhne mein madad milti hai.

    Dragonfly Doji ka ek khas feature uski choti se body aur long lower shadow hai. Yeh signify karta hai ke during the trading period, price niche gaya lekin buyers ne price ko wapas initial level tak le aaya. Iska matlab yeh hai ke market mein buyers dominate kar rahe hain aur future mein price ko upar le ja sakte hain.
    1. Pattern Ka Appearance
    Is pattern ka appearance bilkul ek dragonfly ki tarah hota hai, jisme sirf ek long lower shadow hoti hai aur body bilkul choti ya na hone ke barabar hoti hai. Yeh shadow is baat ko indicate karti hai ke market mein significant selling pressure tha, lekin buyers ne control haasil kar liya aur price ko recover kar diya.

    Dragonfly Doji pattern mein upper shadow nahi hoti ya bohot choti hoti hai, jo is baat ko batati hai ke market ke andar selling pressure ke baad ek strong buying pressure aaya. Yeh visual representation traders ke liye ek clear signal hoti hai ke market sentiment bullish ho sakta hai.
    1. Market Sentiment
    Dragonfly Doji pattern market ke sentiment ko reflect karta hai. Yeh bullish reversal signal hota hai jab market downtrend mein hota hai. Jab yeh pattern form hota hai, toh iska matlab hota hai ke sellers ne initial control le liya tha lekin buyers ne market ko dominate kar liya aur price wapas upar le aaye.

    Is pattern ka formation yeh indicate karta hai ke sellers ka strength kam ho raha hai aur buyers market mein wapas a rahe hain. Yeh information traders ko help karti hai apne trades ko adjust karne mein aur potential profit opportunities ko identify karne mein.
    1. Formation
    Dragonfly Doji tab banta hai jab sellers price ko niche le jate hain lekin buyers usse wapas initial level tak le aate hain. Yeh formation is baat ka signal hota hai ke market mein ek shift ho raha hai aur buying interest increase ho raha hai.

    Is pattern ke formation ke waqt, market ka opening price, high price, aur closing price almost same hote hain, jab ke low price significantly neeche hota hai. Yeh indicate karta hai ke market mein initial selling pressure tha lekin buyers ne apna influence show kar diya aur price ko wapas original level tak le aaye.
    1. Reversal Signal
    Yeh pattern indicate karta hai ke market downtrend se uptrend mein reversal kar sakta hai. Yeh bullish reversal pattern hota hai jo is baat ka indication deta hai ke market mein ek potential trend reversal aa sakta hai.

    Dragonfly Doji pattern jab ek downtrend ke baad form hota hai, toh yeh signal hota hai ke market ne bottom touch kar liya hai aur ab upar jane ki potential hai. Traders is signal ko use karte hain taake apne buying positions ko plan kar sakein.
    1. Trading Strategy
    Is pattern ko dekh kar traders anticipate karte hain ke market mein bullish move ho sakti hai, aur accordingly apne trades place karte hain. Trading strategy banate waqt, traders is pattern ke sath dusre technical indicators ko bhi use karte hain taake unhe confirmation mil sake.

    Ek common trading strategy yeh hoti hai ke jab Dragonfly Doji pattern form hota hai, toh traders ek bullish confirmation candle ka wait karte hain jo next trading session mein form hoti hai. Jab yeh confirmation candle form hoti hai, toh traders apne buy positions open karte hain.
    1. Pattern Ka Importance
    Forex market mein Dragonfly Doji kaafi important hai kyunki yeh price reversal ke bare mein early indication de sakta hai. Yeh pattern market ke sentiment ko accurately reflect karta hai aur traders ko potential trend reversals ke bare mein early warning provide karta hai.

    Is pattern ka importance isliye bhi hai kyunki yeh market ke andar buying pressure ko indicate karta hai, jo future mein price increase ka cause ban sakta hai. Traders is pattern ko use karte hain taake apne trading strategies ko optimize kar sakein aur potential profits ko maximize kar sakein.
    1. Confirmation
    Yeh zaroori hai ke traders is pattern ko other indicators aur analysis ke sath confirm karein. Sirf Dragonfly Doji pattern par rely karna risky ho sakta hai kyunki false signals bhi possible hain.

    Traders often use moving averages, RSI (Relative Strength Index), aur MACD (Moving Average Convergence Divergence) jaise technical indicators ke sath Dragonfly Doji pattern ko confirm karte hain. Yeh additional indicators help karte hain traders ko ek better understanding provide karne mein ke market kis direction mein move kar sakta hai.
    1. Support Levels
    Dragonfly Doji aksar support levels par banta hai, jo iske reliability ko enhance karta hai. Support level woh price level hota hai jahan par demand strong hoti hai aur price niche nahi girta.

    Jab Dragonfly Doji pattern support level par form hota hai, toh yeh ek strong bullish signal hota hai. Yeh indicate karta hai ke market ne ek strong support level touch kar liya hai aur ab bullish reversal ka potential hai. Traders is pattern ko dekh kar apne buy orders place karte hain aur support level ko apne stop loss orders ke liye use karte hain.
    1. Volume Analysis
    High volume par Dragonfly Doji ka formation is pattern ki significance ko aur bhi zyada enhance karta hai. Volume analysis is baat ka indicator hota hai ke market mein kitni trading activity ho rahi hai.

    Jab Dragonfly Doji pattern high volume ke sath form hota hai, toh yeh is baat ka signal hota hai ke buyers aur sellers ke beech significant interest aur activity hai. High volume ka matlab yeh hai ke buyers ne market ko dominate kar liya hai aur price ko recover kar diya hai. Yeh signal traders ko confidence deta hai ke pattern reliable hai.
    1. Historical Data
    Traders historical data analyze kar ke yeh dekh sakte hain ke Dragonfly Doji past mein kitna accurate tha. Historical data analysis se traders ko yeh idea milta hai ke yeh pattern historically kis tarah perform karta raha hai aur iske reliability kitni high hai.

    Past data ko analyze kar ke, traders yeh identify kar sakte hain ke Dragonfly Doji pattern kis market condition mein sabse zyada accurate hota hai. Yeh analysis unhe help karta hai apni trading strategies ko refine karne mein aur better trading decisions lene mein.
    1. Risk Management
    Is pattern ke sath trading karte waqt risk management strategies ka use zaroori hai taake potential losses minimize ho saken. Risk management trading ka ek important aspect hai jo traders ko help karta hai apne capital ko protect karne mein.

    Traders Dragonfly Doji pattern ke sath apne risk ko manage karne ke liye stop loss orders use karte hain. Stop loss orders unhe help karte hain ke agar market unki expectations ke against move kare, toh unke losses limited rahein. Iske alawa, traders position sizing strategies bhi use karte hain taake apne overall risk ko control kar sakein.
    1. Stop Loss Placement
    Traders aksar stop loss orders place karte hain pattern ke lower shadow ke neeche, taake risk ko control kar saken. Stop loss placement ke waqt yeh ensure karna zaroori hai ke yeh level aise price par ho jo significant ho aur market ke fluctuations ke against protect kar sake.

    Jab Dragonfly Doji pattern form hota hai, toh traders lower shadow ke neeche apne stop loss orders place karte hain taake agar market niche move kare, toh unke losses minimize ho sakein. Yeh risk management strategy unhe market ke unpredictable movements ke against protect karti hai.
    1. Entry Point
    Dragonfly Doji pattern ke baad bullish confirmation candle ka wait karna chahiye before entering a trade. Entry point select karte waqt, yeh zaroori hai ke traders ek strong confirmation ka wait karein jo market ke sentiment ko confirm kare.

    Bullish confirmation candle is baat ka signal hoti hai ke market bullish reversal ke liye ready hai. Jab yeh confirmation candle form hoti hai, toh traders apne buy positions open karte hain aur potential price increase ka benefit uthate hain.
    1. Combination with Other Patterns
    Yeh pattern dusre candlestick patterns ke sath combine kar ke bhi use kiya ja sakta hai for better trading signals. Combination of patterns traders ko ek comprehensive understanding provide karta hai ke market kis direction mein move kar raha hai.

    For example, Dragonfly Doji pattern ko Hammer pattern ke sath combine kar ke use kiya ja sakta hai taake ek strong bullish signal mile. Yeh combination traders ko better confidence provide karta hai ke market mein bullish reversal ka potential hai.
    1. Limitations
    Is pattern ki kuch limitations bhi hain, jaise ke false signals. Isliye, yeh zaroori hai ke isko standalone na samjha jaye. False signals tab generate ho sakte hain jab market mein unexpected events ya news aati hain jo market sentiment ko drastically change kar deti hain.

    Is pattern ki ek aur limitation yeh hai ke yeh har market condition mein equally effective nahi hota. Yeh pattern certain market conditions mein zyada reliable hota hai, aur dusri conditions mein iska effectiveness kam ho sakta hai. Isliye, yeh zaroori hai ke traders is pattern ko other indicators aur analysis ke sath use karein.
    1. Expert Opinion
    Bohat se trading experts is pattern ko use karte hain aur iski reliability ko enhance karne ke liye different strategies adopt karte hain. Experts apne extensive experience aur knowledge ko use karte hain taake Dragonfly Doji pattern ko effectively use kar sakein.

    Experts recommend karte hain ke traders is pattern ko standalone na use karein, balki iske sath dusre technical indicators aur analysis tools ko bhi use karein. Yeh approach unhe better trading decisions lene mein help karti hai aur potential profits ko maximize karne mein assist karti hai.
    1. Pattern Recognition Tools
    Modern trading platforms pattern recognition tools offer karte hain jo Dragonfly Doji aur dusre patterns ko identify karne mein madadgar hote hain. Yeh tools traders ko time save karne mein madad karte hain aur unhe accurate pattern recognition provide karte hain.

    Pattern recognition tools automatically charts ko scan karte hain aur different candlestick patterns ko identify karte hain. Yeh tools traders ko real-time alerts provide karte hain jab koi significant pattern form hota hai, jo unhe better trading opportunities identify karne mein help karta hai.
    • Learning and Practic
    Dragonfly Doji pattern ko effectively use karne ke liye traders ko continuous learning aur practice karni chahiye. Is se unki trading skills aur market understanding improve hoti hai. Learning and practice se traders ko better confidence milta hai aur unki ability to make accurate trading decisions enhance hoti hai.

    Traders educational resources jaise ke books, online courses, webinars, aur trading simulators use kar ke apni knowledge aur skills ko improve kar sakte hain. Yeh resources unhe latest trading strategies aur market analysis techniques ke bare mein updated rakhte hain.

    Conclusion

    Dragonfly Doji candlestick pattern forex trading mein ek valuable tool hai jo market reversals ko indicate kar sakta hai. Lekin, isko doosre indicators aur analysis ke sath combine kar ke use karna chahiye taake accurate trading decisions liye ja saken. Risk management strategies aur continuous learning is pattern ko effectively use karne ke liye zaroori hain.

    Is pattern ke advantages aur limitations ko samajhna traders ke liye important hai. Yeh pattern market sentiment aur price reversals ke bare mein valuable insights provide karta hai, lekin isko carefully analyze aur use karna chahiye taake potential losses se bacha ja sake aur profits maximize kiye ja sake.
    • #3 Collapse

      what is Dragonfly Doji candlestick pattern

      forex market mein dragonfly doji candlestick pattern aik kesam ka pattern hota hey jo keh forex market kay trend reversal ko he identify karta hey jo keh forex market kay trend reversal janay ka eshara hota hey chonkeh forex market ka pattern past price action par he depend karta hey jes mein assert ke peak opn bhe ho sakte hein or close bhe ho sakte hein
      forex market kay pattern kay sath long lower shadow bhe ho sakta hey jo keh candlestick period kay sath he jare pattern ko he identify kar sakta hey chonkeh forex market ke price opening kay zyada close ho gai hote hey es say zahair hota hey keh buyer forex market kay seller ko jazb karnay ka jazba rakh saktay hein or price ko wapes dakail saktay hein

      Understanding Dragonfly Doji Pattern

      yeh forex market kay don trend ko follow karta hey forex market mein upper trend kay bad yeh follow karta hey keh forex market mein pechay say he up say down ke taraf movement karta ja raha hey yeh forex market ke price mein bhe kame ho sakte hey dono sorton mein dragonfly doji kay bad price action mein kame kar de jate hey
      forex market mein dragonfly doji pattern zyada tar nahi banta hey laken jab yeh hota hey to yh aik end ke allamat kay tor par he zahair ho jata hey seller wallay kam say kam part kay ley kuch hesay ko control kar rahay hotay hein jabkeh price baghair kese direction kay control ho choke hote hey es period kay bad selling mein ezafa ho jata hey
      mumkana tor par bearish dragonfly doji candlestick pattern ke reversal janay ke confirmation hote hey jes kay bad candlestick dragonfly kay close say nechay gerna start ho jate hey es kay bad ager confirmation mein candlestick barah jate hey to forex market kay trend ka reversal jana fake ho jata hey kunkeh market mein price barah jate hey

      Technical analysis mein dragonfly Doji pattern

      forex market ka trend up trend mein movement kar raha hota hey jab yeh pattern market mein doji ke wajah say nechy ko ready ho jata hey to yeh doji candlestick pattern dragonfly Doji ke wajah say down trend mein grna start ho jata hey hum forex market ke security ko buy kar kay es time tak stop kar kay rakheen gay jab tak yeh target tak nahi pohnch patay hein kuch trader mumkana losses ko kam karnay kay ley stop loss order kaim kartay hein ager trend forex market mein omeed kay tor par wapes aa sakta hey
      bhali kay badlay bhali
      • #4 Collapse


        Dragonfly Doji Candlestick Pattern forex market mein ek important reversal pattern mana jata hai. Yeh pattern ek single candle se banta hai aur indicate karta hai ke market direction change karne wala hai. Yeh hai is pattern ka tafseeli bayan:
        Structure:
        • Candle ka open, high, aur close kareeb-kareeb same level par hote hain.
        • Candle ka ek lamba lower shadow hota hai jo indicate karta hai ke price significantly neeche gaya tha lekin wapas apne opening price ke kareeb close hua.
        Context:
        • Yeh pattern dono uptrend aur downtrend mein mil sakta hai, lekin iska bullish reversal potential downtrend mein zyada hota hai.
        • Agar uptrend mein yeh pattern nazar aaye to yeh bearish reversal bhi indicate kar sakta hai.
        Characteristics:
        • Body bilkul patli hoti hai, ya bilkul nahi hoti (doji).
        • Lower shadow lamba hota hai, lekin upper shadow ya to hota nahi ya bohot chota hota hai.
        Psychology:
        • Market mein initial selling pressure dikhata hai, jo price ko neeche le jata hai.
        • Buyers wapas control le lete hain aur price ko wapas opening level par le aate hain.
        • Yeh indicate karta hai ke sellers weak ho rahe hain aur buyers strength gain kar rahe hain.
        Confirmation:
        • Is pattern ka confirmation zaroori hota hai.
        • Aam tor par, traders ek subsequent bullish candle ya volume ke izafay ka intezar karte hain.
        • Mazeed technical indicators (e.g., RSI, MACD) bhi use kiye ja sakte hain confirmation ke liye.
        Trading Strategy:
        • Confirmation milne ke baad long (buy) position le sakte hain.
        • Stop-loss lower shadow ke niche rakhein taake risk manage ho sake.
        • Target nearest resistance level ya risk-reward ratio ke base par set karein.

        Dragonfly Doji candlestick pattern forex trading mein ek useful tool hai jo potential market reversals ko pehchanne mein madad karta hai. Is pattern ko samajh kar aur use karke traders apni trading strategies ko enhance kar sakte hain.


        • #5 Collapse

          Dragonfly Doji Candlestick Pattern In forex.


          Click image for larger version

Name:	download (2).png
Views:	16
Size:	4.2 کلوبائٹ
ID:	13030533
          Dragonfly Doji Candlestick Pattern Forex mein aik bohot ehm pattern hai jo market ki direction aur investor sentiment ko samajhne mein madad karta hai. Yeh pattern un charts par dekhne ko milta hai jahan price action ko analyze kiya jata hai, jaise ke candlestick charts. Is pattern ko samajhna aur theek tarike se interpret karna forex traders ke liye zaroori hai, kyun ke yeh unhein market mein entry aur exit points identify karne mein madad kar sakta hai.
          Dragonfly Doji Candlestick Pattern kya hota hai?


          Dragonfly Doji ek aisa candlestick pattern hai jo tab banta hai jab opening, closing, aur high price almost same hoti hain, lekin low price bahut niche hoti hai. Yeh pattern market ke turning point ya reversal ka signal ho sakta hai. Iska matlab yeh hai ke market ek trend ko complete kar chuka hai aur ab opposite direction mein move karne wala hai.
          Dragonfly Doji Pattern ko Identify Karna


          Is pattern ko pehchanne ke liye kuch khas points hain:
          1. Open, High, aur Close Price ka Almost Same Hona: Jab open, high, aur close price aik hi level par hoti hain ya bahut qareebi hoti hain, to yeh dragonfly doji ki shakal bana leta hai.
          2. Long Lower Shadow: Is pattern ki aik khas nishani long lower shadow hoti hai, jo low price ko represent karti hai. Yeh shadow is baat ko darshati hai ke price ne low level ko touch kiya lekin wapas recover ho gaya.
          3. No Upper Shadow: Usually, dragonfly doji ke paas upper shadow nahi hoti ya agar hoti hai to bohot choti hoti hai.
          Forex Trading mein Iska Matlab


          Forex market mein dragonfly doji ka matlab yeh hota hai ke selling pressure market mein tha lekin buyers ne market ko wapas pull kar liya. Yeh indicate karta hai ke market mein trend reversal ho sakta hai.

          Agar yeh pattern ek downtrend ke baad aata hai, to yeh potential bullish reversal ka signal ho sakta hai. Matlab yeh hai ke market niche se upar move kar sakta hai.

          Wahi agar yeh pattern ek uptrend ke baad aata hai, to yeh potential bearish reversal ka signal ho sakta hai. Matlab yeh hai ke market upar se niche move kar sakta hai.
          Dragonfly Doji Pattern ke Trading Strategies


          Dragonfly doji pattern ko use karte hue traders kuch strategies apply kar sakte hain:
          1. Confirmation ka Intizar: Dragonfly doji dekhne ke baad confirmation ka intizar karna zaroori hai. Ek bullish dragonfly doji ke baad next candle green honi chahiye takay yeh confirm ho ke trend reverse ho raha hai.
          2. Stop Loss Setting: Trading mein risk management bohot ehm hota hai. Dragonfly doji dekhne ke baad, stop loss ko recent low ke niche set karna chahiye takay agar market ulta move kare to zyada loss na ho.
          3. Support aur Resistance Levels: Dragonfly doji pattern ko identify karte waqt support aur resistance levels ko bhi dekhna chahiye. Agar yeh pattern support level par ban raha hai to bullish reversal ke chances zyada hote hain.
          Practical Example


          Ek practical example se samajhte hain. Sochiye ke GBP/USD pair downtrend mein hai aur aapne candlestick chart par dragonfly doji pattern dekha. Iska matlab yeh ho sakta hai ke selling pressure kam ho raha hai aur buyers market mein wapas aa rahe hain. Agar next candle bullish hai to yeh confirmation ho sakta hai ke market uptrend ki taraf move karega.

          Aise waqt par aap buy position enter kar sakte hain lekin risk ko manage karne ke liye stop loss recent low ke thoda niche lagayenge. Yeh ensure karega ke agar market wapas downtrend mein jata hai to aapka loss limited rahe.
          Conclusion


          Dragonfly Doji Candlestick Pattern forex trading mein ek qeemti tool hai jo traders ko market ke potential reversals ko pehchanne mein madad karta hai. Is pattern ko theek tarike se samajhna aur us par amal karna profitable trading decisions lene mein madadgar sabit ho sakta hai. Lekin hamesha yaad rakhiye ke koi bhi trading strategy 100% accurate nahi hoti, is liye proper risk management aur additional indicators ka istemal zaroori hai.

          Is pattern ko practice karte hue, traders apni trading skills ko improve kar sakte hain aur market movements ko better tarike se samajh sakte hain. Forex trading mein success pane ke liye market ka analysis aur proper strategy follow karna zaroori hota hai. Dragonfly doji pattern ko apni trading strategy mein shaamil karna aapko ek edge de sakta hai jo aapki trading performance ko enhance karega.
          • #6 Collapse

            The Dragonfly Doji is a significant candlestick pattern in forex trading, characterized by its unique shape and implications for market sentiment. Understanding this pattern can provide insights into potential price reversals and market psychology.
            Anatomy of a Dragonfly Doji

            A Dragonfly Doji forms when the open, high, and close prices are all the same or very close to each other, often at the high of the day. The distinctive feature of this candlestick is its long lower shadow (or wick) and no upper shadow (or a very short one). Visually, it resembles a 'T' shape or an inverted 'T', where the body represents the opening and closing prices, and the shadow indicates the range of price movement during the trading session.

            - Open:

            The price at which the period opens.

            - High:

            The highest price reached during the period.

            - Close:

            The price at which the period closes.

            - Low:

            The lowest price reached during the period.

            Interpretation and Market Psychology

            The Dragonfly Doji is considered a bullish reversal pattern when it appears after a downtrend. Its formation suggests that despite the bearish pressure earlier in the session, buyers have regained control, pushing the price back up to near the session's high. Here’s a breakdown of the market psychology behind a Dragonfly Doji:

            1. Initial Selling Pressure:

            The session opens, and prices decline significantly, indicating bearish sentiment.

            2. Reversal Attempt:

            However, during the session, buyers step in and push the price back up, erasing most or all of the earlier losses.

            3. Closing Near Highs:

            By the session's close, the price returns to near the opening level, signaling strong buying interest and a rejection of lower prices.

            4. Indication of Potential Reversal:

            The long lower shadow suggests that sellers tried to push the price lower but failed, while the lack of an upper shadow indicates there was no significant selling pressure near the highs.

            Key Points to Consider

            - Confirmation:

            For traders, confirmation of the Dragonfly Doji's bullish signal typically comes from the next candlestick. Ideally, this candlestick should open higher than the Dragonfly Doji’s close and continue to move upwards.

            - Volume:

            Analyzing volume can provide additional confirmation. A strong increase in volume on the subsequent bullish candle reinforces the bullish reversal signal.

            - Support and Resistance:

            Identifying key support levels near where the Dragonfly Doji forms can enhance the pattern's reliability. If the pattern forms near a significant support level, it strengthens the bullish outlook.

            Trading Strategies

            Traders often employ several strategies when encountering a Dragonfly Doji:

            1. Buy Signal:

            Enter a long position once the next candle confirms the bullish reversal. This strategy assumes that the bullish momentum will continue.

            2. Stop-Loss Placement:

            Place a stop-loss order below the low of the Dragonfly Doji candlestick to protect against potential downside risk.

            3. Target Setting

            Determine a profit target based on previous highs or resistance levels. Some traders use Fibonacci extensions or other technical indicators to set targets.

            Limitations and Considerations

            While the Dragonfly Doji is a powerful pattern, traders should be mindful of its limitations:

            - False Signals:

            Like any technical pattern, false signals can occur, especially in volatile markets or during periods of low liquidity.

            - Confirmation Required:

            It's crucial to wait for confirmation from the next candlestick to validate the pattern before entering a trade.

            - Market Context:

            Always consider the broader market context, including fundamental factors and overall trend direction, when interpreting candlestick patterns.

            Conclusion

            In conclusion, the Dragonfly Doji candlestick pattern is a valuable tool for forex traders, signaling potential bullish reversals after a downtrend. Its formation reflects a shift in market sentiment from bearish to bullish, with buyers regaining control and pushing prices higher. By understanding the anatomy, interpretation, and trading strategies associated with the Dragonfly Doji, traders can enhance their ability to identify profitable trading opportunities in the forex market. However, like any technical analysis tool, it should be used in conjunction with other indicators and within the context of a comprehensive trading strategy.
            • #7 Collapse

              Dragonfly Doji Candlestick Pattern in Forex Trading


              Dragonfly Doji candlestick pattern ek important single-candle pattern hai jo market mein potential reversal ya indecision ko indicate karta hai. Yeh pattern buyers aur sellers ke beech ke balance ko reflect karta hai aur market sentiment ke changes ka signal hota hai.
              Structure and Identification
              • Appearance: Dragonfly Doji ek single candlestick pattern hota hai jo cross ya "T" shape mein appear hota hai.
              • Open, High, and Close: Candle ka open, high, aur close approximately same level par hota hai.
              • Low: Candle ka low ek long lower shadow form karta hai, jo indicate karta hai ke trading session ke dauran sellers dominate kar rahe the lekin buyers ne price ko wapas upar le aaya.
              Interpretation
              1. Market Sentiment: Dragonfly Doji buyers aur sellers ke beech ke balance ko indicate karta hai. Session ke dauran sellers dominate kar rahe the lekin buyers ne end mein control le liya.
              2. Reversal Signal: Yeh pattern potential reversal signal hota hai, especially agar downtrend ke baad form ho. Uptrend ke dauran yeh pattern indecision ko indicate kar sakta hai.
              Trading Strategy

              In a Downtrend (Bullish Reversal)
              1. Confirmation:
                • Dragonfly Doji ko identify karne ke baad, ek bullish confirmation candle ka wait karen jo higher close ho.
                • Confirmation se pattern ki reliability badh jaati hai aur false signals se bacha ja sakta hai.
              2. Entry:
                • Confirmation candle ke close hone ke baad long position enter karen.
                • Yeh conservative approach traders ko better entry point provide karti hai.
              3. Stop Loss:
                • Stop loss ko Dragonfly Doji ke low ke neeche place karen taake unexpected market movements se protection mile.
                • Yeh risk management technique potential losses ko limit karne mein madadgar hoti hai.
              4. Take Profit:
                • Take profit nearest resistance level ya predefined risk-reward ratio ke mutabiq set karen.
                • Yeh strategy ensures ke profits lock ho jaate hain aur market movements ka maximum benefit liya ja sake.
              In an Uptrend (Bearish Reversal or Indecision)
              1. Confirmation:
                • Dragonfly Doji uptrend ke dauran form hota hai to bearish confirmation candle ka wait karen jo lower close ho.
                • Confirmation se pattern ki reliability badh jaati hai aur potential reversal confirm hota hai.
              2. Entry:
                • Confirmation candle ke close hone ke baad short position enter karen.
                • Yeh conservative approach traders ko better entry point provide karti hai.
              3. Stop Loss:
                • Stop loss ko Dragonfly Doji ke high ke upar place karen taake unexpected market movements se protection mile.
                • Yeh risk management technique potential losses ko limit karne mein madadgar hoti hai.
              4. Take Profit:
                • Take profit nearest support level ya predefined risk-reward ratio ke mutabiq set karen.
                • Yeh strategy ensures ke profits lock ho jaate hain aur market movements ka maximum benefit liya ja sake.
              Example of Dragonfly Doji Pattern

              Bullish Reversal Example (EUR/USD)
              1. Identify Pattern: Downtrend ke baad, ek Dragonfly Doji candle form hoti hai jisme long lower shadow aur open, high, close approximately same level par hota hai.
              2. Confirmation: Dragonfly Doji ke baad, ek bullish candle form hoti hai jo higher close hoti hai.
              3. Entry: Confirmation candle ke close hone ke baad long position enter karen.
              4. Stop Loss: Dragonfly Doji ke low ke neeche stop loss set karen.
              5. Take Profit: Nearest resistance level par take profit set karen.
              Additional Tips
              1. Volume Analysis: High volume during the formation of Dragonfly Doji pattern pattern ki reliability ko badhata hai.
              2. Confluence: Dusre technical indicators jaise RSI, MACD, aur support/resistance levels ke sath combine kar ke pattern ki confirmation le sakte hain.
              3. Market Context: Pattern ko broader market context aur trend analysis ke sath use karen taake accurate trading decisions le sakein.
              Conclusion


              Dragonfly Doji candlestick pattern ek significant reversal signal hota hai jo buyers aur sellers ke beech ke balance ko indicate karta hai. Is pattern ko correctly identify karne, confirm karne aur appropriate trading strategy follow karne se traders profitable trades generate kar sakte hain. Proper risk management techniques aur additional confirmation se pattern ki reliability badh sakti hai aur trading performance improve ho sakti hai.


              • #8 Collapse

                Dragonfly Doji Candlestick Pattern

                Forex trading main candlestick patterns bohot ahmiyat rakhtay hain. Yeh patterns traders ko market ke trend aur potential reversals ke bare main insight dete hain. Un mein se aik ahm pattern "Dragonfly Doji" hai. Dragonfly Doji aik unique candlestick pattern hai jo market ki sentiment aur price action ke bare main qabil-e-qabul maloomat faraham karti hai. Iss pattern ka tafseeli jaiza lena, humain behtar trading decisions lene main madad de sakta hai.
                Click image for larger version

Name:	images (1).png
Views:	16
Size:	3.4 کلوبائٹ
ID:	13030654
                Dragonfly Doji Ka Asal


                Dragonfly Doji ek aisi candlestick hoti hai jo apni khushnuma shakl ki waja se pehchani jati hai. Yeh candlestick bilkul ek "T" harf ki tarah lagti hai. Yeh pattern tab banta hai jab open, high, aur close prices lagbhag barabar hon aur low price significantly neeche ho. Yeh signify karta hai ke day ke doran sellers ne prices ko neeche dhakelne ki koshish ki, lekin buyers ne prices ko wapas initial level par la diya. Isse yeh paighaam milta hai ke buyers aur sellers ke darmiyan zordar larai hui aur akhirat mein buyers jeet gaye.

                Dragonfly Doji Ka Form

                Dragonfly Doji ke form ko samajhna ahm hai kyun ke yeh pattern market ki psychology ko wazeh karta hai. Yeh candlestick apne open, high, aur close prices ke same hone ki waja se upper shadow nahi rakhti. Iska aik lamba lower shadow hota hai jo market ke doran extreme lows tak jaane ko zahir karta hai. Yeh shadow batata hai ke selling pressure zyada tha lekin akhirat mein buyers ne market ko wapas upper level par le aya. Yeh formation zaroori hai taake hum samajh saken ke market participants kis tarah ka soch rakhtay hain.

                Iska Mahiyat aur Interpretation

                Dragonfly Doji ka paida hona aksar bullish reversal signal hota hai. Yeh pattern market ke downtrend ke end aur uptrend ke aghaz ko zahir karta hai. Jab yeh pattern support level par banta hai, to iska matlab hota hai ke market buyers ab control le rahe hain aur prices ko upper direction mein dhakel rahe hain. Yeh traders ke liye aik indication hoti hai ke buying pressure barh raha hai aur selling pressure kam ho raha hai. Yahan yeh baat samajhna zaroori hai ke yeh pattern apni akeli shakal main trading signal nahi hota, balke isay doosri technical analysis tools ke sath milakar use karna chahiye.

                Forex Trading Main Dragonfly Doji Ka Amal

                Forex trading main Dragonfly Doji ka pattern dekhne par traders apni strategies ko adjust karte hain. Aik trader ko yeh pattern dekh kar apni previous trades ko evaluate karna chahiye aur yeh dekhna chahiye ke kya yeh pattern kisi strong support level par bna hai. Agar yeh support level par bna ho, to yeh strong signal hota hai ke market ab reversal ki taraf ja raha hai. Yeh traders ko buy positions lene ka mauka deta hai, lekin yeh zaroori hai ke doosri confirmation signals, jese ke volume increase, RSI divergence, ya moving averages crossovers ko bhi madde nazar rakha jaye.

                Dragonfly Doji Ka Practical Istemaal

                Practical taur par Dragonfly Doji ka pattern trading ke decisions ko refine kar sakta hai. Jab yeh pattern support level par nazar aaye, to yeh potential buy signal hota hai. Aik trader is point par apne stop-loss levels ko define kar sakta hai jo low shadow ke neeche hote hain. Yeh risk management ke liye zaroori hai taake unexpected market movements se bach sakein. Sath hi, profit targets ko identify karna bhi zaroori hota hai jo previous resistance levels par ho sakte hain. Yeh approach disciplined trading practice ko ensure karti hai aur impulsive decisions se bachati hai.

                Note

                Dragonfly Doji ek powerful candlestick pattern hai jo forex trading main significant importance rakhta hai. Yeh pattern market ke sentiment aur potential reversals ke bare main valuable insights faraham karta hai. Lekin, yeh yaad rakhna chahiye ke har pattern ki tarah, Dragonfly Doji bhi apne akeli taur par trading decision ke liye kafi nahi hota. Isay doosri technical analysis tools ke sath milakar use karna chahiye taake trading strategies ko mazid strong aur reliable banaya ja sake. Har trader ke liye yeh zaroori hai ke woh patterns ko samajh kar aur unka tajziya kar ke informed decisions le aur market ke dynamics ko behtar tareeqe se handle kar sake.
                • #9 Collapse


                  Dragonfly Doji Candlestick Pattern In forex.


                  The Dragonfly Doji is a type of candlestick pattern used in technical analysis of financial markets, including forex trading. It is characterized by the following features:
                  1. Formation: The Dragonfly Doji has a long lower shadow with little to no upper shadow and a body that is at or very near the high of the session. This results in a "T"-shaped appearance.
                  2. Indication: This pattern typically signals a potential reversal, indicating that sellers were dominant for most of the session, but buyers regained control by the end, pushing the price back up to the opening level.
                  3. Bullish Reversal: In a downtrend, the Dragonfly Doji can signal a potential bullish reversal. It suggests that selling pressure might be exhausted and buyers could be gaining strength.
                  4. Confirmation: Traders usually look for confirmation in the following sessions. Confirmation might come in the form of a bullish candle following the Dragonfly Doji, indicating that buying pressure is continuing.

                  Here’s how you can identify and interpret the Dragonfly Doji in the context of forex trading:
                  1. Identify the Pattern: Look for a candlestick with a long lower shadow, little to no upper shadow, and a body that is at or very near the high of the session.
                  2. Context: Consider the context of the overall trend. A Dragonfly Doji in a downtrend is more significant than one in a sideways or uptrend.
                  3. Volume: Higher volume during the formation of the Dragonfly Doji can add credibility to the potential reversal signal.
                  4. Confirmation: Wait for confirmation in the following trading sessions. A bullish candle following the Dragonfly Doji can confirm the reversal signal.
                  5. Risk Management: Use appropriate risk management techniques, such as setting stop-loss orders below the low of the Dragonfly Doji, to manage potential risks.

                  By incorporating the Dragonfly Doji pattern into your technical analysis toolkit, you can gain insights into potential market reversals and improve your trading decisions.


                  Dragonfly Doji Candles Pattern in Forex Trading

                  Definition and Characteristics


                  The Dragonfly Doji is a unique candlestick pattern in technical analysis that indicates indecision in the market and potential reversals. Here are its key characteristics:
                  1. Appearance: The Dragonfly Doji has a long lower shadow, little to no upper shadow, and a small body that is positioned at or near the high of the session, creating a "T" shape.
                  2. Market Psychology: It reflects a session where sellers drove the price down significantly, but buyers pushed the price back up to the opening level by the end of the session, showing a battle between buyers and sellers.
                  Significance in Forex Trading


                  The Dragonfly Doji is important because it can signal a potential reversal in the market trend:
                  1. Bullish Reversal in Downtrend: When it appears after a downtrend, it suggests that selling pressure may be weakening and buyers might be gaining strength, indicating a possible bullish reversal.
                  2. Confirmation Needed: Traders often wait for confirmation, such as a bullish candle following the Dragonfly Doji, to validate the reversal signal.
                  How to Identify a Dragonfly Doji
                  1. Long Lower Shadow: The lower shadow should be significantly longer than the body, showing that the price dropped considerably during the session.
                  2. Small Body at the Top: The body should be at or very near the session high, indicating that the opening and closing prices are almost identical.
                  3. Little to No Upper Shadow: There should be little to no upper shadow, reinforcing that the buyers regained control by the end of the session.
                  Example of a Dragonfly Doji


                  Consider a forex chart where the price has been declining steadily. One session, the price opens at 1.1000, falls to 1.0900, but then rallies back to close at 1.0995. This forms a Dragonfly Doji, suggesting a potential shift from bearish to bullish sentiment.
                  Trading Strategy Using Dragonfly Doji
                  1. Identify the Pattern: Look for the Dragonfly Doji in a downtrend.
                  2. Wait for Confirmation: Observe the following session(s) for a bullish candlestick to confirm the reversal signal.
                  3. Enter the Trade: If confirmation occurs, consider entering a long position.
                  4. Set Stop-Loss: Place a stop-loss order below the low of the Dragonfly Doji to manage risk.
                  5. Take Profit: Set a target based on previous resistance levels or use a trailing stop to lock in profits as the price moves in your favor.
                  Example Trade
                  1. Identification: You spot a Dragonfly Doji at the end of a downtrend on the EUR/USD chart.
                  2. Confirmation: The next session forms a bullish candle, closing higher than the Dragonfly Doji.
                  3. Entry: Enter a long position at the opening of the following session.
                  4. Stop-Loss: Place a stop-loss just below the low of the Dragonfly Doji.
                  5. Take Profit: Set a take profit at a previous resistance level or use a trailing stop.
                  Risk Management


                  Always use proper risk management techniques to protect your capital. The forex market can be volatile, and relying solely on a single candlestick pattern without considering other factors and analysis can be risky.
                  Combining with Other Indicators


                  For better accuracy, combine the Dragonfly Doji pattern with other technical indicators such as moving averages, RSI (Relative Strength Index), or MACD (Moving Average Convergence Divergence). This helps in filtering out false signals and increasing the probability of successful trades.

                  By understanding and correctly identifying the Dragonfly Doji pattern, traders can potentially capitalize on significant market reversals, especially when the pattern is confirmed by other technical analysis tools and market context.


                  • #10 Collapse

                    Dragonfly Doji Candlestick Pattern in Forex Trading


                    Forex trading mein candlestick patterns ka bohot aham role hota hai kyunki yeh market ke potential reversals aur trends ko identify karne mein madadgar hote hain. Aaj hum ek aise hi specific candlestick pattern ke baare mein baat karenge jo "Dragonfly Doji Candlestick Pattern" ke naam se jaana jaata hai.
                    Dragonfly Doji Candlestick Pattern Kya Hai?


                    Dragonfly Doji ek candlestick pattern hai jo market ke indecision ko dikhata hai aur potential bullish reversal signal deta hai. Yeh pattern tab form hota hai jab open, high, aur close prices kareeb ek hi level par hote hain aur ek long lower shadow hoti hai. Yeh pattern indicate karta hai ke buyers ne control apne haath mein le liya hai, chahe day ke shuruat mein sellers dominate kar rahe the.
                    Pattern Ki Pehchaan:

                    Structure:
                    • Open, High, Close: Yeh teeno prices kareeb ek hi level par hote hain.
                    • Long Lower Shadow: Candle ki lower shadow bohot lambi hoti hai, jo indicate karti hai ke trading session ke doran price significantly neeche gayi thi lekin buyers ne usse wapas upar le aaye.
                    • No Upper Shadow: Upper shadow ya to hoti hi nahi, ya bohot chhoti hoti hai.
                    Market Context:
                    • Dragonfly Doji aksar downtrend ke baad appear hota hai, aur yeh bullish reversal ka signal ho sakta hai.
                    • Yeh pattern market ke indecision ko bhi indicate kar sakta hai jab downtrend weaken hone lage.
                    Pattern Kaise Kaam Karta Hai?

                    Market Psychology:


                    Dragonfly Doji tab form hota hai jab trading session ke doran price neeche girti hai lekin buyers usse wapas upar le aate hain aur price ko open price ke kareeb close karte hain. Yeh indicate karta hai ke buyers ka pressure increase ho gaya hai aur market ab reversal ki taraf ja sakti hai.
                    Confirmation:


                    Pattern ka confirmation zaroori hai. Confirmation tab milta hai jab next candle bullish hoti hai aur Dragonfly Doji ke high ko break karti hai.
                    Trading Strategy:

                    1. Identification:


                    Pehle downtrend ko identify karein aur phir Dragonfly Doji Pattern ko dekhein.
                    2. Entry Point:


                    Next candle jab Dragonfly Doji ke high ko break karein to buy position lein. Yeh aapka entry point hota hai.
                    3. Stop-Loss:


                    Stop-loss ko Dragonfly Doji ke low ke neeche place karein taake risk ko minimize kiya ja sake.
                    4. Take Profit:


                    Take profit ke liye apni strategy aur market conditions ko madde nazar rakhein. Aap resistance levels ya specific risk-reward ratio ko target kar sakte hain.
                    Example:


                    Chaliye ek example dekhte hain:
                    1. Downtrend: USD/JPY pair mein price 110.00 se gir kar 108.00 par aati hai.
                    2. Dragonfly Doji: Price 108.00 par open hoti hai, neeche gir kar 107.50 tak jati hai, lekin phir recover karke 108.00 par close hoti hai, ek Dragonfly Doji form karti hai.
                    3. Confirmation: Next day, price 108.50 ke upar close hoti hai jo Dragonfly Doji ke high ko break karti hai.
                    4. Entry Point: 108.50 par buy position lein.
                    5. Stop-Loss: Dragonfly Doji ke low, yani 107.50 ke neeche stop-loss set karein.
                    6. Take Profit: Next resistance level, maan lein 109.50 ko target karein.
                    Fayde:
                    • Clear Reversal Signal: Dragonfly Doji ek clear bullish reversal signal provide karta hai.
                    • Market Sentiment: Is pattern ko samajhne se market sentiment ka behtar andaza hota hai.
                    • Simple Identification: Is pattern ko identify karna relatively asaan hai.
                    Nuksanat:
                    • False Signals: Kabhi kabhi pattern false signals bhi de sakta hai, isliye confirmation zaroori hai.
                    • Market Volatility: High volatility ke doran pattern ki effectiveness kam ho sakti hai.
                    Conclusion:


                    Dragonfly Doji Candlestick Pattern forex trading mein ek powerful tool hai jo traders ko downtrend ke baad bullish reversal ka signal provide karta hai. Is pattern ko samajhna aur sahi tarah se istemal karna trading success ke liye bohot zaroori hai. Proper risk management aur confirmation ke sath, aap is pattern ka faida utha sakte hain aur apne trading decisions ko improve kar sakte hain.


                    4o
                    • #11 Collapse

                      DRAGONFLY DOJI PATTERN
                      Dragonfly doji candlestick pattern:
                      As salam o alaikum dear forex members, Dragonfly Doji ik candlestick pattern hy jo trading charts main dikha jata hy. Ye pattern tab banta hy jab open, high or close prices ik level par hoti hain or low price bilkul neeche hoti hy. Is pattern ka matlab hy ky market main sell orders zyada the likin buyers ne price ko upar la diya, is se ik strong bullish reversal ka signal milta hy.Dragonfly Doji candlestick pattern ik unique or powerful signal hota hy jo trading main support or resistance levels ko identify karne main madad karta hy. Ye pattern tab bantay hain jab opening, high, or closing prices almost equal hotay hain, or sirf ik long lower shadow hoti hy. Ye candlestick pattern signify karta hy ky market main bullish reversal aa sakta hy. Iska matlab hy ky buyers ne market ko push kiya hy or sellers ne apni position lose kar di hy, jiski wajah se market end of the session par open price ky kareeb close hota hy.Dragonfly Doji ka asal significance tab samajh aata hy jab ye pattern kisi strong downtrend ky baad form hota hy. Ye ik strong indication ho sakta hy ky market bottom hit kar chuka hy or ab buyers market ko higher levels par le ja sakte hain. Is pattern ka accurate analysis bohot zaroori hy kyunki false signals bhi mil sakte hain agar isko context main dikha na jaye.


                      Identification of Dragonfly Doji Candlestick Pattern

                      Hello dear traders, Dragonfly Doji candlestick pattern ko identify karne ky liye kuch khas characteristics ko dikhna zaroori hy:
                      1. Opening or Closing Price: Ye donon almost equal honi chahiye.
                      2. Lower Shadow: Ye shadow bohot lambi honi chahiye.
                      3. Upper Shadow: Ye shadow ya to bilkul nahi honi chahiye ya bohot choti honi chahiye.
                      Dear friends,Jab ye pattern ik downtrend ky baad banta hy, toh ye signify karta hy ky buyers market main wapas aa gaye hain or price ko upar push karne ki koshish kar rahe hain.
                      Dragonfly Doji pattern ko dikh kar, traders ko isky formation ky sath sath usky context par bhi nazar rakhni chahiye. Agar ye pattern ik kyy support level par form hota hy, toh ye or bhi strong bullish signal ho sakta hy. Support levels wo levels hote hain jahan se price pehle bhi bounce kar chuki hoti hy. Support levels par Dragonfly Doji ka formation signify karta hy ky buyers ne wahan par strong buying interest show kiya hy.
                      Is pattern ky saath volume bhi bohot aham role ada karta hy. Agar Dragonfly Doji pattern high volume ky sath form ho, toh ye signify karta hy ky market participants ne actively participate kiya hy, or ye pattern zyada reliable hota hy. High volume ky sath formation ka matlab hy ky buyers or sellers ky darmiyan intense battle hui, or end main buyers ne control hasil kiya. Ye scenario market sentiment ky strong shift ko represent karta hy.

                      Click image for larger version

Name:	doji.jpg
Views:	20
Size:	14.4 کلوبائٹ
ID:	13030839​​​​​​​
                      • <a href="https://www.instaforex.org/ru/?x=ruforum">InstaForex</a>
                      • #12 Collapse

                        **Dragonfly Doji Candlestick Pattern In Forex**
                        Forex market mein candlestick patterns ki understanding ka hona bohat zaroori hai, kyunki ye traders ko market trends aur reversals ko samajhne mein madad deta hai. Aaj hum baat karenge Dragonfly Doji candlestick pattern ki, jo ek important reversal signal hai.

                        Dragonfly Doji pattern ek single candlestick pattern hai, jise identify karne ke liye kuch key characteristics hote hain. Ye candlestick pattern typically market ke bottom ya downtrend ke baad dikhai deta hai aur bullish reversal indicate karta hai.

                        Is pattern ko samajhne ke liye, pehle candlestick ka structure dekhte hain. Dragonfly Doji mein body nahi hoti, sirf ek chhoti si horizontal line (shadow) hoti hai jo upper wick ko represent karti hai. Iska matlab hai ki opening price aur closing price almost same hote hain, lekin during the session price ne neeche jaane ke baad upper wick ke through recover kar liya.

                        Jab Dragonfly Doji candlestick downtrend ke baad form hota hai, iska interpretation yeh hota hai ki sellers initially strong thay lekin phir se buyers ne control le liya hai aur market upward move kar sakta hai. Yeh reversal signal tab hota hai jab next candlestick bullish pattern dikhaye ya phir strong bullish confirmation mile.

                        Is pattern ko confirm karne ke liye, traders volume ko bhi dekhte hain. Agar Dragonfly Doji candlestick volume ke saath form hota hai aur uske baad volume increase hota hai, toh yeh bullish reversal ke liye strong confirmation hota hai.

                        Lekin, hamesha yaad rahe ke kisi bhi candlestick pattern ko confirm karne ke liye sirf ek candlestick ki nahi, balki surrounding market context aur other technical indicators ki bhi zaroorat hoti hai. Dragonfly Doji pattern ke signals ko effectively use karne ke liye thorough analysis aur risk management bhi zaroori hai.

                        In conclusion, Dragonfly Doji candlestick pattern forex traders ke liye powerful tool hai market trends aur reversals ko samajhne ke liye. Is pattern ko samajhna aur uska sahi tareeqe se use karna traders ke liye critical skills hain jo consistent success ke liye essential hote hain.

                        Agar aap bhi candlestick patterns ko study karna chahte hain, to Dragonfly Doji ke sath practical trading experience gain karen aur market ka better understanding develop karen. Happy trading!

                        اب آن لائن

                        Working...
                        X