Introduction
forex market mein piercing line candlestick pattern aik kesam ka bullish trend reversal candlestick pattern hota hey jo keh downtrend kay lower part mein he banta hy forex market kay trend mein bull enter ho jatay hein market ke prices oper ke taraf push ho jate hein
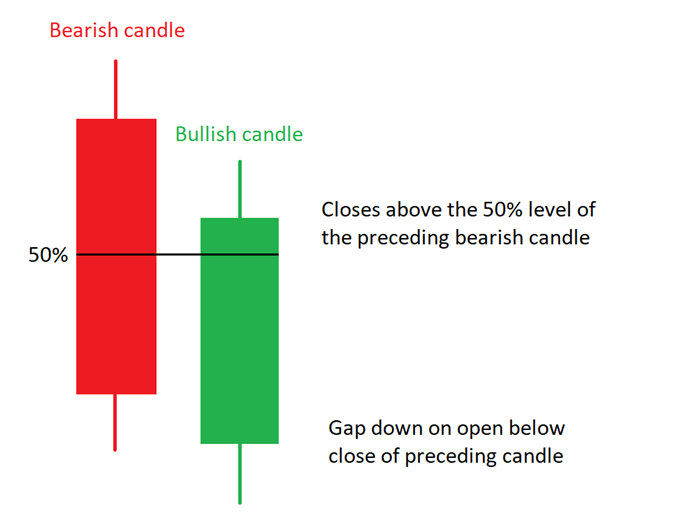
piercing pattern mein 2 kesam ke candlestick involve ho jate hein je mein dosree bullish candlestick pechle bearish candlestick say kam open hote hey es kay bad bear market ko increase karnay say 50% say up par ja kar close ho jate hein
Piercing line candlestick ke pehchan
yeh pattern forex market mein down trend kay bottom mein he banta hey
es kesam kay pattern mein bearish ya bullish bhe shamel hote hein
bullish candlestick bearish candlestick say nechay he close ho jate hey
bullish candlestick bearish candlestick kay 50% say bhe oper he close ho jate hey
yeh trend reversal up side ke taraf he chala jata hey
Trade with Piercing line Pattern
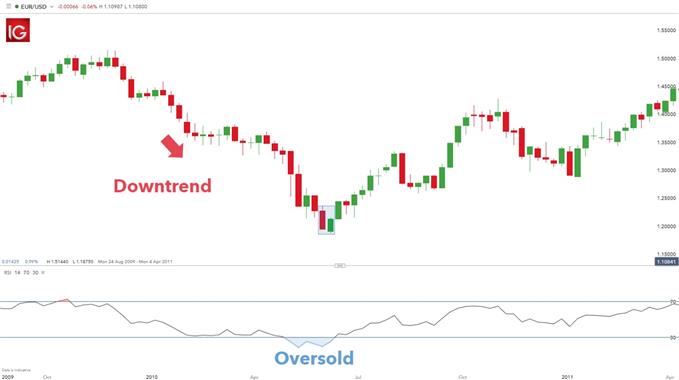
oper EUR/USD ka weekly chart pattern deya geya hey jo keh forex market mein nellay rang mein wazah kardah piercing pattern he hota hey es pattern say pehlay aik strong nechay ka trend hota hey jaisa keh lower level ya lower highs say zahair hota hey trend kay tayon karnay kay ley price action ke wazahat kar de gay hey tahu forex market kay trade confirmation kay ley aik technical indicator ka estamal kar saktay hein jaisa keh moving average shamel hota hey
jaisa keh pehlay batya ja choka hey keh forex arket ke log trading mein enter honay kay ley piercing pattern ke confirmation ke zaroorat hote hey RSI oscillator revesal janay ke ezafe confirmation ko estamal karta hey RSI oversold level ko identify kar sakta hey jees say piercing pattern ke daristge ko stregth melte hey
forex market mein piercing line candlestick pattern aik kesam ka bullish trend reversal candlestick pattern hota hey jo keh downtrend kay lower part mein he banta hy forex market kay trend mein bull enter ho jatay hein market ke prices oper ke taraf push ho jate hein
piercing pattern mein 2 kesam ke candlestick involve ho jate hein je mein dosree bullish candlestick pechle bearish candlestick say kam open hote hey es kay bad bear market ko increase karnay say 50% say up par ja kar close ho jate hein
Piercing line candlestick ke pehchan
yeh pattern forex market mein down trend kay bottom mein he banta hey
es kesam kay pattern mein bearish ya bullish bhe shamel hote hein
bullish candlestick bearish candlestick say nechay he close ho jate hey
bullish candlestick bearish candlestick kay 50% say bhe oper he close ho jate hey
yeh trend reversal up side ke taraf he chala jata hey
Trade with Piercing line Pattern
oper EUR/USD ka weekly chart pattern deya geya hey jo keh forex market mein nellay rang mein wazah kardah piercing pattern he hota hey es pattern say pehlay aik strong nechay ka trend hota hey jaisa keh lower level ya lower highs say zahair hota hey trend kay tayon karnay kay ley price action ke wazahat kar de gay hey tahu forex market kay trade confirmation kay ley aik technical indicator ka estamal kar saktay hein jaisa keh moving average shamel hota hey
jaisa keh pehlay batya ja choka hey keh forex arket ke log trading mein enter honay kay ley piercing pattern ke confirmation ke zaroorat hote hey RSI oscillator revesal janay ke ezafe confirmation ko estamal karta hey RSI oversold level ko identify kar sakta hey jees say piercing pattern ke daristge ko stregth melte hey


تبصرہ
Расширенный режим Обычный режим